Attached files
| file | filename |
|---|---|
| 8-K - 8-K - KAPSTONE PAPER & PACKAGING CORP | a13-17285_18k.htm |
| EX-99.1 - EX-99.1 - KAPSTONE PAPER & PACKAGING CORP | a13-17285_1ex99d1.htm |
Exhibit 99.2
|
|
2013 Second Quarter Financial Review Roger W. Stone Chairman and Chief Executive Officer Andrea K. Tarbox Vice President and Chief Financial Officer July 31, 2013 |
|
|
Forward Looking Statements The information in this presentation and statements made during this presentation may contain certain forward-looking statements within the meaning of federal securities laws. These statements reflect management’s expectations regarding future events and operating performance. These forward-looking statements involve a number of risks and uncertainties. A list of the factors that could cause actual results to differ materially from those expressed in, or underlying, any forward-looking statements can be found in the Company’s filings with the Securities and Exchange Commission, such as its annual and quarterly reports. The Company disclaims any obligation to revise or update such statements to reflect the occurrence of events after the date of this presentation. This presentation refers to certain non-U.S. GAAP financial information. A reconciliation of non-U.S. GAAP to U.S. GAAP financial measures is available on the company’s website at KapStonepaper.com under Investors. Forward-Looking Statements Non-GAAP Financial Measures Risk Factors 2 |
|
|
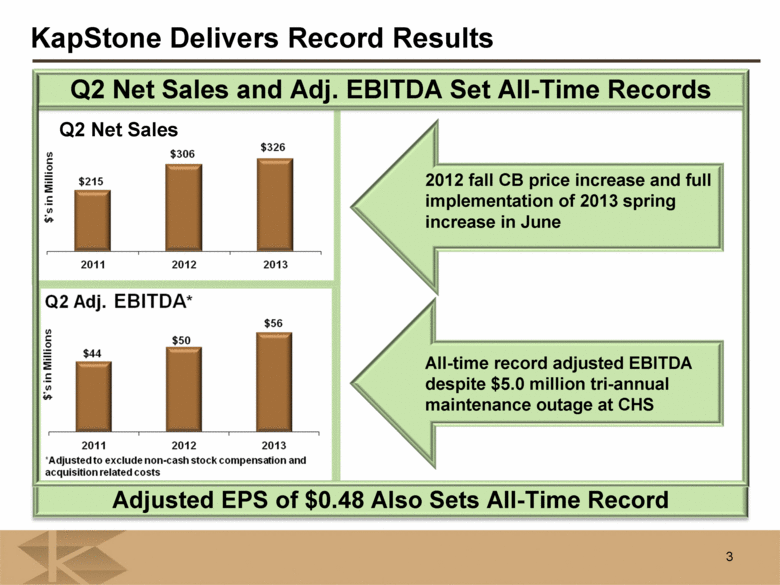
3 Q2 Net Sales and Adj. EBITDA Set All-Time Records Q2 Net Sales KapStone Delivers Record Results 2012 fall CB price increase and full implementation of 2013 spring increase in June All-time record adjusted EBITDA despite $5.0 million tri-annual maintenance outage at CHS Adjusted EPS of $0.48 Also Sets All-Time Record * Adjusted to exclude non-cash stock compensation and acquisition related costs |
|
|
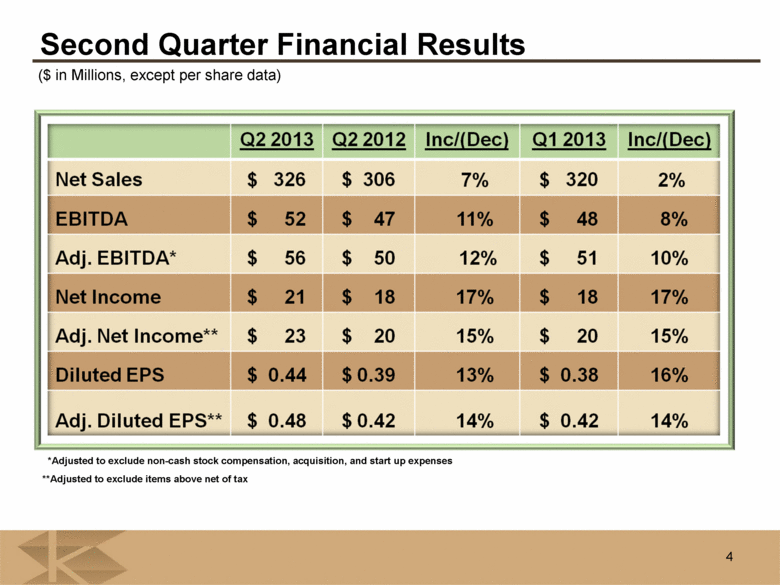
Second Quarter Financial Results 4 *Adjusted to exclude non-cash stock compensation, acquisition, and start up expenses **Adjusted to exclude items above net of tax ($ in Millions, except per share data) |
|
|
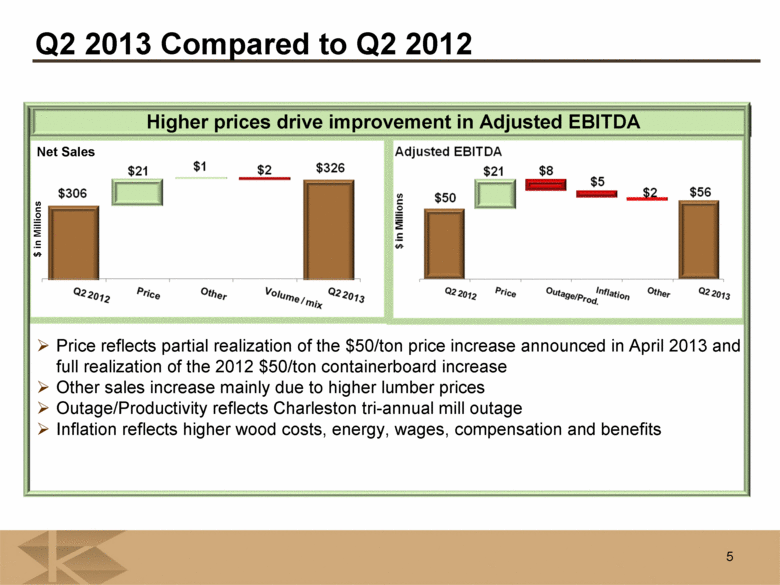
Higher prices drive improvement in Adjusted EBITDA 5 Q2 2013 Compared to Q2 2012 Price reflects partial realization of the $50/ton price increase announced in April 2013 and full realization of the 2012 $50/ton containerboard increase Other sales increase mainly due to higher lumber prices Outage/Productivity reflects Charleston tri-annual mill outage Inflation reflects higher wood costs, energy, wages, compensation and benefits Net Sales $ in Millions |
|
|
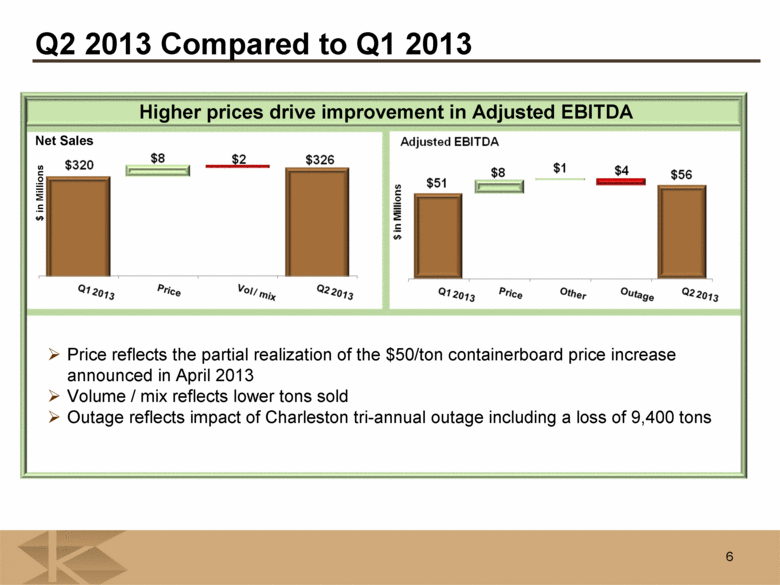
Higher prices drive improvement in Adjusted EBITDA 6 Q2 2013 Compared to Q1 2013 Price reflects the partial realization of the $50/ton containerboard price increase announced in April 2013 Volume / mix reflects lower tons sold Outage reflects impact of Charleston tri-annual outage including a loss of 9,400 tons Net Sales $ in Millions |
|
|
7 Balance Sheet and Free Cash Flows Net debt at June 30, 2013 was $312 million Net debt to EBITDA ratio of 1.57 times at June 30, 2013 Net debt to EBITDA ratio of 3.80 times on July 18, 2013 Interest rate was 1.95 percent at June 30, 2013 Interest rate as of July 18, 2013 is 2.6% Free cash flow of $39 million for Q2 2013, or $0.81 per diluted share Working capital showed seasonal improvement Capex for Q2 2013 was $16 million Capex for the second half of 2013 is projected to be $60 million for the combined company |
|
|
Summary of Key Assumptions for Q3 2013 Longview results consolidated effective July 18th April 2013 $50 per ton containerboard and 10 to 12 percent corrugated products price increases fully implemented by June Combined KapStone’s Q3 benefits from the April containerboard increase should be approximately $11 million higher compared to Q2 Once fully implemented, combined annualized benefit of approximately $90 million Q3 2013 has 1 more mill production day than Q2 2013 and 1 less corrugated shipping day Q3 2013 current planned outages of $4 million. No loss of production tons Continued upward cost pressure on SE fiber costs (very rainy summer in SE). NW fiber costs are expected to remain fairly stable SG&A expenses expected to include $3 million one-time transaction expenses for LV acquisition Interest expense and debt fee amortization on new credit agreement and $3 million for accelerated amortization of prior debt fees. Combined effective income tax rate of 35.0 percent excluding discrete adjustments 8 |
|
|
Appendix |
|
|
10 Components of Quarterly Net Sales Avg. Revenue per Mill Ton Domestic CB DuraSorb Kraft Paper Kraftpak Product Mix |

