Attached files
| file | filename |
|---|---|
| 8-K - FORM 8-K - PUBLIC SERVICE ENTERPRISE GROUP INC | d574462d8k.htm |
| EX-99 - EX-99 - PUBLIC SERVICE ENTERPRISE GROUP INC | d574462dex99.htm |
 Public Service Enterprise Group
PSEG Earnings Conference Call
2nd Quarter 2013
July 30, 2013
Exhibit 99.1 |
| 1
Forward-Looking Statement
Certain of the matters discussed in this report constitute “forward-looking statements”
within the meaning of the Private Securities Litigation Reform Act of 1995. Such
forward-looking statements are subject to risks and uncertainties, which could cause actual results to differ materially from those anticipated. Such
statements are based on management’s beliefs as well as assumptions made by and information
currently available to management. When used herein, the word “anticipate,”
“intend,” “estimate,” “believe,” “expect,” “plan,” “should,” “hypothetical,” “potential,” “forecast,” “project,” variations of such words and similar
expressions are intended to identify forward-looking statements. Factors that may cause
actual results to differ are often presented with the forward-looking statements
themselves. Other factors that could cause actual results to differ materially from those contemplated in any forward-looking statements made by us
herein are discussed in Item 1. Financial Statements—Note 9. Commitments and Contingent
Liabilities, Item 2. Management’s Discussion and Analysis of Financial Condition and
Results of Operations, and other factors discussed in filings we make with the United States Securities and Exchange Commission (SEC).
These factors include, but are not limited to: All of the forward-looking statements made in this report are qualified by these cautionary
statements and we cannot assure you that the results or developments anticipated by management
will be realized or even if realized, will have the expected consequences to, or effects on, us or our business prospects, financial
condition or results of operations. Readers are cautioned not to place undue reliance on these
forward-looking statements in making any investment decision. Forward-looking
statements made in this report apply only as of the date of this report. While we may elect to update forward-looking statements from time to time,
we specifically disclaim any obligation to do so, even if internal estimates change, unless otherwise
required by applicable securities laws. The forward-looking statements contained in
this report are intended to qualify for the safe harbor provisions of Section 27A of the Securities Act of 1933, as amended, and
Section 21E of the Securities Exchange Act of 1934, as amended. •
adverse changes in the demand for or the price of the capacity and energy that we
sell into wholesale electricity markets, •
adverse changes in energy industry law, policies and regulation, including market
structures and a potential shift away from competitive markets toward subsidized
market mechanisms, transmission planning and cost allocation rules, including rules
regarding how transmission is planned and who is permitted to build transmission
in the future, and reliability standards,
•
any inability of our transmission and distribution businesses to obtain adequate
and timely rate relief and regulatory approvals from federal and state regulators,
•
changes in federal and state environmental regulations that could increase our
costs or limit our operations, •
changes in nuclear regulation and/or general developments in the nuclear power
industry, including various impacts from any accidents or incidents experienced at
our facilities or by others in the industry, that could limit operations of our
nuclear generating units, •
actions
or
activities
at
one
of
our
nuclear
units
located
on
a
multi-unit
site
that
might
adversely
affect
our
ability
to
continue
to
operate
that
unit
or
other
units
located
at the same site,
•
any inability to balance our energy obligations, available supply and risks,
•
any deterioration in our credit quality or the credit quality of our
counterparties, including in our leveraged leases, •
availability of capital and credit at commercially reasonable terms and conditions
and our ability to meet cash needs, •
changes in the cost of, or interruption in the supply of, fuel and other
commodities necessary to the operation of our generating units, •
delays in receipt of necessary permits and approvals for our construction and
development activities, •
delays or unforeseen cost escalations in our construction and development
activities, •
any inability to achieve, or continue to sustain, our expected levels of operating
performance, •
any equipment failures, accidents, severe weather events or other incidents that
impact our ability to provide safe and reliable service to our customers,
and any inability to sufficiently obtain coverage or recover proceeds of insurance
on such matters, •
increases in competition in energy supply markets as well as competition for
certain rate-based transmission projects, •
any inability to realize anticipated tax benefits or retain tax
credits,
•
challenges associated with recruitment and/or retention of a qualified
workforce, •
adverse
performance
of
our
decommissioning
and
defined
benefit
plan
trust
fund
investments
and
changes
in
funding
requirements,
and
•
changes in technology and customer usage patterns. |
| 2
GAAP Disclaimer
PSEG presents Operating Earnings in addition to Income from Continuing
Operations/Net Income reported in accordance with accounting principles
generally accepted in the United States (GAAP). Operating Earnings is a
non-GAAP financial measure that differs from Net Income because it
excludes gains or losses associated with Nuclear Decommissioning
Trust
(NDT), Mark-to-Market (MTM) accounting, and other material one-time
items. PSEG presents Operating Earnings because management believes
that it is appropriate for investors to consider results excluding these
items in addition to the results reported in accordance with GAAP.
PSEG believes that the non-GAAP financial measure of Operating Earnings
provides a consistent and comparable measure of performance of its
businesses to help shareholders understand performance trends. This
information is not
intended to be viewed as an alternative to GAAP
information. The last slide in this presentation includes a list
of items
excluded from Income from Continuing Operations/Net Income to reconcile
to Operating Earnings, with a reference to that slide included on each of the
slides where the non-GAAP information appears.
|
| PSEG
2013 Q2 Review
Ralph Izzo
Chairman, President and Chief Executive Officer
EXHIBIT 99.1 |
 4
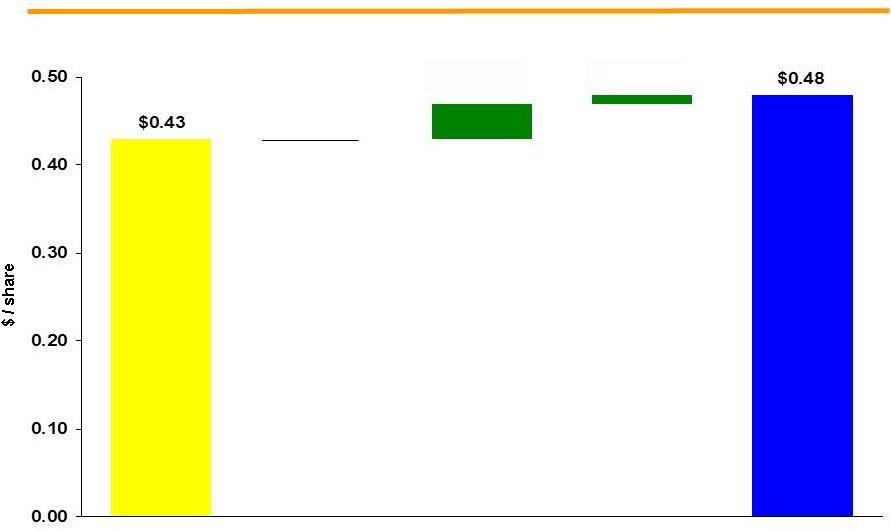
Q2 Earnings Summary
$ millions (except EPS)
2013
2012
Operating Earnings
$ 243
$ 215
Reconciling Items, Net of Tax
90
(4)
Income from Continuing Operations/Net
Income
$ 333
$ 211
EPS from Operating Earnings*
$ 0.48
$ 0.43
Quarter ended June
30 * See
Page A for Items excluded from Income from Continuing Operations/Net Income to reconcile to Operating Earnings. |
 5
First Half 2013 Earnings Summary
$ millions (except EPS)
2013
2012
Operating Earnings
$ 676
$ 647
Reconciling Items, Net of Tax
(23)
57
Income from Continuing Operations/
Net Income
$ 653
$ 704
EPS from Operating Earnings*
$ 1.33
$ 1.28
Six months ended June 30
* See Page A for Items excluded from Income from Continuing Operations/Net Income to reconcile to
Operating Earnings. |
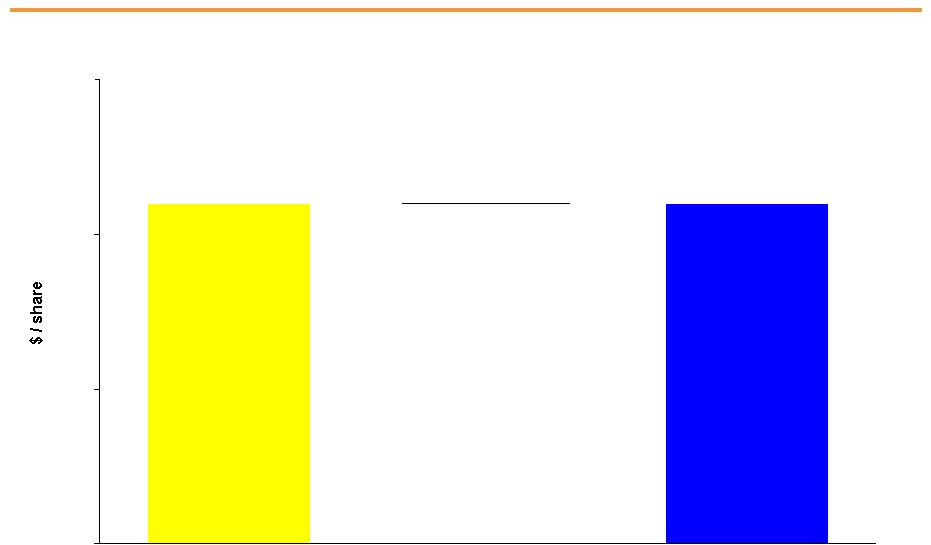
 6
PSEG –
Q2 2013 Highlights
Strong Earnings
Operating earnings of $0.48 vs. $0.43 per share in Q2 2012
Power benefitted from higher PJM capacity prices and an improvement in market
prices for energy Increased contribution to earnings from
PSE&G’s investment in transmission Operational Excellence
PSEG Power output was flat in Q2 despite extended refueling at Salem 1
Diversity and location of Power’s fleet provided flexibility to participate in
market PSE&G’s O&M on track to meet full-year
expectations PSEG Disciplined Capital Investment
BPU approved Solar Agreement to extend Solar 4 All and Solar Loan III
investment 54
NJ
municipalities
and
five
counties
have
approved
resolutions
in
support
of
PSE&G’s
Energy Strong proposal to fortify its electric and gas distribution systems
Transmission construction program continues on schedule
Market Developments
2016/2017 RPM auction again recognized the locational advantage of Power’s
assets US District Court decision on LCAPP litigation awaited in both NJ and
MD New LIPA agreement under consideration would broaden and extend original
contract terms |
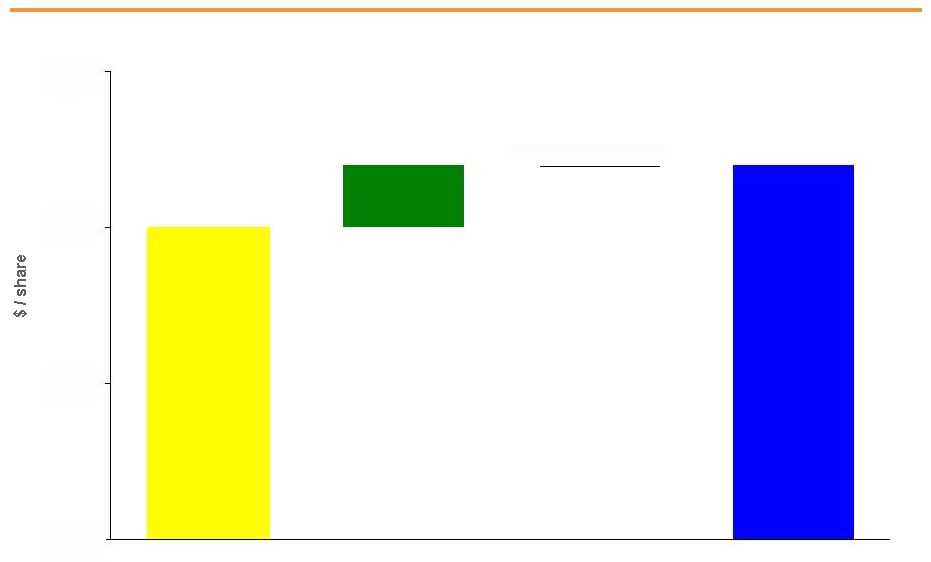
 7
$2.25 -
$2.50E
PSEG –
Maintaining 2013 Guidance
$2.74
* See Slide A for Items excluded from Income from Continuing Operations/Net Income
to reconcile to Operating Earnings. E = Estimate.
$2.44
Based on our performance year-to-date, we expect operating
earnings for the full year to be at the upper end of guidance
assuming normal weather and unit operations
2011 Operating Earnings*
2012 Operating Earnings*
2013 Operating Earnings Guidance |
 PSEG
2013 Q2 Operating Company Review
Caroline Dorsa
EVP and Chief Financial Officer |
 9
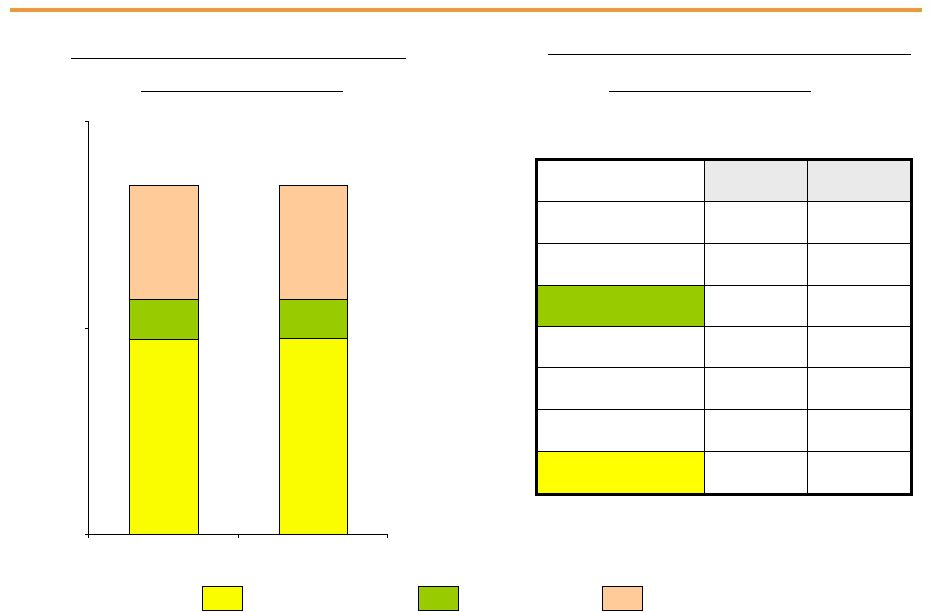
Q2 Operating Earnings by Subsidiary
Operating Earnings
Earnings per Share
$ millions (except EPS)
2013
2012
2013
2012
PSEG Power
$ 114
$ 110
$ 0.22
$ 0.22
PSE&G
121
101
0.24
0.20
PSEG Energy Holdings/
Enterprise
8
4
0.02
0.01
Operating Earnings*
$ 243
$ 215
$ 0.48
$ 0.43
Quarter ended June 30
* See Page A for Items excluded from Income from Continuing Operations/Net Income
to reconcile to Operating Earnings. |
 10
PSEG EPS Reconciliation –
Q2 2013 versus Q2 2012
Capacity 0.07
Market Prices
on Un-hedged
Generation 0.04
Lower Pricing
on Hedged
Generation (0.11)
Transmission 0.04
Taxes and
Other 0.01
Net
Weather
(0.01)
Q2 2013
Operating
Earnings*
Q2 2012
Operating
Earnings*
PSEG Power
PSE&G
Energy
Holdings/
Enterprise
Asset Sale
* See Page A for Items excluded from Income from Continuing Operations/Net Income
to reconcile to Operating Earnings. 0.00
0.04
0.01 |
 11
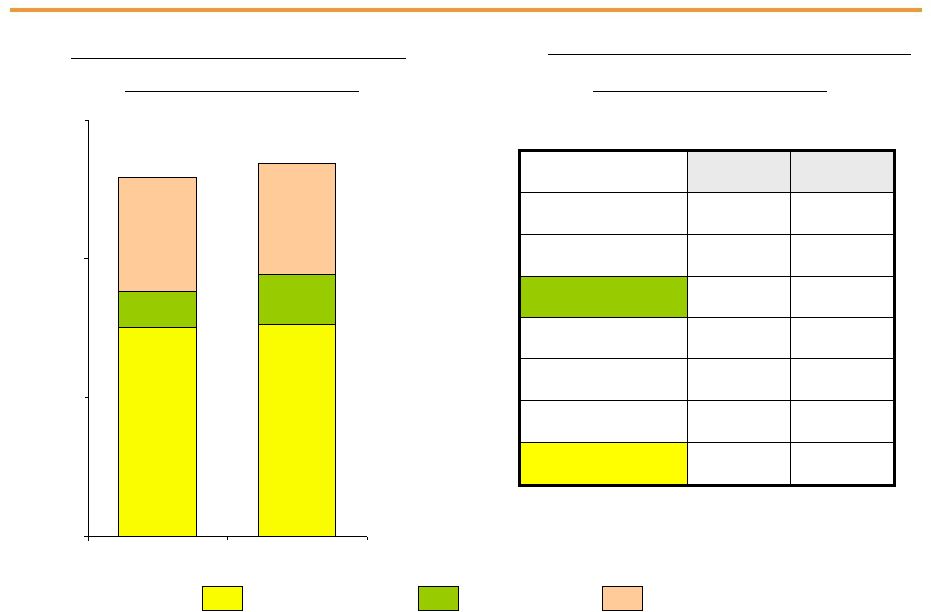
First Half Operating Earnings by Subsidiary
Operating Earnings
Earnings per Share
$ millions (except EPS)
2013
2012
2013
2012
PSEG Power
$ 364
$ 306
$ 0.71
$ 0.60
PSE&G
300
298
0.59
0.59
PSEG Energy Holdings/
Enterprise
12
43
0.03
0.09
Operating Earnings*
$ 676
$ 647
$ 1.33
$ 1.28
Six months ended June 30
•See Page A for Items excluded from Income from Continuing Operations/Net
Income to reconcile to Operating Earnings. |
 12
PSEG EPS Reconciliation –
YTD 2013 versus YTD 2012
YTD 2013
Operating
Earnings*
YTD 2012
Operating
Earnings*
Capacity 0.12
Net Price (0.05)
Volume 0.02
Gas Send-Out
and Fixed Cost
Recovery 0.04
O&M (0.01)
D&A (0.01)
PSEG Power
Transmission
Net Earnings 0.07
Distribution
O&M (0.02)
Net
Weather 0.01
Taxes
and Other 0.01
Absence
of Tax
Settlement (0.06)
D&A (0.01)
PSE&G
PSEG Energy
Holdings/
Enterprise
Asset Sale 0.01
Absence
of Tax
Settlement
(0.07)
* See Page A for Items excluded from Income from Continuing Operations/Net Income
to reconcile to Operating Earnings. 0.00
$1.33
(0.06)
0.11
$1.28
0.00
0.25
0.50
0.75
1.00
1.25
1.50 |
 PSEG
Power 2013 Q2 Review |
 14
PSEG Power –
Q2 2013 EPS Summary
* See Page A for Items excluded from Income from Continuing Operations/Net Income
to reconcile to Operating Earnings. **Includes the financial impact from
positions with forward delivery months. $ millions (except EPS)
Q2 2013
Q2 2012
Variance
Operating Revenues
$ 1,190
$ 985
$ 205
Operating Earnings
114
110
4
NDT Funds Related
Activity, Net
of Tax 8
4
4
Mark-to-Market, Net of Tax**
80
(10)
90
Storm O&M, Net of Insurance
Recoveries
2
-
2
Income from Continuing
Operations/Net Income
$ 204
$ 104
$ 100
EPS from Operating Earnings*
$ 0.22
$ 0.22
$0.00 |
 15
$0.22
$0.22
0.00
0.10
0.20
0.30
Capacity 0.07
Market Prices
on Un-hedged
Generation 0.04
Lower Pricing
on Hedged
Generation (0.11)
PSEG Power EPS Reconciliation –
Q2 2013 versus Q2 2012
Q2 2013
Operating
Earnings*
Q2 2012
Operating
Earnings*
* See Page A for Items excluded from Income from Continuing Operations/Net Income
to reconcile to Operating Earnings. 0.00 |
 16
PSEG Power –
Q2 2013 Generation Measures
7,075
7,147
4,177
4,187
1,454
1,384
0
7,500
15,000
2012
2013
Quarter
ended
June
30
Total Nuclear
Total Coal*
Oil & Natural Gas
* Includes figures for Pumped Storage. Includes Hudson and Mercer when run on gas.
PSEG Power –
Generation (GWh)
12,706
12,718
Quarter
ended
June
30
PSEG
Power
–
Capacity
Factors
(%)
2012
2013
Combined
Cycle
PJM and NY
57%
57%
Coal
NJ (Coal/Gas)
14%
8%
PA
64%
70%
CT
3%
3%
Nuclear
87.2%
87.9% |
 17
PSEG Power –
YTD 2013 Generation Measures
15,045
15,284
8,001
2,585
3,590
8,219
0
10,000
20,000
30,000
2012
2013
Six
Months
ended
June
30
Total Nuclear
Total Coal*
Oil & Natural Gas
* Includes figures for Pumped Storage. Includes Hudson and Mercer when run on
gas. PSEG Power –
Generation (GWh)
25,849
26,875
Six
Months
ended
June
30
PSEG
Power
–
Capacity
Factors
(%)
2012
2013
Combined Cycle
PJM and NY
57%
55%
Coal
NJ (Coal/Gas)
8%
13%
PA
63%
78%
CT
3%
19%
Nuclear
92.7%
94.4% |
 18
PSEG Power –
Fuel Costs
PSEG Power –
Fuel Costs
Quarter ended June 30
($ millions)
2012
2013
Coal
$39
$30
Oil & Gas
113
160
Total Fossil
152
190
Nuclear
48
52
Total Fuel Cost
$200
$242
Total Generation
(GWh)
12,706
12,718
$ / MWh
15.74
19.03
YTD June 30
($ millions)
2012
2013
Coal
$77
$96
Oil & Gas
241
338
Total Fossil
318
434
Nuclear
98
110
Total Fuel Cost
$416
$544
Total Generation
(GWh)
25,849
26,875
$ / MWh
16.09
20.24 |
 19
$0
$10
$20
$30
$40
$50
$60
2011
2012
2013
$49
$43
$43
PSEG Power –
Gross Margin Performance
Locational
advantage
of
generating
portfolio
offset
lower
prices
in
hedged products
Q2 spot prices higher across PJM-W, PS Zone, ISO-NE and NYISO
Margins
stable
with
higher
capacity
pricing
offsetting
lower
net
pricing
Migration volumes in line with expectations
PSEG Power Gross Margin ($/MWh)
Quarter ended
June 30
Regional Performance
Region
Q2 2013
Gross
Margin ($M)
2013 Performance
PJM
$523
Roll-off of higher priced hedges
offset higher capacity prices versus
a year ago and flat generation
output.
New
England
$15
Higher pricing on flat volume.
New York
$12
Higher pricing on flat volume. |
 20
Hedging Update…
Contracted Energy*
*
Hedge
percentages
and
prices
as
of
June
28,
2013.
Revenues
of
full
requirement
load
deals
based
on
contract
price,
including
renewable
energy
credits,
ancillary,
and
transmission
components
but
excluding
capacity.
Hedges
include
positions
with
MTM
accounting
treatment
and
options.
Volume TWh
17
35
35
Base Load
% Hedged
100%
90-95%
50-55%
(Nuclear and Base Load Coal)
Price $/MWh
$51
$49
$49
Volume TWh
11
18
17
Intermediate Coal, Combined
% Hedged
30-35%
0%
0%
Cycle, Peaking
Price $/MWh
$51
$49
$49
Volume TWh
26-28
53-55
52-54
Total
% Hedged
70-75%
55-60%
30-35%
Price $/MWh
$51
$49
$49
Jul -Dec
2013
2014
2015 |
 21
PSEG Power –
Q2 2013 Highlights
Q2 output was flat year-over-year, reflecting Salem 1 extended refueling
and a 6 day forced outage at Hope Creek
Nuclear capacity factor was 87.9% for Q2 and 94.4% for the YTD
Equivalent availability factors for CCGT units restored to pre-Sandy levels
near 90% Output of NJ coal units was 38% coal, 62% gas fueled for the
YTD Operations
Regulatory and Market
Environment
Capacity auction results continue to recognize the locational advantage of
Power’s assets: For the 2016/2017 RPM auction, Power cleared
8,637 MW of capacity at an average price of $166/MW-day
Higher spot power prices across PJM, NYISO, and ISO-NE continued in Q2
Remainder of 2013 anticipated base load output hedged at an average price of
$51/MWh Decisions in Federal Court for NJ and MD LCAPP cases pending
Financial
Storm related spending was $22 million pre-tax in Q2, $50 million YTD and $135
million storm-to-date (before insurance recoveries thus far
totalling $44 million) Power’s total debt as a percentage of capital at
June 30 was 28% Power paid at maturity a $300 million, 2.5% senior note in
April |
 PSE&G
2013 Q2 Review |
 23
PSE&G –
Q2 Earnings Summary
$ millions (except EPS)
Q2 2013
Q2 2012
Variance
Operating Revenues
$ 1,423
$ 1,407
$ 16
Operating Expenses
Energy Costs
580
622
(42)
Operation & Maintenance
369
350
19
Depreciation & Amortization
207
188
19
Taxes Other than Income Taxes
14
20
(6)
Total Operating Expenses
1,170
1,180
(10)
Operating Earnings / Net Income
121
101
20
EPS from Operating Earnings
$ 0.24
$ 0.20
$ 0.04 |
 24
PSE&G EPS Reconciliation –
Q2 2013
versus Q2 2012
Q2 2013
Operating
Earnings
Q2 2012
Operating
Earnings
Transmission
Net Earnings
Taxes and
Other 0.01
Net
Weather (0.01)
$0.24
0.00
0.04
$0.20
0.00
0.10
0.20
0.30 |
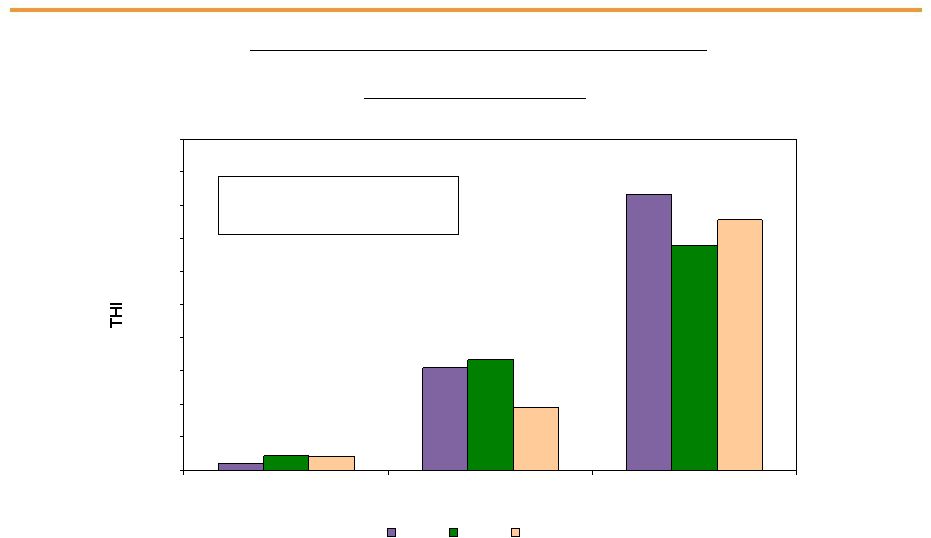 25
PSE&G –
Monthly Summer Weather Data
83
1,242
3,330
179
1,331
2,718
163
754
3,023
0
400
800
1200
1600
2000
2400
2800
3200
3600
4000
April
May
June
2013
2012
Normal
2013 vs. 2012 vs. Normal
PSE&G Monthly Temperature Humidity Index (THI)
+ 10% Q2 2013 vs. Q2 2012
+ 18% Q2 2013 vs. Normal |
 26
PSEG Capital Expenditures 2013-2015
Capital Spending
($ Millions)
Prior
2013-2015E
Updated
2013-2015E
PSE&G
Transmission
$3,430
$3,430
Distribution
1,330
1,330
Renewables
140
355
PSE&G Total
$4,900
$5,115
Power
1,070
1,070
Other-Renewables
50
50
Other
115
115
PSEG Total
$6,135
$6,350
Revised PSE&G 2013-2015 Capital Spending forecast includes new solar
programs Transmission investment represents over 50% of planned capital spend
over 2013-2015 *Estimate; Updated 2013-2015 Capital Spending revisions do not reflect the Energy Strong filing,
or the $1.5 billion of Transmission hardening. |
 27
PSE&G –
Q2 2013 Highlights
Operations
BPU approved Solar Agreement to spend up to $247 million on Solar 4 All
extension and up to $199 million on Solar Loan III program
Continuing regulatory process on Energy Strong infrastructure proposal to invest
$3.9 billion over the next ten years on electric and gas system hardening
and resiliency Advancing plans for Transmission hardening program of $1.5
billion over 10 years Construction of major Transmission lines progressing on
schedule PSE&G is earning its authorized return on equity
PSE&G’s capital budget for 2013-2015 revised to $5.1 billion from $4.9
billion, to reflect approval of expanded investment in solar
Issued $500 million,10-year secured MTNs at 2.375% due May 2023
Financial
Q2
winter
weather
was
significantly
colder
than
Q2
2012
but
only
slightly
colder
than
normal
Q2 summer weather was warmer than Q2 2012 and warmer than normal
A still-slow economy continues to weigh on electric demand; gas demand
improving O&M expected to moderate in second-half 2013
Regulatory and Market
Environment |
 PSEG
Energy Holdings/Enterprise 2013 Q2 Review |
 29
PSEG Energy Holdings/Enterprise –
Q2 2013 Earnings
Summary
$ millions (except EPS)
Q2 2013
Q2 2012
Variance
Operating Earnings
$ 8
$ 4
$ 4
Lease Related Activity
-
2
(2)
Income from Continuing Operations/
Net Income
$ 8
$ 6
$ 2
EPS from Operating Earnings*
$ 0.02
$ 0.01
$ 0.01
* See Page A for Items excluded from Income from Continuing Operations/Net Income
to reconcile to Operating Earnings. |
 30
PSEG Energy Holdings/Enterprise EPS Reconciliation –
Q2 2013 versus Q2 2012
0.00
0.05
Q2 2013
Operating
Earnings*
Q2 2012
Operating
Earnings*
* See Slide A for Items excluded from Income from Continuing Operations/Net Income
to reconcile to Operating Earnings. $0.02
0.01
$0.01
Asset
Sale |
 31
PSEG Energy Holdings/Enterprise –
Q2 2013 Highlights
Financial
Expanded LIPA management agreement under consideration
Edison Mission Energy agreement to defer lease decisions until
late September
Badger 1 (19 MW) solar farm scheduled to be in service this Fall
Continuing to monetize non-core assets |
 PSEG |
 33
PSEG Financial Highlights
Maintaining
2013
operating
earnings
guidance
of
$2.25
-
$2.50
per
share
Based
on
financial
results
to
date,
we
expect
operating
earnings
for
the
full
year
to
be
at
the
upper
end of our guidance range assuming normal weather and unit operations
Focused on maintaining operating efficiency and customer reliability
PSE&G’s operating earnings expected to grow at double-digit rate in
2013, and provide ~50% of consolidated operating earnings
Executing PSE&G’s existing $3.4 billion Transmission capital spending
program on schedule –
fueling double-digit growth in PSE&G operating earnings through
2015, based on approved programs
PSE&G pursuing Energy Strong, its $3.9 billion, ten-year infrastructure
spending program to strengthen electric and gas distribution, communications,
and customer reliability and resiliency. In addition, PSE&G plans to
invest $1.5 billion during this time-frame to harden its Transmission
system Financial position remains strong
Positive cash from Power and increasing cash flow from PSE&G supports dividend
growth and funds capital spending program without the need to issue
equity Debt as a percentage of capital was 41.2% at June 30, 2013
Long history of returning cash to the shareholder through the common dividend,
with opportunity for future growth |
 34
PSEG 2013 Operating Earnings Guidance -
By Subsidiary
$ millions (except EPS)
2013E
2012A
PSEG Power
$535 –
$600
$644
PSE&G
$580 –
$635
$528
PSEG Energy
Holdings/Enterprise
$25 –
$35
$64
Operating Earnings*
$1,140 –
$1,270
$1,236
Earnings per Share
$2.25 –
$2.50
$2.44
* See Slide A for Items excluded from Income from Continuing Operations/Net Income
to reconcile to Operating Earnings. E = Estimate A =
Actual |
 35
PSEG Liquidity as of June 30, 2013
Expiration
Total
Available
Company
Facility
Date
Facility
Usage
Liquidity
($Millions)
PSE&G
5-year Credit Facility
Mar-18
$600
1
$170
$430
5-Year Credit Facility (Power)
Mar-17
$1,600
$54
$1,546
5-Year Credit Facility (Power)
Mar-18
$1,000
2
$0
$1,000
5-Year Bilateral (Power)
Sep-15
$100
$100
$0
5-year Credit Facility (PSEG)
Mar-17
$500
$5
$495
5-year Credit Facility (PSEG)
Mar-18
$500
3
$0
$500
Total
$4,300
$329
$3,971
1
PSE&G Facility to be reduced by $29M on April 15, 2016
$114
2
Power Facility to be reduced by $48M on April 15, 2016
*PSE&G ST Investment
$0
3
PSEG Facility to be reduced by $23M on April 15, 2016
Total Liquidity Available
$4,085
Total Parent / Power Liquidity
$3,655
PSEG /
Power
*PSEG Money Pool ST Investment |
 Items
Excluded from Income from Continuing Operations/Net Income to Reconcile to
Operating Earnings Please see Page 2 for an explanation of PSEG’s use of
Operating Earnings as a non-GAAP financial measure and how it differs from
Income from Continuing Operations/Net Income. A
2013
2012
2013
2012
2012
2011
Earnings
Impact
($
Millions)
Gain (Loss) on Nuclear Decommissioning Trust (NDT)
Fund Related Activity (PSEG Power)
8
$
4
$
17
$
9
$
52
$
50
$
80
(10)
(25)
42
(10)
107
Lease Related Activity (PSEG Energy Holdings)
-
2
-
6
36
(173)
Storm O&M, net of insurance recoveries (PSEG Power)
2
-
(15)
-
(39)
-
Gain on Sale of Qwest Building (PSEG Energy Holdings)
-
-
-
-
-
34
Total Pro-forma adjustments
90
$
(4)
$
(23)
$
57
$
39
$
18
$
Fully Diluted Average Shares Outstanding (in Millions)
507
507
507
507
507
507
Per
Share
Impact
(Diluted)
Gain (Loss) on NDT Fund Related Activity (PSEG Power)
0.02
$
0.01
$
0.04
$
0.02
$
0.10
$
0.10
$
Gain
(Loss)
on
MTM
(a)
(PSEG Power)
0.16
(0.02)
(0.05)
0.08
(0.02)
0.21
Lease Related Activity (PSEG Energy Holdings)
-
-
-
0.01
0.07
(0.34)
Storm O&M, net of insurance recoveries (PSEG Power)
-
-
(0.03)
-
(0.08)
-
Gain on Sale of Qwest Building (PSEG Energy Holdings)
-
-
-
-
-
0.06
Total Pro-forma adjustments
0.18
$
(0.01)
$
(0.04)
$
0.11
$
0.07
$
0.03
$
(a) Includes the financial impact from positions with forward delivery
months. Three Months Ended
Six Months Ended
Year Ended
June 30,
June 30,
December 31,
PUBLIC SERVICE ENTERPRISE GROUP INCORPORATED
Reconciling Items Excluded from Income from Continuing Operations/Net Income to
Compute Operating Earnings (Unaudited)
Pro-forma Adjustments, net of tax
Gain
(Loss)
on
Mark-to-Market
(MTM)
(a)
(PSEG
Power) |