Attached files
| file | filename |
|---|---|
| 8-K - FORM 8-K - PUBLIC SERVICE ENTERPRISE GROUP INC | d574462d8k.htm |
| EX-99.1 - EX-99.1 - PUBLIC SERVICE ENTERPRISE GROUP INC | d574462dex991.htm |
EXHIBIT 99

PSEG ANNOUNCES 2013 SECOND QUARTER RESULTS
Earnings from Continuing Operations of $0.66 Per Share; Operating Earnings of $0.48 Per Share
Results Reflect Increased Investment at PSE&G; Continued Solid Performance from PSEG Power
Operating Earnings Expected to be at Upper End of Full Year Guidance of $2.25 - $2.50 Per Share
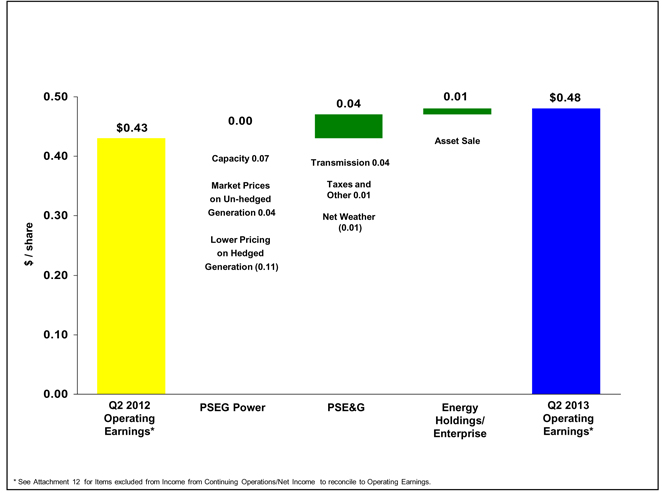
July 30, 2013 (Newark, NJ) (NYSE- PEG) Public Service Enterprise Group (PSEG) reported today Second Quarter 2013 Net Income and Income from Continuing Operations of $333 million or $0.66 per share as compared to Net Income and Income from Continuing Operations of $211 million or $0.42 per share reported for the Second Quarter of 2012. Operating Earnings for the Second Quarter of 2013 were $243 million or $0.48 per share compared to the Second Quarter of 2012 Operating Earnings of $215 million or $0.43 per share.
“Our earnings reflect strong performance for all our businesses” said Ralph Izzo, chairman, president and chief executive officer. He went on to say “our results continue to benefit from employees’ execution of our strategic goals as well as the locational value enjoyed by our merchant generating fleet of assets. PSEG again demonstrated the ability to perform against a background of slow growth in electric demand and low prices. Based on our performance thus far in the year, and assuming normal weather and operations in the remainder of the year, we expect operating earnings for the full year to be at the upper end of our guidance of $2.25 - $2.50 per share.”
PSEG believes that the non-GAAP financial measure of “Operating Earnings” provides a consistent and comparable measure of performance of its businesses to help shareholders understand performance trends. Operating Earnings exclude the impact of returns/(losses) associated with Nuclear Decommissioning Trust (NDT), Mark-to-Market (MTM) accounting and other material one time items. The table below provides a reconciliation of PSEG’s Net Income to Operating Earnings for the second quarter. See Attachment 12 for a complete list of items excluded from Income from Continuing Operations/Net Income in the determination of Operating Earnings.
PSEG CONSOLIDATED EARNINGS (unaudited)
Second Quarter Comparative Results
2013 and 2012
| Income | Diluted Earnings | |||||||||||||||
| ($millions) | Per Share | |||||||||||||||
| 2013 | 2012 | 2013 | 2012 | |||||||||||||
| Operating Earnings |
$ | 243 | $ | 215 | $ | 0.48 | $ | 0.43 | ||||||||
| Reconciling Items |
90 | (4 | ) | 0.18 | (0.01 | ) | ||||||||||
|
|
|
|
|
|
|
|
|
|||||||||
| Income from Continuing Operations* |
$ | 333 | $ | 211 | $ | 0.66 | $ | 0.42 | ||||||||
|
|
|
|
|
|
|
|
|
|||||||||
| Avg. Shares | 507M | 507M | ||||||||||||||
| * | Income from continuing operations is equal to net income in both years. |
Ralph Izzo went on to say “we remain on track to meet our capital investment and operations-related goals. PSE&G’s $3.4 billion transmission construction program remains on schedule. Post-Superstorm Sandy Power has restored operations sufficiently at its peaking units in time to support summer demand, and Holdings continues to monetize non-essential assets in its portfolio. We also remain focused on building support for PSE&G’s $3.9 billion “Energy Strong” proposal, meeting our commitment to operate the Long Island Power Authority’s transmission and distribution system at the start of 2014, and controlling our cost structure. These actions will strengthen our infrastructure and improve system reliability.”
Operating Earnings guidance by company for the full year (which is unchanged from prior disclosure) is as follows:
Operating Earnings
($ millions, except EPS)
| 2013E | 2012A | |||||||
| PSEG Power |
$ | 535 - $600 | $ | 644 | ||||
| PSE&G |
$ | 580 - $635 | $ | 528 | ||||
| PSEG Energy Holdings/Parent |
$ | 25 - $35 | $ | 64 | ||||
|
|
|
|
|
|||||
| Total |
$ | 1,140 - $1,270 | $ | 1,236 | ||||
|
|
|
|
|
|||||
| Earnings Per Share |
$ | 2.25 - $2.50 | $ | 2.44 | ||||
|
|
|
|
|
|||||
Operating Earnings Review and Outlook by Operating Subsidiary
See Attachment 6 for detail regarding the quarter-over-quarter reconciliations for each of PSEG’s businesses.
PSEG Power
PSEG Power reported operating earnings of $114 million ($0.22 per share) for the second quarter of 2013 compared with operating earnings of $110 million ($0.22 per share) for the second quarter of 2012.
Power’s second quarter earnings benefited from higher PJM capacity prices and an improvement in market prices for energy with an increase in the price of gas.
Higher prices for natural gas and an improvement in basis in the PS zone had a favorable influence on spot market prices for energy. The improvement in pricing on Power’s un-hedged generation added $0.04 per share to earnings quarter-over-quarter. An increase in capacity prices improved Power’s quarter-over-quarter earnings by $0.07 per share. These items together offset a reduction in average prices on Power’s hedged volumes.
PSEG Power’s operation & maintenance (O&M) expense (exclusive of storm-related restoration activity) was unchanged from year-ago levels. An increase in O&M at fossil associated with planned outage related work was offset by a reduction in outage related O&M at nuclear. An increase in depreciation expense related to the installation of new peaking capacity and low pressure turbines at Peach Bottom was offset by a decline in interest expense.
Power expensed approximately $22 million pre-tax on storm related activity in the second quarter, bringing Power’s total pre-tax storm expenditures to $135 million. Of this amount, Power received an additional $25 million in insurance proceeds during the second quarter for a total of $44 million in insurance proceeds to return its facilities to service.
Power’s output was unchanged in the quarter from year-ago levels. The nuclear fleet operated at an average capacity factor in the quarter of 87.9% versus 87.2% last year bringing the capacity factor for the first half of the year to 94.4%. The fleet’s performance in the quarter was influenced by a refueling outage and main generator repair work at Salem 1 (57% owned and operated by PSEG Power) versus a refueling outage in the second quarter of 2012 at PSEG Power’s 100%-owned and operated Hope Creek unit. Output from our baseload nuclear and Pennsylvania coal units in the quarter offset a decline in production at Power’s NJ-based coal units.
Power continues to forecast output for 2013 of 53 – 55 TWh. For the remainder of the year output of 26 – 28 TWh is 70% - 75% hedged at an average price of $51 per MWh. For 2014, forecast output of 53 – 55 TWh is approximately 55% - 60% hedged at an average price of $49 per MWh. Power has hedged 30% - 35% of its forecast generation in 2015 of 52 – 54 TWh at an average price of $49 per MWh. The increase in the percentage of generation hedged for 2014 – 2015 reflects only an increase in the level of hedges on base load generation. Power’s intermediate and peaking generation remains open. Average hedge prices continue to reflect assumed BGS volumes of 12 TWh in 2013 and 10 TWh in 2014.
The forecast range of Power’s operating earnings for 2013 remains unchanged at $535 - $600 million. However, based on Power’s performance year-to-date, results for the full year are expected to be at the upper end of the range.
PSE&G
PSE&G reported operating earnings of $121 million ($0.24 per share) for the second quarter of 2013 compared with operating earnings of $101 million ($0.20 per share) for the second quarter of 2012.
PSE&G’s second quarter results reflect the contribution to earnings from the increased level of transmission investment. An increase in PSE&G’s transmission revenue, effective on January 1, 2013, supported a quarter-over-quarter increase in the net earnings contribution from transmission of $0.04 per share.
Weather conditions for electric and gas demand were favorable relative to normal and in comparison to the weather experienced in the year-ago quarter. Sales of gas increased 17% quarter-over-quarter, however, continued weakness in electric demand from the commercial and industrial sectors resulted in a 2.5% decline in the sale of electricity. After several years of declining prices, gas customers appear to have adjusted their consumption to reflect an expectation of low commodity prices. Electric demand, however, continues to be affected by customer conservation in the face of a slowly improving economy.
The net impact on earnings from weather and the change in sales was a reduction in quarter-over-quarter earnings of $0.01 per share. The earnings comparison reflects the absence of revenue accrued under the gas weather normalization clause, which amounted to $0.02 per share to earnings in the year-ago quarter offsetting lower sales in the year-ago quarter.
The implementation of cost controls in response to lower than expected demand resulted in no change in distribution related O&M expense quarter-over-quarter. For the remainder of the year, distribution related O&M is expected to be lower than the levels realized in the prior year given expectations for a decline in storm related restoration activity. An increase in depreciation expense was offset by lower interest expense and other minor items.
The forecast of PSE&G’s operating earnings for 2013 remains unchanged at $580 - $635 million. Results will be influenced by a full year increase in transmission revenue and the absence of the negative impact on sales and O&M expense in the fourth quarter of 2012 from Superstorm Sandy.
PSEG Energy Holdings/Enterprise
PSEG Energy Holdings/Enterprise reported operating earnings of $8 million ($0.02 per share) for the second quarter of 2013 versus operating earnings of $4 million ($0.01 per share) during the second quarter of 2012. The improvement in operating earnings for the quarter reflects a gain on the sale of a commercial office complex.
The forecast of PSEG Energy Holdings/Parent full year operating earnings for 2013 is unchanged at $25 - $35 million. The results will reflect the full year operation of the Milford and Queen Creek solar facilities (40 MW), which entered service in the fourth quarter of 2012, as well as the commercial operation of a $50 million (19 MW) solar facility located in Arizona, which is expected to enter service in the fourth quarter.
Other Items
The NJ Board of Public Utilities (BPU) on May 29 approved a settlement authorizing an increase in spending on renewables through the Solar 4 All Extension ($247 million) and Solar Loan III ($199 million) investment programs.
######
FORWARD-LOOKING STATEMENT
Certain of the matters discussed in this report constitute “forward-looking statements” within the meaning of the Private Securities Litigation Reform Act of 1995. Such forward-looking statements are subject to risks and uncertainties, which could cause actual results to differ materially from those anticipated. Such statements are based on management’s beliefs as well as assumptions made by and information currently available to management. When used herein, the words “anticipate,” “intend,” “estimate,” “believe,” “expect,” “plan,” “should,” “hypothetical,” “potential,” “forecast,” “project,” variations of such words and similar expressions are intended to identify forward-looking statements. Factors that may cause actual results to differ are often presented with the forward-looking statements themselves. Other factors that could cause actual results to differ materially from those contemplated in any forward-looking statements made by us herein are discussed in Item 1. Financial Statements—Note 9. Commitments and Contingent Liabilities, Item 2. Management’s Discussion and Analysis of Financial Condition and Results of Operations, and other factors discussed in filings we make with the United States Securities and Exchange Commission (SEC). These factors include, but are not limited to:
| • | adverse changes in the demand for or the price of the capacity and energy that we sell into wholesale electricity markets, |
| • | adverse changes in energy industry law, policies and regulation, including market structures and a potential shift away from competitive markets toward subsidized market mechanisms, transmission planning and cost allocation rules, including rules regarding how transmission is planned and who is permitted to build transmission in the future, and reliability standards, |
| • | any inability of our transmission and distribution businesses to obtain adequate and timely rate relief and regulatory approvals from federal and state regulators, |
| • | changes in federal and state environmental regulations that could increase our costs or limit our operations, |
| • | changes in nuclear regulation and/or general developments in the nuclear power industry, including various impacts from any accidents or incidents experienced at our facilities or by others in the industry, that could limit operations of our nuclear generating units, |
| • | actions or activities at one of our nuclear units located on a multi-unit site that might adversely affect our ability to continue to operate that unit or other units located at the same site, |
| • | any inability to balance our energy obligations, available supply and risks, |
| • | any deterioration in our credit quality or the credit quality of our counterparties, including in our leveraged leases, |
| • | availability of capital and credit at commercially reasonable terms and conditions and our ability to meet cash needs, |
| • | changes in the cost of, or interruption in the supply of, fuel and other commodities necessary to the operation of our generating units, |
| • | delays in receipt of necessary permits and approvals for our construction and development activities, |
| • | delays or unforeseen cost escalations in our construction and development activities, |
| • | any inability to achieve, or continue to sustain, our expected levels of operating performance, |
| • | any equipment failures, accidents, severe weather events or other incidents that impact our ability to provide safe and reliable service to our customers, and any inability to sufficiently obtain coverage or recover proceeds of insurance on such matters, |
| • | increases in competition in energy supply markets as well as competition for certain rate-based transmission projects, |
| • | any inability to realize anticipated tax benefits or retain tax credits, |
| • | challenges associated with recruitment and/or retention of a qualified workforce, |
| • | adverse performance of our decommissioning and defined benefit plan trust fund investments and changes in funding requirements, and |
| • | changes in technology and customer usage patterns. |
All of the forward-looking statements made in this report are qualified by these cautionary statements and we cannot assure you that the results or developments anticipated by management will be realized or even if realized, will have the expected consequences to, or effects on, us or our business prospects, financial condition or results of operations. Readers are cautioned not to place undue reliance on these forward-looking statements in making any investment decision. Forward-looking statements made in this report apply only as of the date of this report. While we may elect to update forward-looking statements from time to time, we specifically disclaim any obligation to do so, even if internal estimates change, unless otherwise required by applicable securities laws. The forward-looking statements contained in this report are intended to qualify for the safe harbor provisions of Section 27A of the Securities Act of 1933, as amended, and Section 21E of the Securities Exchange Act of 1934, as amended.
Attachment 1
PUBLIC SERVICE ENTERPRISE GROUP INCORPORATED
Operating Earnings and Per Share Results by Subsidiary
(Unaudited)
| Three Months Ended June 30, |
Six Months Ended June 30, |
|||||||||||||||
| 2013 | 2012 | 2013 | 2012 | |||||||||||||
| Earnings Results ($ Millions) | ||||||||||||||||
| PSEG Power |
$ | 114 | $ | 110 | $ | 364 | $ | 306 | ||||||||
| PSE&G |
121 | 101 | 300 | 298 | ||||||||||||
| PSEG Energy Holdings/Enterprise |
8 | 4 | 12 | 43 | ||||||||||||
|
|
|
|
|
|
|
|
|
|||||||||
| Operating Earnings |
$ | 243 | $ | 215 | $ | 676 | $ | 647 | ||||||||
|
|
|
|
|
|
|
|
|
|||||||||
| Reconciling Items(a) |
90 | (4 | ) | (23 | ) | 57 | ||||||||||
|
|
|
|
|
|
|
|
|
|||||||||
| Income from Continuing Operations/Net Income |
$ | 333 | $ | 211 | $ | 653 | $ | 704 | ||||||||
|
|
|
|
|
|
|
|
|
|||||||||
| Fully Diluted Average Shares Outstanding (in Millions) |
507 | 507 | 507 | 507 | ||||||||||||
|
|
|
|
|
|
|
|
|
|||||||||
| Per Share Results (Diluted) | ||||||||||||||||
| PSEG Power |
$ | 0.22 | $ | 0.22 | $ | 0.71 | $ | 0.60 | ||||||||
| PSE&G |
0.24 | 0.20 | 0.59 | 0.59 | ||||||||||||
| PSEG Energy Holdings/Enterprise |
0.02 | 0.01 | 0.03 | 0.09 | ||||||||||||
|
|
|
|
|
|
|
|
|
|||||||||
| Operating Earnings |
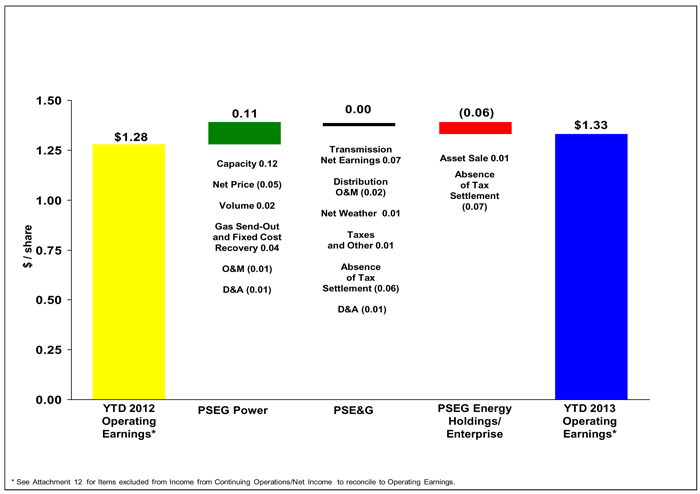
$ | 0.48 | $ | 0.43 | $ | 1.33 | $ | 1.28 | ||||||||
|
|
|
|
|
|
|
|
|
|||||||||
| Reconciling Items(a) |
0.18 | (0.01 | ) | (0.04 | ) | 0.11 | ||||||||||
|
|
|
|
|
|
|
|
|
|||||||||
| Income from Continuing Operations/Net Income |
$ | 0.66 | $ | 0.42 | $ | 1.29 | $ | 1.39 | ||||||||
|
|
|
|
|
|
|
|
|
|||||||||
| (a) | See attachment 12 for details of items excluded from Income from Continuing Operations/Net Income to compute Operating Earnings. |
Attachment 2
PUBLIC SERVICE ENTERPRISE GROUP INCORPORATED
Consolidating Statements of Operations
(Unaudited, $ Millions)
| Three Months Ended June 30, 2013 | ||||||||||||||||
| PSEG | PSEG Energy Holdings/ Enterprise (a) |
PSEG POWER |
PSE&G | |||||||||||||
| OPERATING REVENUES |
$ | 2,310 | $ | (303 | ) | $ | 1,190 | $ | 1,423 | |||||||
| OPERATING EXPENSES |
||||||||||||||||
| Energy Costs |
755 | (321 | ) | 496 | 580 | |||||||||||
| Operation and Maintenance |
646 | (3 | ) | 280 | 369 | |||||||||||
| Depreciation and Amortization |
283 | 11 | 65 | 207 | ||||||||||||
| Taxes Other Than Income Taxes |
14 | — | — | 14 | ||||||||||||
|
|
|
|
|
|
|
|
|
|||||||||
| Total Operating Expenses |
1,698 | (313 | ) | 841 | 1,170 | |||||||||||
|
|
|
|
|
|
|
|
|
|||||||||
| OPERATING INCOME |
612 | 10 | 349 | 253 | ||||||||||||
| Income from Equity Method Investments |
3 | 3 | — | — | ||||||||||||
| Other Income and (Deductions) |
39 | — | 25 | 14 | ||||||||||||
| Other-Than-Temporary Impairments |
(2 | ) | — | (2 | ) | — | ||||||||||
| Interest Expense |
(101 | ) | 3 | (29 | ) | (75 | ) | |||||||||
|
|
|
|
|
|
|
|
|
|||||||||
| INCOME FROM CONTINUING OPERATIONS BEFORE INCOME TAXES |
551 | 16 | 343 | 192 | ||||||||||||
| Income Tax Benefit (Expense) |
(218 | ) | (8 | ) | (139 | ) | (71 | ) | ||||||||
|
|
|
|
|
|
|
|
|
|||||||||
| INCOME FROM CONTINUING OPERATIONS/NET INCOME |
$ | 333 | $ | 8 | $ | 204 | $ | 121 | ||||||||
|
|
|
|
|
|
|
|
|
|||||||||
|
|
|
|||||||||||||||
| OPERATING EARNINGS |
$ | 243 | $ | 8 | $ | 114 | $ | 121 | ||||||||
| Reconciling Items Excluded from Continuing Operations/Net Income (b) |
90 | — | 90 | — | ||||||||||||
|
|
|
|
|
|
|
|
|
|||||||||
| INCOME FROM CONTINUING OPERATIONS/NET INCOME |
$ | 333 | $ | 8 | $ | 204 | $ | 121 | ||||||||
|
|
|
|
|
|
|
|
|
|||||||||
| Three Months Ended June 30, 2012 | ||||||||||||||||
| PSEG | PSEG Energy Holdings/ Enterprise (a) |
PSEG POWER |
PSE&G | |||||||||||||
| OPERATING REVENUES |
$ | 2,098 | $ | (294 | ) | $ | 985 | $ | 1,407 | |||||||
| OPERATING EXPENSES |
||||||||||||||||
| Energy Costs |
761 | (308 | ) | 447 | 622 | |||||||||||
| Operation and Maintenance |
629 | (5 | ) | 284 | 350 | |||||||||||
| Depreciation and Amortization |
255 | 9 | 58 | 188 | ||||||||||||
| Taxes Other Than Income Taxes |
20 | — | — | 20 | ||||||||||||
|
|
|
|
|
|
|
|
|
|||||||||
| Total Operating Expenses |
1,665 | (304 | ) | 789 | 1,180 | |||||||||||
|
|
|
|
|
|
|
|
|
|||||||||
| OPERATING INCOME |
433 | 10 | 196 | 227 | ||||||||||||
| Income from Equity Method Investments |
2 | 2 | — | — | ||||||||||||
| Other Income and (Deductions) |
32 | 1 | 20 | 11 | ||||||||||||
| Other-Than-Temporary Impairments |
(7 | ) | — | (7 | ) | — | ||||||||||
| Interest Expense |
(103 | ) | 3 | (32 | ) | (74 | ) | |||||||||
|
|
|
|
|
|
|
|
|
|||||||||
| INCOME FROM CONTINUING OPERATIONS BEFORE INCOME TAXES |
357 | 16 | 177 | 164 | ||||||||||||
| Income Tax Benefit (Expense) |
(146 | ) | (10 | ) | (73 | ) | (63 | ) | ||||||||
|
|
|
|
|
|
|
|
|
|||||||||
| INCOME FROM CONTINUING OPERATIONS/NET INCOME |
$ | 211 | $ | 6 | $ | 104 | $ | 101 | ||||||||
|
|
|
|
|
|
|
|
|
|||||||||
|
|
|
|||||||||||||||
| OPERATING EARNINGS |
$ | 215 | $ | 4 | $ | 110 | $ | 101 | ||||||||
| Reconciling Items Excluded from Continuing Operations/Net Income (b) |
(4 | ) | 2 | (6 | ) | — | ||||||||||
|
|
|
|
|
|
|
|
|
|||||||||
| INCOME FROM CONTINUING OPERATIONS/NET INCOME |
$ | 211 | $ | 6 | $ | 104 | $ | 101 | ||||||||
|
|
|
|
|
|
|
|
|
|||||||||
| (a) | Includes activities at Energy Holdings and the Parent as well as intercompany eliminations. |
| (b) | See attachment 12 for details of items excluded from Income from Continuing Operations/Net Income to compute Operating Earnings. |
Attachment 3
PUBLIC SERVICE ENTERPRISE GROUP INCORPORATED
Consolidating Statements of Operations
(Unaudited, $ Millions)
| Six Months Ended June 30, 2013 | ||||||||||||||||
| PSEG | PSEG Energy Holdings/ Enterprise (a) |
PSEG POWER |
PSE&G | |||||||||||||
| OPERATING REVENUES |
$ | 5,096 | $ | (959 | ) | $ | 2,637 | $ | 3,418 | |||||||
| OPERATING EXPENSES |
||||||||||||||||
| Energy Costs |
1,910 | (993 | ) | 1,356 | 1,547 | |||||||||||
| Operation and Maintenance |
1,356 | (2 | ) | 562 | 796 | |||||||||||
| Depreciation and Amortization |
573 | 22 | 129 | 422 | ||||||||||||
| Taxes Other Than Income Taxes |
35 | — | — | 35 | ||||||||||||
|
|
|
|
|
|
|
|
|
|||||||||
| Total Operating Expenses |
3,874 | (973 | ) | 2,047 | 2,800 | |||||||||||
|
|
|
|
|
|
|
|
|
|||||||||
| OPERATING INCOME |
1,222 | 14 | 590 | 618 | ||||||||||||
| Income from Equity Method Investments |
5 | 5 | — | — | ||||||||||||
| Other Income and (Deductions) |
71 | 1 | 44 | 26 | ||||||||||||
| Other-Than-Temporary Impairments |
(4 | ) | — | (4 | ) | — | ||||||||||
| Interest Expense |
(203 | ) | 4 | (59 | ) | (148 | ) | |||||||||
|
|
|
|
|
|
|
|
|
|||||||||
| INCOME FROM CONTINUING OPERATIONS BEFORE INCOME TAXES |
1,091 | 24 | 571 | 496 | ||||||||||||
| Income Tax Benefit (Expense) |
(438 | ) | (12 | ) | (230 | ) | (196 | ) | ||||||||
|
|
|
|
|
|
|
|
|
|||||||||
| INCOME FROM CONTINUING OPERATIONS/NET INCOME |
$ | 653 | $ | 12 | $ | 341 | $ | 300 | ||||||||
|
|
|
|
|
|
|
|
|
|||||||||
|
|
|
|||||||||||||||
| OPERATING EARNINGS |
$ | 676 | $ | 12 | $ | 364 | $ | 300 | ||||||||
| Reconciling Items Excluded from Continuing Operations/Net Income (b) |
(23 | ) | — | (23 | ) | — | ||||||||||
|
|
|
|
|
|
|
|
|
|||||||||
| INCOME FROM CONTINUING OPERATIONS/NET INCOME |
$ | 653 | $ | 12 | $ | 341 | $ | 300 | ||||||||
|
|
|
|
|
|
|
|
|
|||||||||
| Six Months Ended June 30, 2012 | ||||||||||||||||
| PSEG | PSEG Energy Holdings/ Enterprise (a) |
PSEG POWER |
PSE&G | |||||||||||||
| OPERATING REVENUES |
$ | 4,973 | $ | (919 | ) | $ | 2,546 | $ | 3,346 | |||||||
| OPERATING EXPENSES |
||||||||||||||||
| Energy Costs |
1,940 | (953 | ) | 1,269 | 1,624 | |||||||||||
| Operation and Maintenance |
1,257 | 6 | 525 | 726 | ||||||||||||
| Depreciation and Amortization |
511 | 18 | 115 | 378 | ||||||||||||
| Taxes Other Than Income Taxes |
49 | — | — | 49 | ||||||||||||
|
|
|
|
|
|
|
|
|
|||||||||
| Total Operating Expenses |
3,757 | (929 | ) | 1,909 | 2,777 | |||||||||||
|
|
|
|
|
|
|
|
|
|||||||||
| OPERATING INCOME |
1,216 | 10 | 637 | 569 | ||||||||||||
| Income from Equity Method Investments |
2 | 2 | — | — | ||||||||||||
| Other Income and (Deductions) |
60 | 4 | 35 | 21 | ||||||||||||
| Other-Than-Temporary Impairments |
(12 | ) | — | (12 | ) | — | ||||||||||
| Interest Expense |
(204 | ) | 5 | (62 | ) | (147 | ) | |||||||||
|
|
|
|
|
|
|
|
|
|||||||||
| INCOME FROM CONTINUING OPERATIONS BEFORE INCOME TAXES |
1,062 | 21 | 598 | 443 | ||||||||||||
| Income Tax Benefit (Expense) |
(358 | ) | 28 | (241 | ) | (145 | ) | |||||||||
|
|
|
|
|
|
|
|
|
|||||||||
| INCOME FROM CONTINUING OPERATIONS/NET INCOME |
$ | 704 | $ | 49 | $ | 357 | $ | 298 | ||||||||
|
|
|
|
|
|
|
|
|
|||||||||
|
|
|
|||||||||||||||
| OPERATING EARNINGS |
$ | 647 | $ | 43 | $ | 306 | $ | 298 | ||||||||
| Reconciling Items Excluded from Continuing Operations/Net Income (b) |
57 | 6 | 51 | — | ||||||||||||
|
|
|
|
|
|
|
|
|
|||||||||
| INCOME FROM CONTINUING OPERATIONS/NET INCOME |
$ | 704 | $ | 49 | $ | 357 | $ | 298 | ||||||||
|
|
|
|
|
|
|
|
|
|||||||||
| (a) | Includes activities at Energy Holdings and the Parent as well as intercompany eliminations. |
| (b) | See attachment 12 for details of items excluded from Income from Continuing Operations/Net Income to compute Operating Earnings. |
Attachment 4
PUBLIC SERVICE ENTERPRISE GROUP INCORPORATED
Capitalization Schedule
(Unaudited, $ Millions)
| June 30, 2013 |
December 31, 2012 |
|||||||
| DEBT |
||||||||
| Long-Term Debt |
$ | 7,608 | $ | 7,173 | ||||
| Securitization Debt |
617 | 722 | ||||||
| Project Level, Non-Recourse Debt |
25 | 44 | ||||||
|
|
|
|
|
|||||
| Total Debt |
8,250 | 7,939 | ||||||
| STOCKHOLDERS’ EQUITY |
||||||||
| Common Stock |
4,842 | 4,833 | ||||||
| Treasury Stock |
(615 | ) | (607 | ) | ||||
| Retained Earnings |
7,231 | 6,942 | ||||||
| Accumulated Other Comprehensive Loss |
(362 | ) | (388 | ) | ||||
|
|
|
|
|
|||||
| Total Common Stockholders’ Equity |
11,096 | 10,780 | ||||||
| Noncontrolling Interests - Equity Investments |
1 | 1 | ||||||
|
|
|
|
|
|||||
| Total Equity |
11,097 | 10,781 | ||||||
|
|
|
|
|
|||||
| Total Capitalization |
$ | 19,347 | $ | 18,720 | ||||
|
|
|
|
|
|||||
Attachment 5
PUBLIC SERVICE ENTERPRISE GROUP INCORPORATED
CONDENSED CONSOLIDATED STATEMENTS OF CASH FLOWS
(Unaudited, $ Millions)
| Six Months Ended June 30, | ||||||||
| 2013 | 2012 | |||||||
| CASH FLOWS FROM OPERATING ACTIVITIES |
||||||||
| Net Income |
$ | 653 | $ | 704 | ||||
| Adjustments to Reconcile Net Income to Net Cash Flows From Operating Activities |
690 | 674 | ||||||
|
|
|
|
|
|||||
| NET CASH PROVIDED BY OPERATING ACTIVITIES |
1,343 | 1,378 | ||||||
|
|
|
|
|
|||||
| NET CASH USED IN INVESTING ACTIVITIES |
(1,379 | ) | (1,339 | ) | ||||
|
|
|
|
|
|||||
| NET CASH USED IN FINANCING ACTIVITIES |
(179 | ) | (108 | ) | ||||
|
|
|
|
|
|||||
| Net Change in Cash and Cash Equivalents |
(215 | ) | (69 | ) | ||||
| Cash and Cash Equivalents at Beginning of Period |
379 | 834 | ||||||
|
|
|
|
|
|||||
| Cash and Cash Equivalents at End of Period |
$ | 164 | $ | 765 | ||||
|
|
|
|
|
|||||
Attachment 6
PUBLIC SERVICE ENTERPRISE GROUP INCORPORATED
Quarter-over-Quarter EPS Reconciliation
June 30, 2013 vs. June 30, 2012
(Unaudited)
Attachment 7
PUBLIC SERVICE ENTERPRISE GROUP INCORPORATED
Year-over-Year EPS Reconciliation
June 30, 2013 vs. June 30, 2012
(Unaudited)
Attachment 8
PSEG POWER LLC
Generation Measures
(Unaudited)
| GWhr Breakdown | GWhr Breakdown | |||||||||||||||||
|
Three Months Ended |
Six Months Ended |
|||||||||||||||||
| June 30, | June 30, | |||||||||||||||||
| 2013 | 2012 | 2013 | 2012 | |||||||||||||||
| Nuclear - NJ |
4,638 | 4,599 | 10,227 | 10,035 | ||||||||||||||
| Nuclear - PA |
2,509 | 2,476 | 5,057 | 5,010 | ||||||||||||||
|
|
|
|
|
|
|
|
|
|||||||||||
| Total Nuclear |
7,147 | 7,075 | 15,284 | 15,045 | ||||||||||||||
| Fossil - Coal/Natural Gas - NJ* |
187 | 363 | 666 | 407 | ||||||||||||||
| Fossil - Coal - PA |
1,175 | 1,069 | 2,593 | 2,133 | ||||||||||||||
| Fossil - Coal - CT |
22 | 22 | 331 | 45 | ||||||||||||||
|
|
|
|
|
|
|
|
|
|||||||||||
| Total Coal |
1,384 | 1,454 | 3,590 | 2,585 | ||||||||||||||
| Fossil - Oil & Natural Gas - NJ |
3,000 | 2,997 | 5,889 | 5,837 | ||||||||||||||
| Fossil - Oil & Natural Gas - NY |
1,190 | 1,164 | 2,068 | 2,375 | ||||||||||||||
| Fossil - Oil & Natural Gas - CT |
(3 | ) | 16 | 44 | 7 | |||||||||||||
|
|
|
|
|
|
|
|
|
|||||||||||
| Total Oil & Natural Gas |
4,187 | 4,177 | 8,001 | 8,219 | ||||||||||||||
| 12,718 | 12,706 | 26,875 | 25,849 | |||||||||||||||
| % Generation by Fuel Type | % Generation by Fuel Type | |||||||||||||||||
|
Three Months Ended |
Six Months Ended |
|||||||||||||||||
| June 30, | June 30, | |||||||||||||||||
| 2013 | 2012 | 2013 | 2012 | |||||||||||||||
| Nuclear - NJ |
36 | % | 36 | % | 38 | % | 39 | % | ||||||||||
| Nuclear - PA |
20 | % | 20 | % | 19 | % | 19 | % | ||||||||||
|
|
|
|
|
|
|
|
|
|||||||||||
| Total Nuclear |
56 | % | 56 | % | 57 | % | 58 | % | ||||||||||
| Fossil - Coal/Natural Gas - NJ* |
1 | % | 3 | % | 2 | % | 2 | % | ||||||||||
| Fossil - Coal - PA |
10 | % | 8 | % | 10 | % | 8 | % | ||||||||||
| Fossil - Coal - CT |
0 | % | 0 | % | 1 | % | 0 | % | ||||||||||
|
|
|
|
|
|
|
|
|
|||||||||||
| Total Coal |
11 | % | 11 | % | 13 | % | 10 | % | ||||||||||
| Fossil - Oil & Natural Gas - NJ |
24 | % | 24 | % | 22 | % | 23 | % | ||||||||||
| Fossil - Oil & Natural Gas - NY |
9 | % | 9 | % | 8 | % | 9 | % | ||||||||||
| Fossil - Oil & Natural Gas - CT |
0 | % | 0 | % | 0 | % | 0 | % | ||||||||||
|
|
|
|
|
|
|
|
|
|||||||||||
| Total Oil & Natural Gas |
33 | % | 33 | % | 30 | % | 32 | % | ||||||||||
| 100 | % | 100 | % | 100 | % | 100 | % | |||||||||||
| * | Includes Pumped Storage. Pumped Storage accounted for <1% of total generation for the three and six months ended June 30, 2013 and 2012. Also includes natural gas fuel switching intervals. |
Attachment 9
PUBLIC SERVICE ELECTRIC & GAS COMPANY
Retail Sales and Revenues
(Unaudited)
June 30, 2013
Electric Sales and Revenues
| Three Months | Change vs. | Six Months | Change vs. | |||||||||||||
| Ended | 2012 | Ended | 2012 | |||||||||||||
| Sales (millions kwh) |
||||||||||||||||
| Residential |
3,077 | 0.8 | % | 6,207 | 2.7 | % | ||||||||||
| Commercial & Industrial |
6,578 | -4.1 | % | 13,277 | -2.4 | % | ||||||||||
| Street Lighting |
67 | 0.3 | % | 158 | 0.9 | % | ||||||||||
| Interdepartmental |
2 | 38.9 | % | 5 | 16.5 | % | ||||||||||
|
|
|
|
|
|||||||||||||
| Total |
9,724 | -2.5 | % | 19,647 | -0.8 | % | ||||||||||
|
|
|
|
|
|||||||||||||
| Revenue (in millions) |
||||||||||||||||
| Residential |
$ | 479 | 0.3 | % | $ | 949 | -2.3 | % | ||||||||
| Commercial & Industrial |
510 | -3.9 | % | 946 | -1.3 | % | ||||||||||
| Street Lighting |
16 | -1.3 | % | 34 | -8.1 | % | ||||||||||
| Other Operating Revenues* |
107 | 29.0 | % | 212 | 21.8 | % | ||||||||||
|
|
|
|
|
|||||||||||||
| Total |
$ | 1,112 | 0.4 | % | $ | 2,141 | -2.8 | % | ||||||||
|
|
|
|
|
|||||||||||||
| Three Months | Change vs. | Six Months | Change vs. | |||||||||||||
| Ended | 2012 | Ended | 2012 | |||||||||||||
| Weather Data |
||||||||||||||||
| THI Hours - Actual |
4,655 | 10.1 | % | 4,656 | 8.0 | % | ||||||||||
| THI Hours - Normal |
3,940 | 3,964 | ||||||||||||||
| * | Primarily sales of Non-Utility Generator energy to PJM and Transmission-related revenues. |
Attachment 10
PUBLIC SERVICE ELECTRIC & GAS COMPANY
Retail Sales and Revenues
(Unaudited)
June 30, 2013
Gas Sold and Transported
| Three Months | Change vs. | Six Months | Change vs. | |||||||||||||
| Ended | 2012 | Ended | 2012 | |||||||||||||
| Sales (millions therms) |
||||||||||||||||
| Residential Sales |
167 | 10.8 | % | 790 | 16.5 | % | ||||||||||
| Commercial & Industrial - Firm Sales |
62 | 17.5 | % | 281 | 15.2 | % | ||||||||||
| Commercial & Industrial - Interr. & Cogen |
16 | -13.1 | % | 43 | 3.1 | % | ||||||||||
|
|
|
|
|
|||||||||||||
| Total |
245 | 10.5 | % | 1,114 | 15.6 | % | ||||||||||
|
|
|
|
|
|||||||||||||
| Gas Transported - Firm Sales |
104 | 25.5 | % | 402 | 37.1 | % | ||||||||||
| Gas Transported - Non-Firm |
282 | 5.5 | % | 488 | -10.3 | % | ||||||||||
| Revenue (in millions) |
||||||||||||||||
| Residential Sales |
$ | 84 | 0.3 | % | $ | 397 | 11.4 | % | ||||||||
| Commercial & Industrial - Firm Sales |
37 | 64.5 | % | 155 | 30.4 | % | ||||||||||
| Commercial & Industrial - Interr. & Cogen |
9 | 33.7 | % | 22 | 25.9 | % | ||||||||||
| Other Operating Revenues* |
42 | 2.9 | % | 83 | 6.8 | % | ||||||||||
|
|
|
|
|
|||||||||||||
| Total |
$ | 172 | 11.7 | % | $ | 657 | 15.2 | % | ||||||||
|
|
|
|
|
|||||||||||||
| Gas Transported |
$ | 139 | -4.3 | % | $ | 620 | 8.3 | % | ||||||||
| Three Months | Change vs. | Six Months | Change vs. | |||||||||||||
| Ended | 2012 | Ended | 2012 | |||||||||||||
| Weather Data |
||||||||||||||||
| Degree Days - Actual |
519 | 35.6 | % | 3,069 | 27.4 | % | ||||||||||
| Degree Days - Normal |
509 | 3,048 | ||||||||||||||
| * | Primarily Appliance Service. |
Attachment 11
PUBLIC SERVICE ENTERPRISE GROUP INCORPORATED
Statistical Measures
(Unaudited)
| Three Months Ended | Year Ended | |||||||||||||||
| June 30, | June 30, | |||||||||||||||
| 2013 | 2012 | 2013 | 2012 | |||||||||||||
| Weighted Average Common Shares Outstanding (000’s) |
||||||||||||||||
| Basic |
505,900 | 505,903 | 505,921 | 505,956 | ||||||||||||
| Diluted |
507,381 | 506,969 | 507,301 | 506,999 | ||||||||||||
| Stock Price at End of Period |
$ | 32.66 | $ | 32.50 | ||||||||||||
| Dividends Paid per Share of Common Stock |
$ | 0.3600 | $ | 0.3550 | $ | 0.7200 | $ | 0.7100 | ||||||||
| Dividend Payout Ratio* |
57.8 | % | 54.3 | % | ||||||||||||
| Dividend Yield |
4.4 | % | 4.4 | % | ||||||||||||
| Price/Earnings Ratio* |
13.1 | 12.6 | ||||||||||||||
| Rate of Return on Average Common Equity* |
11.7 | % | 12.6 | % | ||||||||||||
| Book Value per Common Share |
$ | 21.94 | $ | 21.04 | ||||||||||||
| Market Price as a Percent of Book Value |
149 | % | 154 | % | ||||||||||||
| Total Shareholder Return |
-3.8 | % | 7.4 | % | 9.1 | % | 0.7 | % | ||||||||
| * | Calculation based on Operating Earnings for the 12 month period ended. |
Attachment 12
PUBLIC SERVICE ENTERPRISE GROUP INCORPORATED
Reconciling Items Excluded from Income from Continuing Operations/Net Income to Compute Operating Earnings
(Unaudited)
| Pro-forma Adjustments, net of tax |
Three Months Ended | Six Months Ended | Year Ended | |||||||||||||||||
| June 30, | June 30, | December 31, | ||||||||||||||||||
| 2013 | 2012 | 2013 | 2012 | 2012 | ||||||||||||||||
| Earnings Impact ($ Millions) | ||||||||||||||||||||
| Gain (Loss) on Nuclear Decommissioning Trust (NDT) |
||||||||||||||||||||
| Fund Related Activity (PSEG Power) |
$ | 8 | $ | 4 | $ | 17 | $ | 9 | $ | 52 | ||||||||||
| Gain (Loss) on Mark-to-Market (MTM)(a) (PSEG Power) |
80 | (10 | ) | (25 | ) | 42 | (10 | ) | ||||||||||||
| Lease Related Activity (PSEG Energy Holdings) |
— | 2 | — | 6 | 36 | |||||||||||||||
| Storm O&M, net of insurance recoveries (PSEG Power) |
2 | — | (15 | ) | — | (39 | ) | |||||||||||||
|
|
|
|
|
|
|
|
|
|
|
|||||||||||
| Total Pro-forma adjustments |
$ | 90 | $ | (4 | ) | $ | (23 | ) | $ | 57 | $ | 39 | ||||||||
|
|
|
|
|
|
|
|
|
|
|
|||||||||||
| Fully Diluted Average Shares Outstanding (in Millions) |
507 | 507 | 507 | 507 | 507 | |||||||||||||||
|
|
|
|
|
|
|
|
|
|
|
|||||||||||
| Per Share Impact (Diluted) | ||||||||||||||||||||
| Gain (Loss) on NDT Fund Related Activity (PSEG Power) |
$ | 0.02 | $ | 0.01 | $ | 0.04 | $ | 0.02 | $ | 0.10 | ||||||||||
| Gain (Loss) on MTM(a) (PSEG Power) |
0.16 | (0.02 | ) | (0.05 | ) | 0.08 | (0.02 | ) | ||||||||||||
| Lease Related Activity (PSEG Energy Holdings) |
— | — | — | 0.01 | 0.07 | |||||||||||||||
| Storm O&M, net of insurance recoveries (PSEG Power) |
— | — | (0.03 | ) | — | (0.08 | ) | |||||||||||||
|
|
|
|
|
|
|
|
|
|
|
|||||||||||
| Total Pro-forma adjustments |
$ | 0.18 | $ | (0.01 | ) | $ | (0.04 | ) | $ | 0.11 | $ | 0.07 | ||||||||
|
|
|
|
|
|
|
|
|
|
|
|||||||||||
| (a) | Includes the financial impact from positions with forward delivery months. |