Attached files
| file | filename |
|---|---|
| 8-K - CURRENT REPORT - EASTERN VIRGINIA BANKSHARES INC | v351182_8k.htm |

Eastern Virginia Bankshares, Inc. Eastern Virginia Bankshares, Inc. KBW 2013 Community Bank Investor Conference July 3o, 2013
Forward - Looking Statements 2 Certain statements contained in this presentation that are not historical facts may constitute "forward - looking statements" within the meaning of Section 27 A of the Securities Act of 1933 , as amended, and Section 21 E of the Securities Exchange Act of 1934 , as amended . Examples of forward - looking statements include, but are not limited to : ( i ) projections of revenues, expenses, income or loss, earnings or loss per share, the payment or nonpayment of dividends, capital structure and other financial items ; (ii) statements of strategic initiatives, plans, objectives and expectations of the Company or its management or Board of Directors, including those relating to products or services, the performance or disposition of portions of the Company's asset portfolio, future changes to the Bank's branch network, and the payment of dividends ; (iii) statements regarding future asset quality, including expected levels of charge - offs ; and (iv) statements of assumptions underlying such statements . Words such as "believes," "anticipates," "expects," "intends," "targeted," "continue," "remain," "will," "should," "may" and other similar expressions are intended to identify forward - looking statements, but are not the exclusive means of identifying such statements . Forward - looking statements involve risks and uncertainties that may cause actual results to differ materially from those in such statements . Factors that could cause actual results to differ from those discussed in the forward - looking statements include, but are not limited to : ( i ) factors that adversely affect the Company's capital and business initiatives, including, without limitation, changes in market conditions that adversely affect the Company's ability to dispose of or work out assets adversely classified by us on advantageous terms or at all and changes in market and interest rate conditions that adversely affect the Company's ability to restructure its FHLB advances on advantageous terms ; (ii) the Company's ability and efforts to assess, manage and improve its asset quality ; (iii) the strength of the economy in the Company's target market area, as well as general economic, market, political, or business factors ; (iv) changes in the quality or composition of the Company's loan or investment portfolios, including adverse developments in borrower industries, decline in real estate values in its markets, or in the repayment ability of individual borrowers or issuers ; (v) the effects of the Company's adjustments to the composition of its investment portfolio ; (vi) the impact of government intervention in the banking business ; (vii) an insufficient allowance for loan losses ; (viii) the Company's ability to meet the capital requirements of its regulatory agencies ;

Forward - Looking Statements (Continued) 3 (ix) changes in laws, regulations and the policies of federal or state regulators and agencies ; (x) adverse reactions in financial markets related to the budget deficit of the United States government ; (xi) changes in the interest rates affecting the Company's deposits and loans ; (xii) the loss of any of the Company's key employees ; (xiii) changes in the Company's competitive position, competitive actions by other financial institutions and the competitive nature of the financial services industry and the Company's ability to compete effectively against other financial institutions in its banking markets ; (xiv) the Company's potential growth, including its entrance or expansion into new markets, the opportunities that may be presented to and pursued by it and the need for sufficient capital to support that growth ; (xv) changes in government monetary policy, interest rates, deposit flow, the cost of funds, and demand for loan products and financial services ; (xvi) the Company's ability to maintain internal control over financial reporting ; (xvii) the Company's ability to raise capital as needed by its business ; (xviii) the Company's reliance on secondary sources, such as Federal Home Loan Bank advances, sales of securities and loans, federal funds lines of credit from correspondent banks and out - of - market time deposits, to meet its liquidity needs ; (xix) the Company's ability to comply with the Written Agreement, which requires it to designate a significant amount of resources to complying with the agreement and may have a material adverse effect on the Company's operations and the value of its securities ; (xx) possible changes to the Company's Board of Directors, including in connection with the private placements and deferred dividends on the Company's Capital Purchase Program preferred stock ; and (xxi) other circumstances, many of which are beyond the Company's control . For an explanation of certain risks and uncertainties associated with forward - looking statements, please refer to the Company’s Annual Report on Form 10 - K for the year ended December 31 , 2012 , Quarterly Report on Form 10 - Q for the quarter ended March 31 , 2013 , and other SEC filings . Although the Company believes that its expectations with respect to the forward - looking statements are based upon reliable assumptions and projections within the bounds of its knowledge of its business and operations, there can be no assurance that actual results, performance, actions or achievements of the Company will not differ materially from any future results, performance, actions or achievements expressed or implied by such forward - looking statements . Readers should not place undue reliance on such statements, which speak only as of the date of this report . The Company does not undertake any steps to update any forward - looking statement that may be made from time to time by it or on its behalf .

EVBS Franchise Overview

5 Overview of Eastern Virginia Bankshares, Inc. Source: SNL Financial Financial data as of or for the quarter ended 6/30/2013; Market data as of 7/24/2013 ROAA shown pre - TARP dividend * Company demographics weighted by county deposits (1) Assumes the full conversion into common stock of the Company's 5,240,192 shares of non - voting mandatorily convertible non - cumulative Series B Preferred Stock as of June 30, 2013 (2) NPAs exclude performing TDRs Company Demographics* Projected Pop. Growth ('12-'17): 2.5% Projected HHI Growth ('12-'17): 13.2% Median HHI: $51,817 Company Overview Headquarters: Tappahannock, VA Branches: 22 Established: 1910 Financial Highlights Balance Sheet ($mm) Assets: 1,116 Loans: 671 Deposits: 842 Adjusted TCE / TA (1) (%): 8.65 Profitability (%) ROAA: 0.25 Net Interest Margin: 3.21 Efficiency Ratio: 85.6 Asset Quality (%) NPAs / Loans + OREO (2) : 1.44 NCOs / Avg Loans: 1.36 Reserves / Loans: 2.66 Trading Ticker: EVBS Exchange: NASDAQ Global Select Market Cap (1) ($mm): 97.2 Price / Adjusted TBV (1) (x): 1.02 EVBS (22)

Overview of Capital Raise 6 $45.0 million capital raise closed on June 12, 2013 − 4.6 million common shares at $4.55 per share − 5.2 million shares non - voting mandatorily convertible non - cumulative Series B preferred stock at $4.55 per share − Castle Creek Capital Partners and GCP Capital Partners were lead investors, with ownership of 32.0% and 14.1% of the Company’s total equity Each are entitled to have one representative appointed to EVBS and the bank’s boards $5.0 million rights offering to current shareholders closed on July 5, 2013 − Offering was oversubscribed − Resulted in issuance of 1.1 million common shares at $4.55 per share
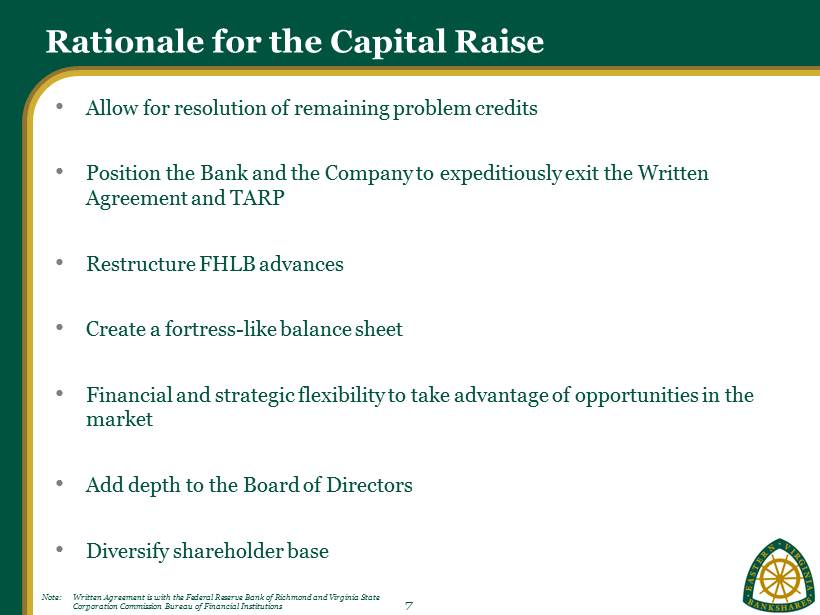
Rationale for the Capital Raise Note: Written Agreement is with the Federal Reserve Bank of Richmond and Virginia State Corporation Commission Bureau of Financial Institutions • Allow for resolution of remaining problem credits • Position the Bank and the Company to expeditiously exit the Written Agreement and TARP • Restructure FHLB advances • Create a fortress - like balance sheet • Financial and strategic flexibility to take advantage of opportunities in the market • Add depth to the Board of Directors • Diversify shareholder base 7

Company Highlights • Seasoned management team with longstanding customer relationships • Strong and stable core deposit base • Sizable entry point into greater Richmond and Eastern Virginia markets • Branch franchise uniquely positioned to expand further in the greater Richmond area and toward Newport News/Norfolk • Problem loans identified and capital need addressed • Attractive valuation 8
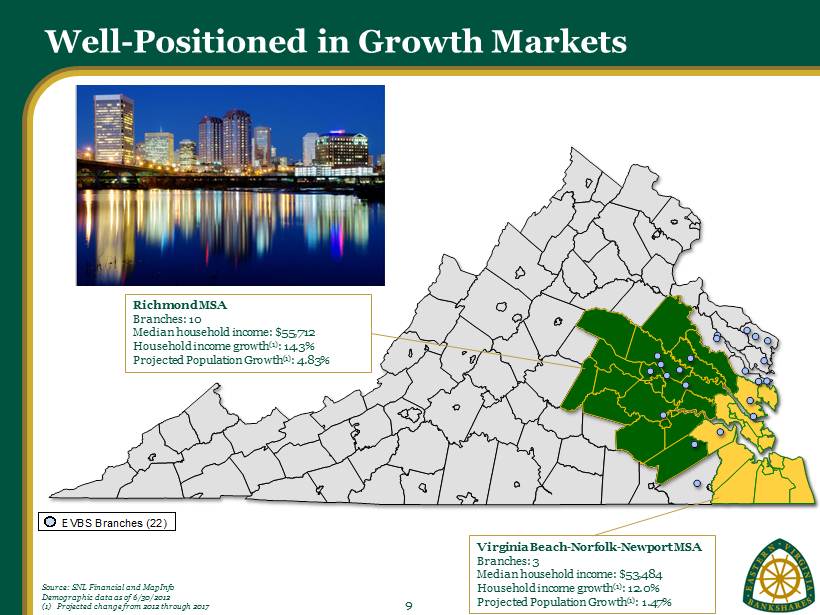
Richmond MSA Branches: 10 Median household income: $55,712 Household income growth (1) : 14.3% Projected Population Growth (1) : 4.83% Well - Positioned in Growth Markets Source: SNL Financial and MapInfo Demographic data as of 6/30/2012 (1) Projected change from 2012 through 2017 9 Virginia Beach - Norfolk - Newport MSA Branches: 3 Median household income: $53,484 Household income growth (1) : 12.0% Projected Population Growth (1) : 1.47% EVBS Branches (22)

$30,000 $38,000 $46,000 $54,000 $62,000 EVBS Franchise EVBS Non- Richmond Franchise EVBS Richmond Franchise VA National 5.0% 9.0% 13.0% 17.0% 21.0% EVBS Franchise EVBS Non- Richmond Franchise EVBS Richmond Franchise VA National 1.00% 2.00% 3.00% 4.00% 5.00% EVBS Franchise EVBS Non- Richmond Franchise EVBS Richmond Franchise VA National Richmond MSA Virginia Beach / Norfolk MSA Households 498,695 631,165 Top 3 Banks Market Share %: 68.6% 52.7% Bank of America Corp. (NC) Wells Fargo & Co. (CA) Wells Fargo & Co. (CA) SunTrust Banks Inc. (GA) SunTrust Banks Inc. (GA) TowneBank (VA) GDP ($bn): $64.3 $80.5 National Rank 45th 40th Unemployment Rate: 5.4% 5.4% Primary Industries (% Employed): Trade, Transportation, and Utilities (18.8%) Government (22.8%) Government (18.6%) Trade, Transportation, and Utilities (17.8%) Professional and Business Services (15.8%) Education and Health Services (13.4%) Fortune 500 Companies: Source: SNL Financial, BEA, Fortune, and Virginia Employment Commission Demographics weighted by company deposits Growth metrics from 2012 - 2017 Attractive Virginia Markets 10 Median Population Growth (%) 2012 Median HH Income ($) Median HH Income Growth (%)

Organic Growth Opportunity EVBS is strategically positioned to take advantage of opportunities that will emerge through improving market conditions and industry consolidation as larger institutions remain distracted Source: SNL Financial; Deposit data as of 6/30/2012 Pro Forma for pending and recently completed acquisitions Excludes COF money center branches Richmond and Eastern VA defined as: Northumberland, Lancaster, Richmond, Westmoreland, Essex, Middlesex, Mathews, Gloucester, Ki ng and Queen, Caroline, King William, Hanover, New Kent, Charles City, Henrico, Goochland, Powhatan, Chesterfield, Dinwiddie, Prince George, Surry, Sussex, Southampton, Isl e o f Wight, Suffolk (city), Richmond (city), Petersburg (city), Hopewell (city), Colonial Heights (city) Zip Codes of Operation Richmond and Eastern VA 11 Deposits Market Branch in Market Share Rank Institution Count ($M) (%) 1 Eastern Virginia Bankshares Inc. 22 821 19.1 2 BB&T Corp. 12 717 16.7 3 Union First Market Bankshares Corp. 12 448 10.4 4 Wells Fargo & Co. 7 395 9.2 5 SunTrust Banks Inc. 7 347 8.1 6 Chesapeake Financial Shares Inc. 3 216 5.0 7 Community Bankers Trust Corp. 5 191 4.5 8 Bay Banks of Virginia Inc. 5 180 4.2 9 Bank of America Corp. 4 174 4.1 10 First Community Bancshares Inc. 2 109 2.5 11 Colonial Virginia Bank 2 104 2.4 12 C&F Financial Corp. 3 101 2.4 13 Franklin Financial Corp. 1 94 2.2 14 Hampton Roads Bankshares Inc. 1 85 2.0 15 Village Bank and Trust Financial Corp. 3 84 2.0 16 First Capital Bancorp Inc. 1 54 1.2 17 Virginia BanCorp Inc. 1 52 1.2 18 Bank of McKenney 1 41 0.9 19 Bank of Southside Virginia Corp. 1 33 0.8 20 M&T Bank Corp. 2 30 0.7 Total (1-20) 95 4,276 99.7 Total (1-22) 99 4,288 100.0 Deposits Market Branch in Market Share Rank Institution Count ($M) (%) 1 Bank of America Corp. 30 11,594 34.8 2 Wells Fargo & Co. 66 5,997 18.0 3 SunTrust Banks Inc. 51 3,484 10.4 4 BB&T Corp. 56 3,142 9.4 5 Union First Market Bankshares Corp. 55 1,909 5.7 6 Eastern Virginia Bankshares Inc. 22 821 2.5 7 C&F Financial Corp. 18 766 2.3 8 Franklin Financial Corp. 8 653 2.0 9 Community Bankers Trust Corp. 12 456 1.4 10 First Capital Bancorp Inc. 7 442 1.3 11 Village Bank and Trust Financial Corp. 13 430 1.3 12 Bank of Southside Virginia Corp. 12 394 1.2 13 Chesapeake Financial Shares Inc. 8 370 1.1 14 Farmers Bank 6 338 1.0 15 BankCap Equity Fund LLC 5 317 1.0 16 First Community Bancshares Inc. 9 308 0.9 17 Bay Banks of Virginia Inc. 9 268 0.8 18 Virginia BanCorp Inc. 9 250 0.8 19 Hampton Roads Bankshares Inc. 4 227 0.7 20 Bank of McKenney 7 184 0.6 Total (1-20) 325 29,264 87.8 Total (1-41) 452 33,347 100.0

Attractive Core Deposit Base 12 Core Deposit Composition (1) Source: SNL Financial Note: VA Peers include public banks and thrifts traded on a major exchange and headquartered in Virginia with assets between $50 0 million and $4.0 billion (1) Core deposits defined as total deposits less jumbo time deposits 79.8% 81.4% 83.1% 84.5% 84.0% 85.1% 77.6% 78.6% 77.0% 80.1% 81.4% 2.14% 1.43% 1.13% 0.77% 0.60% 0.58% 0.00% 0.50% 1.00% 1.50% 2.00% 2.50% 76.0% 78.0% 80.0% 82.0% 84.0% 86.0% 2009Y 2010Y 2011Y 2012Y 2013Q1 2013Q2 Cost of Deposits Core Deposits / Total Deposits (%) EVBS Core Deposits / Total Deposits (%) VA Peers Core Deposits / Total Deposits (%) EVBS Cost of Deposits

Appendix Financial Results

Year to Date Snapshot 14 As of and for the Six Months Ended June 30, (dollars in thousands) 2013 2012 Total assets $ 1,115,804 $ 1,066,460 Loans, net of unearned income 671,354 714,827 Investment securities (AFS) 275,790 254,665 Total deposits 842,271 832,112 Total shareholders' equity 135,149 96,930 Net interest income $ 16,165 $ 16,741 Provision for loan losses 1,200 4,158 Net interest income after provision for loan losses 14,965 12,583 Noninterest income 3,398 6,089 Noninterest expenses 16,161 16,675 Income before income taxes 2,202 1,997 Income tax expense 449 335 Net income $ 1,753 $ 1,662 Less: Effective dividend on preferred stock 752 750 Net income available to common shareholders $ 1,001 $ 912 Income per common share, basic $ 0.15 $ 0.15 Income per common share, diluted $ 0.14 $ 0.15
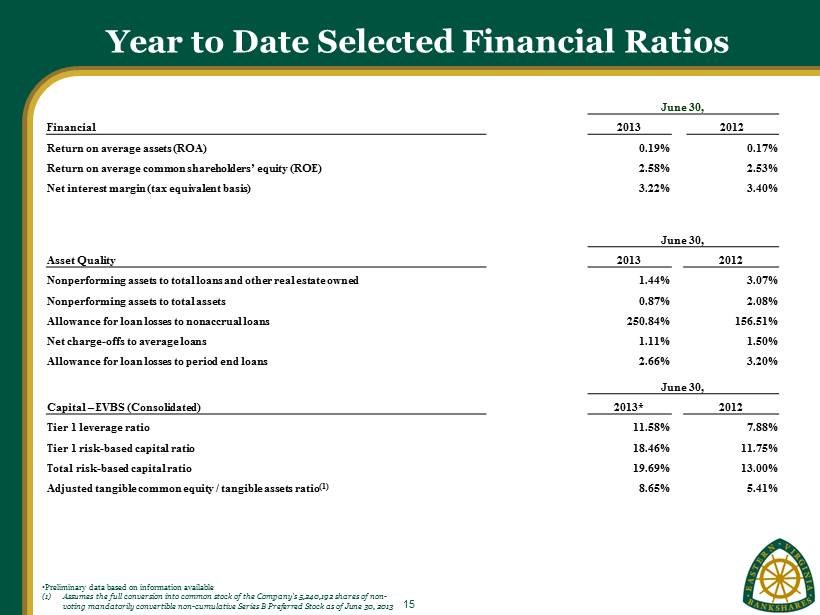
Year to Date Selected Financial Ratios 15 June 30, Financial 2013 2012 Return on average assets (ROA) 0.19% 0.17% Return on average common shareholders’ equity (ROE) 2.58% 2.53% Net interest margin (tax equivalent basis) 3.22% 3.40% June 30, Asset Quality 2013 2012 Nonperforming assets to total loans and other real estate owned 1.44% 3.07% Nonperforming assets to total assets 0.87% 2.08% Allowance for loan losses to nonaccrual loans 250.84% 156.51% Net charge - offs to average loans 1.11% 1.50% Allowance for loan losses to period end loans 2.66% 3.20% June 30, Capital – EVBS (Consolidated) 2013* 2012 Tier 1 leverage ratio 11.58% 7.88% Tier 1 risk - based capital ratio 18.46% 11.75% Total risk - based capital ratio 19.69% 13.00% Adjusted tangible common equity / tangible assets ratio (1) 8.65% 5.41% • Preliminary data based on information available (1) Assumes the full conversion into common stock of the Company's 5,240,192 shares of non - voting mandatorily convertible non - cumulative Series B Preferred Stock as of June 30, 2013

Asset Quality Comparison (Year over Year) 16 June 30, (dollars in thousands) 2013 2012 Total loans $ 671,354 $ 714,827 Other real estate owned 2,594 7,226 Total loans and other real estate owned $ 673,948 $722,053 Allowance for loan losses 17,833 22,866 Average loans YTD 674,306 724,009 Net charge - offs YTD 3,705 5,395 Nonperforming Assets Nonaccrual loans $ 7,110 $ 14,609 Loans past due 90 days and accruing interest - 336 Total nonperforming loans $ 7,110 $ 14,945 Other real estate owned 2,594 7,226 Total nonperforming assets $ 9,704 $ 22,171 Nonaccrual loans by type Construction $ 974 $ 1,651 Residential 1 - 4 family 4,431 7,280 Commercial real estate 1,337 4,303 Commercial and industrial 309 715 Consumer 59 660 Total $ 7,110 $ 14,609 Troubled Debt Restructurings (TDRs) Performing TDRs $ 5,209 $ 4,332 Nonperforming TDRs* 3,011 9,349 Total $ 8,220 $ 13,681 * Included in nonaccrual loans.
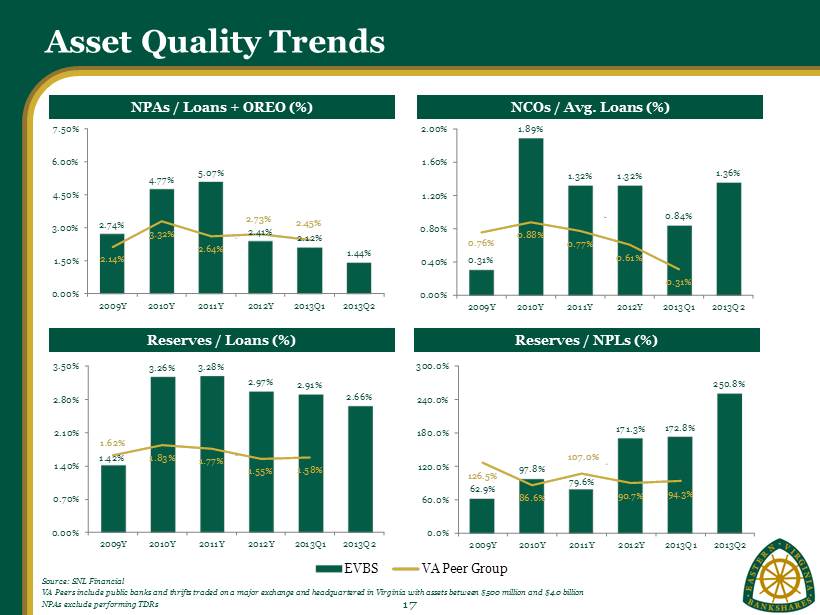
NCOs / Avg. Loans (%) Reserves / NPLs (%) Asset Quality Trends NPAs / Loans + OREO (%) Reserves / Loans (%) Source: SNL Financial VA Peers include public banks and thrifts traded on a major exchange and headquartered in Virginia with assets between $500 m ill ion and $4.0 billion NPAs exclude performing TDRs 17 77.7% 48.0% 89.5% 67.3% 89.0% 150.6% 88.3% 62.1% 53.7% 58.4% 0.0% 30.0% 60.0% 90.0% 120.0% 150.0% 180.0% 2008Y 2009Y 2010Y 2011Y 2012Q1 EVBS VA Peer Group 0.31% 1.89% 1.32% 1.32% 0.84% 1.36% 0.76% 0.88% 0.77% 0.61% 0.31% 0.00% 0.40% 0.80% 1.20% 1.60% 2.00% 2009Y 2010Y 2011Y 2012Y 2013Q1 2013Q2 2.74% 4.77% 5.07% 2.41% 2.12% 1.44% 2.14% 3.32% 2.64% 2.73% 2.45% 0.00% 1.50% 3.00% 4.50% 6.00% 7.50% 2009Y 2010Y 2011Y 2012Y 2013Q1 2013Q2 1.42% 3.26% 3.28% 2.97% 2.91% 2.66% 1.62% 1.83% 1.77% 1.55% 1.58% 0.00% 0.70% 1.40% 2.10% 2.80% 3.50% 2009Y 2010Y 2011Y 2012Y 2013Q1 2013Q2 62.9% 97.8% 79.6% 171.3% 172.8% 250.8% 126.5% 86.6% 107.0% 90.7% 94.3% 0.0% 60.0% 120.0% 180.0% 240.0% 300.0% 2009Y 2010Y 2011Y 2012Y 2013Q1 2013Q2

Asset Quality Criticized and Classified Loans 18 Since the end of 2011, Criticized loans have decreased 30.1% and classified loans have decreased 48.1%

Appendix Online - Mobile - Digital

Where W e Are Enhanced Consumer & Business Online Banking - 4Q11 Mobile Banking 1Q12 Redesigned Website – SEO, Sales, Experience Focus - 140%+ organic search displays increase, 240%+ increase in organic clicks - 2Q12 Popmoney – P2P Payments - 4Q12 Enhanced Mobile Alerts - 2Q13 20 Mobile Banking 148.6% Growth Consumer Online Banking 8.7% Growth Business Online Banking 23.2% Growth

Trends and Future Opportunities Mobile Optimized Website – 3Q13 − Leverage Native Capabilities − Optimize Conversions and Calls to Action Mobile Remote Deposit Capture – 4Q13 Tablet Mobile Banking – 4Q13 Online Account Opening 2014 Business Mobile Banking and mRDC 2014 21 Mobile Website Prototype Mobile Payments − Mobile Wallet − NFC – QR − Geo - Targeted Offers − Smartphone, iWatch, Google Glass Service & Sales − Chat − Video Conferencing − Mobile Data Driven Dynamic Marketing − CRM Data Mining − Customized Offers − Email − Online − Mobile Social Mining − Leads − Sentiment

Appendix Strategic Initiatives
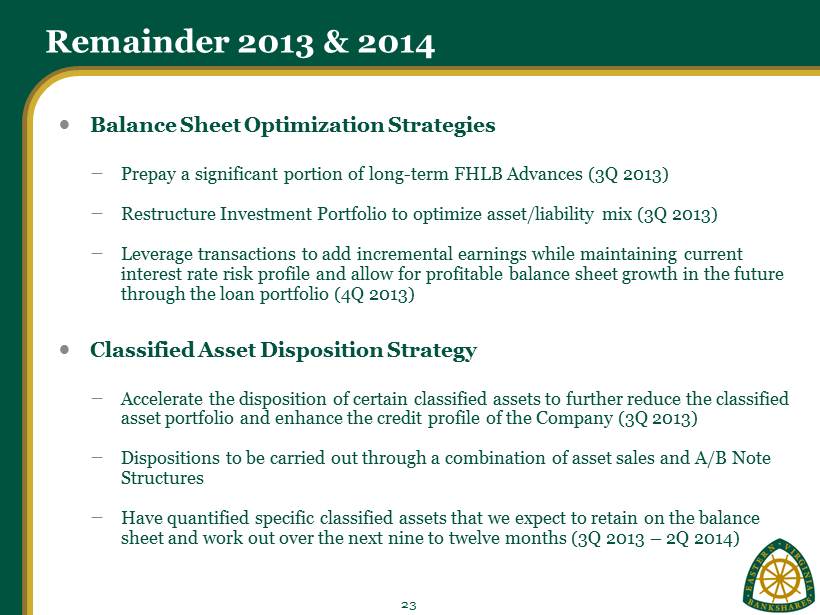
Remainder 2013 & 2014 23 Balance Sheet Optimization Strategies − Prepay a significant portion of long - term FHLB Advances (3Q 2013) − Restructure Investment Portfolio to optimize asset/liability mix (3Q 2013) − Leverage transactions to add incremental earnings while maintaining current interest rate risk profile and allow for profitable balance sheet growth in the future through the loan portfolio (4Q 2013) Classified Asset Disposition Strategy − Accelerate the disposition of certain classified assets to further reduce the classified asset portfolio and enhance the credit profile of the Company (3Q 2013) − Dispositions to be carried out through a combination of asset sales and A/B Note Structures − Have quantified specific classified assets that we expect to retain on the balance sheet and work out over the next nine to twelve months (3Q 2013 – 2Q 2014)
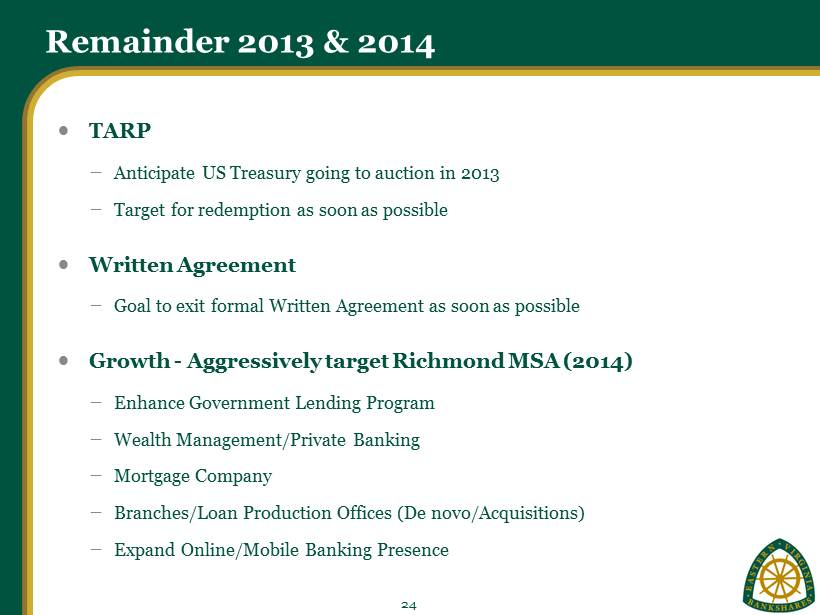
Remainder 2013 & 2014 24 TARP − Anticipate US Treasury going to auction in 2013 − Target for redemption as soon as possible Written Agreement − Goal to exit formal Written Agreement as soon as possible Growth - Aggressively target Richmond MSA (2014) − Enhance Government Lending Program − Wealth Management/Private Banking − Mortgage Company − Branches/Loan Production Offices (De novo/Acquisitions) − Expand Online/Mobile Banking Presence

Appendix Appendix
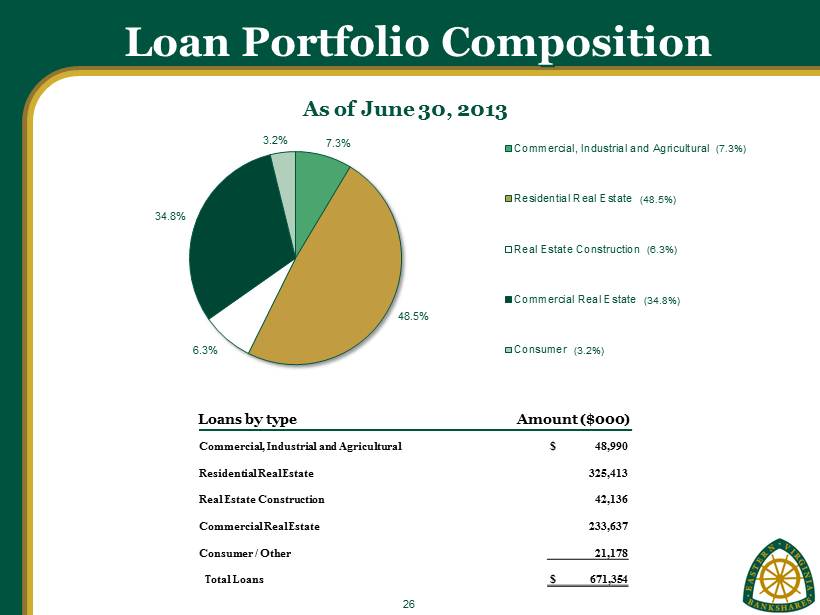
Loan Portfolio Composition 26 7.3% 48.5% 6.3% 34.8% 3.2% As of June 30, 2013 Commercial, Industrial and Agricultural Residential Real Estate Real Estate Construction Commercial Real Estate Consumer Commercial, Industrial and Agricultural $ 48,990 Residential Real Estate 325,413 Real Estate Construction 42,136 Commercial Real Estate 233,637 Consumer / Other 21,178 Total Loans $ 671,354 Loans by type Amount ($000) (7.3%) (48.5%) (6.3%) (34.8%) (3.2%)
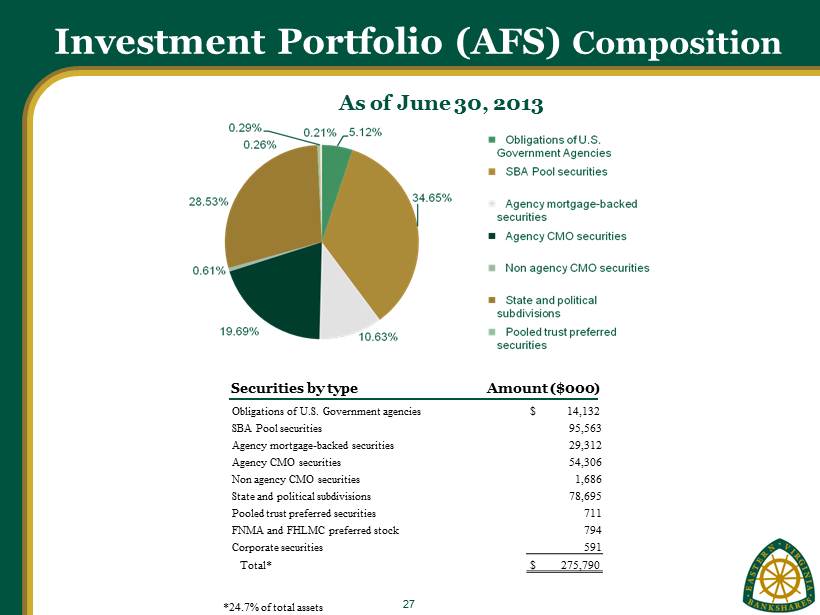
Investment Portfolio (AFS) Composition 27 As of June 30, 2013 Obligations of U.S. Government a gencies $ 14,132 SBA Pool securities 95,563 Agency mortgage - backed securities 29,312 Agency CMO securities 54,306 Non agency CMO securities 1,686 State and political subdivisions 78,695 Pooled trust preferred securities 711 FNMA and FHLMC preferred stock 794 Corporate securities 591 Total* $ 275,790 *24.7% of total assets Securities by type Amount ($000)

Deposit Composition 28 Noninterest – Bearing Demand Deposits $127,387 NOW (includes Reward Checking) 246,012 Money Market 124,078 Savings 91,226 Time Deposits < $100 thousand 128,657 Time Deposits > $100 thousand 124,911 Total $ 842,271 As of June 30, 2013 Deposits by type Amount ($000) (15.1%) (29.2%) (14.7%) (10.8%) (15.3%) (14.8%)
Non - GAAP Financial Information The Company prepares its financial statements under accounting principles generally accepted in the United States of America, or “GAAP”. However, this investor presentation also refers to certain non - GAAP financial measures that the Company believes, when considered together with GAAP financial measures, provide investors with important information regarding our operational performance. An analysis of any non - GAAP financial measure should be used in conjunction with results presented in accordance with GAAP. The adjusted tangible common equity to tangible assets ratio is a non - GAAP financial measure. Adjusted tangible common equity and tangible assets are non - GAAP financial measures derived from GAAP - based amounts. The Company calculates adjusted tangible common equity by excluding the balance of intangible assets (including goodwill) and the outstanding preferred stock issued to the U.S. Treasury from total shareholders’ equity. The Company calculates tangible assets by excluding the balance of intangible assets (including goodwill) from total assets. The Company believes these calculations give investors valuable information on the Company’s long - term equity capital position, by effectively assuming that the Company’s mandatorily convertible Series B Preferred Stock has entirely converted to common stock in accordance with its terms. The adjusted tangible book value per common share is a non - GAAP financial measure. The Company calculates the adjusted tangible book value per common share by dividing adjusted tangible common equity by the aggregate number of outstanding shares of the Company’s common stock and Series B Preferred Stock. The Company believes these calculations give investors valuable information on the market price of the Company’s common stock as compared to the underlying value of the Company’s common equity capital base following full conversion of the Series B Preferred Stock into common stock. These non - GAAP financial measures are supplemental and are not substitutes for an analysis based on a GAAP measure. As other companies may use different calculations for non - GAAP measures, the Company’s presentation may not be comparable to other similarly titled measures reported by other companies. Calculation of the Company’s adjusted tangible common equity to tangible assets ratio as of June 30, 2013 and June 30, 2012, and the calculation of the Company’s adjusted tangible book value per common share as of June 30, 2013, are as follows: 29

Reconciliation of Non - GAAP Financial Measures 30 (dollars in thousands) June 30, 2013 June 30, 2012 Adjusted tangible common equity to tangible assets ratio: Total Assets 1,115,804$ 1,066,460$ Less: Goodwill 15,970 15,970 Other intangible assets 67 120 Tangible Assets 1,099,767 1,050,370 Total Shareholders' Equity 135,149 96,930 Less: Goodwill 15,970 15,970 Other intangible assets 67 120 Series A Preferred Stock 24,000 24,000 Adjusted Tangible Common Equity (1) 95,112 56,840 Total shareholders' equity to total assets ratio 12.11% 9.09% Adjusted tangible common equity to tangible assets ratio 8.65% 5.41% (dollars in thousands) June 30, 2013 Adjusted tangible book value per common share: Adjusted Tangible Common Equity (1) 95,112$ Ending common shares outstanding 10,680,070 Adjusted ending common shares outstanding (1) 15,920,262 Book value per common share 8.39$ Adjusted tangible book value per common share (1) 5.97$ (1) Assumes the full conversion into common stock of the Company's 5,240,192 shares of non - voting mandatorily convertible non - cumulative Series B Preferred Stock as of June 30, 2013