Attached files
Table of Contents
UNITED STATES
SECURITIES AND EXCHANGE COMMISSION
Washington, D.C. 20549
FORM 10-K
| x | Annual Report Pursuant to Section 13 OR 15(d) of the Securities Exchange Act of 1934 |
For the fiscal year ended December 31, 2010
or
| ¨ | Transition Report Pursuant to Section 13 OR 15(d) of the Securities Exchange Act of 1934 |
For the transition period from to
Commission file number 000-23565
EASTERN VIRGINIA BANKSHARES, INC.
(Exact name of registrant as specified in its charter)
| Virginia | 54-1866052 | |
| (State or other jurisdiction of | (I.R.S. Employer | |
| incorporation or organization) | Identification No.) |
330 Hospital Road
Tappahannock, Virginia 22560
(Address of principal executive offices) (Zip Code)
Registrant’s telephone number, including area code: (804) 443-8460
Securities registered pursuant to Section 12(b) of the Act:
| Common Stock, $2 par value per share | The NASDAQ Stock Market LLC | |
| Title of each class | Name of each exchange on which registered |
Securities registered pursuant to Section 12(g) of the Act:
NONE
Indicate by check mark if the registrant is a well-known seasoned issuer, as defined in Rule 405 of the Securities Act. Yes ¨ No x
Indicate by check mark if the registrant is not required to file reports pursuant to Section 13 or Section 15(d) of the Act. Yes ¨ No x
Indicate by check mark whether the registrant (1) has filed all reports required to be filed by Section 13 or 15 (d) of the Securities Exchange Act of 1934 during the preceding 12 months (or for such shorter period that the registrant was required to file such reports), and (2) has been subject to such filing requirements for the past 90 days. Yes x No ¨
Indicate by check mark whether the registrant has submitted electronically and posted on its corporate Website, if any, every interactive Data File required to be submitted and posted pursuant to Rule 405 of Regulation S-T (§232.405 of this chapter) during the preceding 12 months (or for such shorter period that the registrant was required to submit such files). Yes ¨ No ¨
Indicate by check mark if disclosure of delinquent filers pursuant to Item 405 of Regulation S-K is not contained herein, and will not be contained, to the best of the registrant’s knowledge, in definitive proxy or information statements incorporated by reference in Part III of this Form 10-K or any amendment to this Form 10-K. ¨
Indicate by check mark whether the registrant is a large accelerated filer, an accelerated filer, a non-accelerated filer or a smaller reporting company. See the definitions of “large accelerated filer,” “accelerated filer” and “smaller reporting company” in Rule 12b-2 of the Exchange Act.
| Large accelerated filer | ¨ | Accelerated filer | ¨ | |||
| Non-accelerated filer | ¨ (Do not check if a smaller reporting company) | Smaller reporting company | x | |||
Indicate by check mark whether the registrant is a shell company (as defined in Rule 12b-2 of the Act). Yes ¨ No x
The aggregate market value of common stock held by non-affiliates of the registrant as of June 30, 2010 was $36.7 million.
There were 5,998,237 shares of common stock, par value $2.00 per share, outstanding as of March 24, 2011.
DOCUMENTS INCORPORATED BY REFERENCE
Portions of the 2011 definitive Proxy Statement to be delivered to shareholders in connection with the Annual Meeting of Shareholders to be held May 12, 2011 are incorporated by reference into Part III of this Annual Report on Form 10-K.
Table of Contents
2
Table of Contents
Part I
| Item 1. | Business |
General
Eastern Virginia Bankshares, Inc. is a bank holding company headquartered in Tappahannock, Virginia that was organized and chartered under the laws of the Commonwealth of Virginia on September 5, 1997 and commenced operations on December 29, 1997. Through our wholly-owned bank subsidiary, EVB (the “Bank”), we operate twenty-four full service branches and 2 drive-in facilities in eastern Virginia. Two of our three predecessor banks, Bank of Northumberland, Inc. and Southside Bank, were established in 1910. The third bank, Hanover Bank, was established as a de novo bank in 2000. In April 2006, these three banks were merged and the surviving bank was re-branded as EVB.
EVB is a community bank targeting small to medium-sized businesses and consumers in our traditional coastal plain markets and the emerging suburbs outside of the Richmond and Greater Tidewater areas. Our mission is to maximize shareholder value while providing superior financial products and services in each of the communities we serve and empowering employees to always do the right thing with a level of integrity that lives up to the trust our customers place in us.
The accompanying consolidated financial statements include the accounts of the Parent, the Bank and its subsidiaries, at times collectively referred to as the “Company”, “we”, “our”, or “us,” except where the context requires that “Company” refer only to Eastern Virginia Bankshares, Inc.
The Company provides a broad range of personal and commercial banking services including commercial, consumer and real estate loans. We complement our lending operations with an array of retail and commercial deposit products and fee-based services. Our services are delivered locally by well-trained and experienced bankers, whom we empower to make decisions at the local level, so they can provide timely lending decisions and respond promptly to customer inquiries. Having been in many of our markets for over 100 years, we have established relationships with and an understanding of our customers. We believe that, by offering our customers personalized service and a breadth of products, we can compete effectively as we expand within our existing markets and into new markets.
Historically, the Company’s goal has been to expand our footprint in eastern and central Virginia. To accomplish that goal, we have expanded and improved our branch network. In 2008, we opened the permanent location of our Quinton branch in New Kent County, Virginia and relocated our Village branch to a prominent Hanover County location with high visibility from Route 360 called the Windmill. In March 2008, we purchased two branches from Millennium Bank placing us in two new Virginia markets, Henrico County and Colonial Heights, and added $93 million in deposits and $49 million in loans to our balance sheet. While we plan to continue these strategies of building new branches in growing markets and purchasing other locations as the opportunities arise, the economic environment over the past 3 years has not been conducive to expansion. In December 2010, we closed one of oldest branches, Aylett, combining it with a newer and larger branch three miles away at Central Garage on Route 360. This location in King William County is fast becoming the economic center of that part of the county. Other changes to the branch system could occur in the future. Our goal continues to be to expand whenever possible when it is financially feasible. In addition, in February 2011 we entered into a written agreement with our federal and state banking regulators. The Company’s management and board of directors unanimously support the goal of financial soundness identified by this agreement. Certain portions of this agreement, including certain requirements applicable to the Bank’s existing businesses, may limit the Company’s ability to expand its operations while the agreement is effective. For additional discussion of this agreement, please see “Regulation and Supervision–Written Agreement” later in Item 1 of this Annual Report on Form 10-K.
The Bank has a 100% ownership interest in EVB Financial Services, Inc., which in turn has a 100% ownership interest in EVB Investments, Inc. and a 50% ownership interest in EVB Mortgage, LLC. EVB Investments, Inc. is a full-service brokerage firm offering a comprehensive range of investment services. EVB Mortgage, LLC was formed to originate and sell residential mortgages. The Bank has a 75% ownership interest in EVB Title, LLC, which primarily sells title insurance to the mortgage loan customers of the Bank and EVB Mortgage, Inc. The Bank has a 2.33% ownership in Virginia Bankers Insurance Center, LLC, which primarily sells insurance products to customers of the Bank, and other financial institutions that have an equity interest in the agency. The Bank also has a 100% ownership interest in Dunston Hall LLC, POS LLC, Tartan Holdings LLC and ECU-RE LLC which were formed to hold the title to real estate acquired by the Bank upon foreclosure on property of real estate secured loans. The financial position and operating results of these four subsidiaries are not significant to us as a whole and are not considered principal activities of the Company at this time.
3
Table of Contents
The Company also owns one non-operating subsidiary, EVB Statutory Trust I (the “Trust”), that was formed in September 2003. The Trust was formed for the purpose of issuing $10.0 million of trust preferred capital securities. The Trust is an unconsolidated subsidiary of the Company and its principal asset is $10.3 million of the Company’s junior subordinated deferrable interest debentures securities (referred to herein as “trust preferred debt”) that is reported as a liability of the Company.
Market Areas
The Company currently conducts business through twenty-four full service branches and two drive-in facilities, primarily in the eastern portion of the state. Our markets are located east of U.S. Route 250 and extend from northeast of Richmond to the Chesapeake Bay in central Virginia and across the James River from Colonial Heights to southeastern Virginia. Geographically, we have four primary market areas: Northern Neck, Middle Peninsula, Capital (suburbs of Richmond) and Southern.
Our Northern Neck and Middle Peninsula regions are in the eastern coastal plain of Virginia, often referred to as River Country. A number of the branches in this local have been in business for over one hundred years and have strong customer ties going back over multiple generations. According to the Virginia Economic Development Partnership, the region’s industries have traditionally been associated with abundant natural resources that include five rivers and the Chesapeake Bay. The diversified economy includes seafood harvesting, light manufacturing, agriculture, leisure, marine services and service sectors dedicated to many upscale retirement communities.
Our Capital region is currently comprised of Hanover, Henrico, King William and Caroline counties and Colonial Heights which are emerging suburbs of Richmond. Hanover County is approximately 10 miles from downtown Richmond and eighty-six miles south of Washington, DC. Hanover County is the largest county by area in the Richmond metropolitan area. The county provides residents and businesses the geographic advantages of a growing metropolitan area coupled with substantial acreage for expansion in a suburban setting. With a branch in the adjacent county of Henrico, which is closer to Richmond, we have the advantage of an established economic setting with many small business prospects. Our location in Colonial Heights puts us in the south Richmond suburbs and allows us to capitalize on the potential economic expansion caused by the growth of the U.S. Army facility at Fort Lee. The other two counties offer us growth opportunities as the Richmond suburbs expand farther north and east of their current boundaries.
Our Southern region is comprised of New Kent, Surry, Sussex, and Southampton counties. New Kent is one of the fastest growing counties in Virginia based on population. It is located southeast of Richmond and north of Williamsburg placing us in the growth zone of U.S. highway 64 that runs from Richmond to the Virginia Beach area of the Virginia Tidewater region. The other three counties are approximately fifty miles southeast of Richmond along or just off the state Route 460 corridor and are adjacent to the Greater Tidewater area. The port of Hampton Roads is approximately fifty miles to the east of our Southern region. The region’s close proximity to major military, naval and research centers and transportation infrastructure make this an attractive location for contractors and service and manufacturing companies.
Business Strategy
As a result of over 100 years of experience serving the Northern Neck and Middle Peninsula regions, we have a stable, loyal customer base and a high deposit market share in these regions. Due to the lower projected population growth of these markets, we expanded in Hanover, Henrico, Gloucester, New Kent and King William Counties and the city of Colonial Heights to target the higher potential growth in these existing and emerging suburban markets. The deposit market share we have accumulated in our Northern Neck, Middle Peninsula and Southern regions has helped fund our loan growth in the emerging suburban areas in the Central region.
We believe that economic growth and bank consolidation have created a growing number of businesses and consumers in need of the broad range of products and services, as well as the high level of personal service that we provide. While we work through the economic challenges of the last three years and look at 2011 as a year to strengthen our existing markets, our long-term business plan is to capitalize on the growth opportunity in our markets by further developing our branch network in our existing markets and augmenting our market area by expanding to the counties near the urban markets of Richmond and Greater Tidewater.
4
Table of Contents
Competition
The Bank encounters strong competition for its banking services within its primary market areas. The sources of competition vary based on the particular market of operation, which can range from a small rural town to part of a large urban market. The Bank competes with large national and regional financial institutions, savings associations and other independent community banks, as well as credit unions, mutual funds and life insurance companies. The banking business in the Bank’s primary market areas is highly competitive for both loans and deposits, and is dominated by a relatively small number of large banks with many offices operating over a wide geographic area. Among the advantages such large banks have over the Bank are their ability to offer banking products and services at large branch networks, to launch and finance wide-ranging advertising campaigns and, by virtue of their greater total capitalization, to have substantially higher lending limits than the Bank.
Factors such as interest rates offered, the number and location of branches and the types of products offered, as well as the reputation of the institution, affect competition for deposits and loans. The Bank competes by emphasizing customer service and technology, establishing long-term customer relationships, building customer loyalty, and providing products and services to address the specific needs of its customers. The Bank targets individuals and small to medium sized business customers. No material part of the Bank’s business is dependent upon a single or a few customers, and the loss of any single customer would not have a material adverse effect upon the Bank’s business.
Because federal regulation of financial institutions changes regularly and is the subject of constant legislative debate, we cannot foresee how federal regulation of financial institutions may change in the future. However, it is possible that current and future governmental regulatory and economic initiatives could impact the competitive landscape in the Bank’s markets.
Employees
As of December 31, 2010, the Company had 314 full-time equivalent employees. Management of the Company considers its relations with employees to be excellent. No employees are represented by a union or any similar group, and the Company has never experienced any strike or labor dispute.
Regulation and Supervision
General
Bank holding companies and banks are extensively regulated under both federal and state law. The following summary briefly describes the more significant provisions of currently applicable federal and state laws and certain regulations and the potential impact of such provisions on the Company and the Bank. This summary is not complete, and we refer you to the particular statutory or regulatory provisions or proposals for more information. Because federal regulation of financial institutions changes regularly and is the subject of constant legislative debate, we cannot forecast how federal regulation of financial institutions may change in the future and affect the Company’s and the Bank’s operations.
Written Agreement
On February 17, 2011, the Company and EVB entered into a Written Agreement (the “Written Agreement”) with the Federal Reserve Bank of Richmond (the “Reserve Bank”) and the Virginia State Corporation Commission Bureau of Financial Institutions (the “Bureau”).
Under the terms of the Written Agreement, the Bank has agreed to develop and submit for approval within the time periods specified therein written plans to: (a) strengthen board oversight of management and the Bank’s operation; (b) strengthen credit risk management practices; (c) enhance lending and credit administration; (d) enhance the grading of the Bank’s loan portfolio; (e) improve the Bank’s position with respect to loans, relationships, or other assets in excess of $900 thousand which are now or in the future become past due more than 90 days, which are on the Bank’s problem loan list, or which are adversely classified in any report of examination of the Bank; (f) review and revise the Bank’s methodology for determining the allowance for loan and lease losses (“ALLL”) and maintain an adequate ALLL; (g) enhance the Bank’s written internal audit program; (h) enhance management of the Bank’s liquidity position and funds management practices; (i) establish a revised contingency funding plan; (j) establish a revised investment policy; and (k) strengthen information technology.
5
Table of Contents
In addition, the Bank has agreed that it will: (a) not extend, renew, or restructure any credit that has been criticized by the Reserve Bank or the Bureau absent prior board of directors approval in accordance with the restrictions in the Written Agreement; and (b) eliminate all assets or portions of assets classified as “loss” and thereafter charge off all assets classified as “loss” in a federal or state report of examination, unless otherwise approved by the Reserve Bank.
Under the terms of the Written Agreement, both the Company and the Bank have agreed to submit capital plans to maintain sufficient capital at the Company, on a consolidated basis, and the Bank, on a stand-alone basis, and to refrain from declaring or paying dividends without prior regulatory approval. The Company has agreed that it will not take any other form of payment representing a reduction in the Bank’s capital or make any distributions of interest, principal, or other sums on subordinated debentures or trust preferred securities without prior regulatory approval. The Company may not incur, increase or guarantee any debt without prior regulatory approval and has agreed not to purchase or redeem any shares of its stock without prior regulatory approval.
Regulation of the Company
The Company must file annual, quarterly and other periodic reports with the Securities and Exchange Commission (the “SEC”). The Company is directly affected by the corporate responsibility and accounting reform legislation signed into law on July 30, 2002, known as the Sarbanes-Oxley Act of 2002 (the “SOX Act”), and the related rules and regulations. The SOX Act includes provisions that, among other things: (1) require that periodic reports containing financial statements that are filed with the SEC be accompanied by chief executive officer and chief financial officer certifications as to their accuracy and compliance with the law; (2) prohibit public companies, with certain limited exceptions, from making personal loans to their directors or executive officers; (3) require chief executive officers and chief financial officers to forfeit bonuses and profits if company financial statements are restated due to misconduct; (4) require audit committees to pre-approve all audit and non-audit services provided by an issuer’s outside auditors, except for de minimis non-audit services; (5) protect employees of public companies who assist in investigations relating to violations of the federal securities laws from job discrimination; (6) require companies to disclose in plain English on a “rapid and current basis” material changes in their financial condition or operations, as well as certain other specified information; (7) require a public company’s Section 16 insiders to make Form 4 filings with the SEC within two business days following the day on which purchases or sales of the company’s equity securities were made; and (8) increased penalties for existing crimes and created new criminal offenses. While the Company has incurred additional expenses in complying with the requirements of the SOX Act and related regulations adopted by the SEC and the Public Company Accounting Oversight Board, we anticipate that those expenses will not have a material effect on the Company’s results of operations or financial condition.
When enacted in 2002, Section 404(b) of the SOX Act required public companies to include in their annual reports on Form 10-K an assessment from management of the effectiveness of the company’s internal control over financial reporting, and required the company’s auditor to attest to and report on management’s assessment. From 2002 through 2010, the SEC had delayed implementation of Section 404(b) of the SOX Act for public companies with a public float below $75 million (i.e. companies that are smaller reporting companies or non-accelerated filers). In July 2010, the Dodd-Frank Wall Street Reform and Consumer Protection Act (the “Dodd-Frank Act”) permanently exempted smaller reporting companies and non-accelerated filers from Section 404(b) of the SOX Act, and the SEC made conforming amendments to certain of its rules and forms in September 2010. The Company has voluntarily provided an attestation by the Company’s auditor on management’s assessment of the Company’s internal control over financial reporting in this Annual Report on Form 10-K.
The Company is also subject to regulation by the Board of Governors of the Federal Reserve System (the “Federal Reserve Board”). The Federal Reserve Board has jurisdiction to approve any bank or non-bank acquisition, merger or consolidation proposed by a bank holding company. The Bank Holding Company Act of 1956 (the “BHCA”) generally limits the activities of a bank holding company and its subsidiaries to that of banking, managing or controlling banks, or any other activity that is closely related to banking or to managing or controlling banks.
Since September 1995, the BHCA has permitted bank holding companies from any state to acquire banks and bank holding companies located in any other state, subject to certain conditions, including nationwide and state imposed concentration limits. Banks also are able to branch across state lines, provided certain conditions are met, including that applicable state laws expressly permit such interstate branching. Virginia permits branching across state lines, provided there is reciprocity with the state in which the out-of-state bank is based.
6
Table of Contents
Federal law and regulatory policy impose a number of obligations and restrictions on bank holding companies and their depository institution subsidiaries to reduce potential loss exposure to the depositors and to the Federal Deposit Insurance Corporation (the “FDIC”) insurance funds. For example, a bank holding company must commit resources to support its subsidiary depository institutions. In addition, insured depository institutions under common control must reimburse the FDIC for any loss suffered or reasonably anticipated by the Deposit Insurance Fund (the “DIF”) as a result of the default of a commonly controlled insured depository institution. The FDIC may decline to enforce the provisions if it determines that a waiver is in the best interest of the DIF. An FDIC claim for damage is superior to claims of stockholders of an insured depository institution or its holding company but is subordinate to claims of depositors, secured creditors and holders of subordinated debt, other than affiliates, of the commonly controlled insured depository institution.
The Federal Deposit Insurance Act (the “FDIA”) provides that amounts received from the liquidation or other resolution of any insured depository institution must be distributed, after payment of secured claims, to pay the deposit liabilities of the institution before payment of any other general creditor or stockholder. This provision would give depositors a preference over general and subordinated creditors and stockholders if a receiver is appointed to distribute the assets of the Bank.
The Company also is subject to regulation and supervision by the Bureau.
Capital Requirements
The Federal Reserve Board and the FDIC have issued substantially similar risk-based and leverage capital guidelines applicable to banking organizations they supervise. Under the risk-based capital requirements of these federal bank regulatory agencies, the Company and the Bank are required to maintain a minimum ratio of total capital to risk-weighted assets of at least 8.0% and a minimum ratio of Tier 1 capital to risk-weighted assets of at least 4.0%. At least half of the total capital must be Tier 1 capital, which includes common equity, retained earnings and qualifying perpetual preferred stock, less certain intangibles and other adjustments. The remainder may consist of Tier 2 capital, such as a limited amount of subordinated and other qualifying debt (including certain hybrid capital instruments), other qualifying preferred stock and a limited amount of the general loan loss allowance. For the Company only, Tier 1 and total capital include trust preferred securities. At December 31, 2010, the total capital to risk-weighted assets ratio of the Company was 11.70% and the ratio of the Bank was 10.99%. At December 31, 2010, the Tier 1 capital to risk-weighted assets ratio was 10.51% for the Company and 8.36% for the Bank.
In addition, each of the federal regulatory agencies has established leverage capital ratio guidelines for banking organizations. These guidelines provide for a minimum Tier l leverage ratio of 4.0% for banks and bank holding companies. At December 31, 2010, the Tier l leverage ratio was 7.38% for the Company and 5.86% for the Bank. The guidelines also provide that banking organizations experiencing internal growth or making acquisitions must maintain capital positions substantially above the minimum supervisory levels, without significant reliance on intangible assets.
On January 9, 2009, as part of the Capital Purchase Program (the “Capital Purchase Program” or “CPP”) established by the U.S. Department of the Treasury (the “Treasury”) under the Emergency Economic Stabilization Act of 2008 (the “EESA”), as discussed below, the Company issued and sold to Treasury for an aggregate purchase price of $24.0 million in cash (1) 24,000 shares of the Company’s fixed rate cumulative perpetual preferred stock, Series A, par value $2.00 per share, having a liquidation preference of $1,000 per share (Series A Preferred Stock) and (2) a ten-year warrant to purchase up to 373,832 shares of the Company’s common stock, par value $2.00 per share (“Common Stock”), at an initial exercise price of $9.63 per share (“Warrant”). The Series A Preferred Stock has been treated as Tier 1 capital for regulatory capital adequacy determination purposes.
In December 2010, the Basel Committee on Banking Supervision (the “Basel Committee”) released its final framework for strengthening international capital and liquidity regulation, now officially identified by the Basel Committee as “Basel III.” Basel III, when implemented by the U.S. banking agencies and fully phased-in, will require bank holding companies and their bank subsidiaries to maintain substantially more capital, with a greater emphasis on common equity. Implementation is presently scheduled to be phased in between 2014 and 2019, although it is possible that implementation may be delayed as a result of multiple factors including the current condition of the banking industry within the U.S. and abroad.
The Basel III final capital framework, among other things, (i) introduces as a new capital measure “Common Equity Tier 1” (CET1), (ii) specifies that Tier 1 capital consists of CET1 and “Additional Tier 1 capital” instruments meeting specified requirements, (iii) defines CET1 narrowly by requiring that most adjustments to regulatory capital measures be made to CET1 and not to the other components of capital and (iv) expands the scope of the adjustments as compared to existing regulations.
7
Table of Contents
When fully phased in on January 1, 2019, Basel III requires banks to maintain (i) as a newly adopted international standard, a minimum ratio of CET1 to risk-weighted assets of at least 4.5%, plus a 2.5% “capital conservation buffer” (which is added to the 4.5% CET1 ratio as that buffer is phased in, effectively resulting in a minimum ratio of CET1 to risk-weighted assets of at least 7%), (ii) a minimum ratio of Tier 1 capital to risk-weighted assets of at least 6.0%, plus the capital conservation buffer (which is added to the 6.0% Tier 1 capital ratio as that buffer is phased in, effectively resulting in a minimum Tier 1 capital ratio of 8.5% upon full implementation), (iii) a minimum ratio of Total (that is, Tier 1 plus Tier 2) capital to risk-weighted assets of at least 8.0%, plus the capital conservation buffer (which is added to the 8.0% total capital ratio as that buffer is phased in, effectively resulting in a minimum total capital ratio of 10.5% upon full implementation) and (iv) as a newly adopted international standard, a minimum leverage ratio of 3%, calculated as the ratio of Tier 1 capital to balance sheet exposures plus certain off-balance sheet exposures (computed as the average for each quarter of the month-end ratios for the quarter).
Basel III also provides for a “countercyclical capital buffer,” generally to be imposed when national regulators determine that excess aggregate credit growth becomes associated with a buildup of systemic risk, that would be a CET1 add-on to the capital conservation buffer in the range of 0% to 2.5% when fully implemented (potentially resulting in total buffers of between 2.5% and 5%).
The aforementioned capital conservation buffer is designed to absorb losses during periods of economic stress. Banking institutions with a ratio of CET1 to risk-weighted assets above the minimum but below the conservation buffer (or below the combined capital conservation buffer and countercyclical capital buffer, when the latter is applied) will face constraints on dividends, equity repurchases and compensation based on the amount of the shortfall.
The implementation of the Basel III final framework will commence January 1, 2013. On that date, banking institutions will be required to meet the following minimum capital ratios:
| • | 3.5 % CET1 to risk-weighted assets. |
| • | 4.5% Tier 1 capital to risk-weighted assets. |
| • | 8.0% Total capital to risk-weighted assets. |
The Basel III final framework provides for a number of new deductions from and adjustments to CET1. These include, for example, the requirement that mortgage servicing rights, deferred tax assets dependent upon future taxable income and significant investments in non-consolidated financial entities be deducted from CET1 to the extent that any one such category exceeds 10% of CET1 or all such categories in the aggregate exceed 15% of CET1.
Implementation of the deductions and other adjustments to CET1 will begin on January 1, 2014 and will be phased-in over a five-year period (20% per year). The implementation of the capital conservation buffer will begin on January 1, 2016 at 0.625% and be phased in over a four-year period (increasing by that amount on each subsequent January 1, until it reaches 2.5% on January 1, 2019).
The U.S. banking agencies have indicated informally that they expect to propose regulations implementing Basel III in mid-2011 with final adoption of implementing regulations in mid-2012. Notwithstanding its release of the Basel III framework as a final framework, the Basel Committee is considering further amendments to Basel III, including the imposition of additional capital surcharges on globally systemically important financial institutions. In addition to Basel III, the Dodd-Frank Act requires or permits the federal banking agencies to adopt regulations affecting banking institutions’ capital requirements in a number of respects, including potentially more stringent capital requirements for systemically important financial institutions. Accordingly, the regulations ultimately applicable to the Company may be substantially different from the Basel III final framework as published in December 2010. Requirements to maintain higher levels of capital or to maintain higher levels of liquid assets could adversely impact the Company’s net income and return on equity.
Limits on Dividends
The ability of the Parent to pay dividends depends upon the amount of dividends declared by the Bank, and is subject to various laws and regulations, including requirements to maintain capital at or above regulatory minimums. Regulatory restrictions also exist with respect to the Bank’s ability to pay dividends. Under the terms of the written agreement among the Company, the Bank, the Reserve Bank and the Bureau, each of the Company and the Bank are subject to additional limitations and regulatory restrictions and may not declare or pay dividends to its shareholders (including payments by the Company related to trust
8
Table of Contents
preferred securities) without prior regulatory approval. See Note 16 to Consolidated Financial Statements in Part II, Item 8 of this Form 10-K.
The Dodd-Frank Act
On July 21, 2010, financial regulatory reform legislation entitled the “Dodd-Frank Wall Street Reform and Consumer Protection Act” was signed into law. The Dodd-Frank Act implements far-reaching changes across the financial regulatory landscape, including provisions that, among other things, will:
| • | Centralize significant aspects of consumer financial protection by creating a new agency, the Consumer Financial Protection Bureau, responsible for implementing, examining and enforcing compliance with federal consumer financial laws for institutions with more than $10 billion of assets and, to a lesser extent, smaller institutions. As a smaller institution, most consumer protection aspects of the Dodd-Frank Act will continue to be applied to the Company by the Reserve Bank and to the Bank by the FDIC. |
| • | Restrict the preemption of state law by federal law and disallow subsidiaries and affiliates of national banks from availing themselves of such preemption. |
| • | Apply the same leverage and risk-based capital requirements that apply to insured depository institutions to most bank holding companies. |
| • | Require bank holding companies and banks to be both well capitalized and well managed in order to acquire banks located outside their home state. |
| • | Change the assessment base for federal deposit insurance from the amount of insured deposits to consolidated assets less tangible capital, eliminate the ceiling on the size of the DIF and increase the floor of the size of the DIF. |
| • | Impose comprehensive regulation of the over-the-counter derivatives market, which would include certain provisions that would effectively prohibit insured depository institutions from conducting certain derivatives businesses in the institution itself. |
| • | Require large, publicly traded bank holding companies to create a risk committee responsible for the oversight of enterprise risk management. |
| • | Require loan originators to retain 5% of any loan sold or securitized, unless it is a “qualified residential mortgage”, which must still be defined by the regulators. FHA, VA and Rural Housing Service loans are specifically exempted from the risk retention requirements. |
| • | Implement corporate governance revisions, including with regard to executive compensation and proxy access by shareholders that apply to all public companies not just financial institutions. |
| • | Make permanent the $250,000 limit for federal deposit insurance and increase the cash limit of Securities Investor Protection Corporation protection from $100,000 to $250,000 and provide unlimited federal deposit insurance until December 31, 2012 for non-interest bearing demand transaction accounts at all insured depository institutions. |
| • | Repeal the federal prohibitions on the payment of interest on demand deposits, thereby permitting depository institutions to pay interest on business transaction and other accounts. |
| • | Amend the Electronic Fund Transfer Act (“EFTA”) to, among other things, give the Federal Reserve the authority to establish rules regarding interchange fees charged for electronic debit transactions by payment card issuers having assets over $10 billion and to enforce a new statutory requirement that such fees be reasonable and proportional to the actual cost of a transaction to the issuer. |
Many aspects of the Dodd-Frank Act are subject to rulemaking and will take effect over several years, making it difficult to anticipate the overall financial impact on the Company, its subsidiaries, its customers or the financial industry more generally. Provisions in the legislation that affect the payment of interest on demand deposits and interchange fees are likely to increase the costs associated with deposits as well as place limitations on certain revenues those deposits may generate. Provisions in the legislation that revoke the Tier 1 capital treatment of trust preferred securities and otherwise require revisions to the capital requirements of the Company and the Bank could require the Company and the Bank to seek other sources of capital in the future. Some of the rules that have been proposed and, in some cases, adopted to comply with the Dodd-Frank Act’s mandates are discussed further below.
Economic Emergency Stabilization Act of 2008 (the “EESA”) and the American Recovery & Reinvestment Act of 2009 (the “ARRA”)
9
Table of Contents
In October 2008, the EESA was signed into law, which provided immediate authority and facilities that the Treasury could use to restore liquidity and stability to the financial system. Specifically, Section 101 of EESA established the Troubled Asset Relief Program (“TARP”) to purchase, and to make and fund commitments to purchase, troubled assets from any financial institution, on such terms and conditions as are determined by the Secretary of the Treasury, and in accordance with EESA and the policies and procedures developed and published by the Secretary of the Treasury. Section 111 of EESA provides that entities that receive financial assistance from Treasury under TARP will be subject to specified executive compensation and corporate governance standards to be established by the Secretary of the Treasury. The statutory language in EESA includes three limitations on executive compensation for TARP recipients involved in a direct purchase. On February 17, 2009, the President signed the ARRA into law. ARRA contains a number of restrictions on executive and highly-paid employee compensation for those institutions that have received, or will receive, government assistance under TARP that are considerably more restrictive and far-reaching than the limited restrictions included in EESA.
On June 10, 2009, the Treasury released regulations in an Interim Final Rule (“IFR”) that sets standards for complying with the executive compensation and corporate governance provisions for TARP recipients contained in EESA, as amended by ARRA. The standards for compensation and corporate governance established in the IFR: (1) prohibit the payment or accrual of bonus, retention award and incentive compensation (with the exception of limited amounts of restricted stock) for specified individuals, depending upon the level of government assistance received by the institution; (2) prohibit making any golden parachute payments to a senior executive officer (“SEO”) or any of the next five most highly compensated employees (“MHCE”); (3) prohibit tax gross-ups to SEOs and any of the next 20 MHCEs; (4) provide for the recovery of any bonus, incentive compensation, or retention award paid to a SEO or the next 20 MHCEs based on materially inaccurate statements of earnings, revenues, gains, or other criteria (clawback); (5) require the establishment of a compensation committee of independent directors to meet semi-annually to review employee compensation plans and the risks posed by these plans to the institution; (6) limit compensation to exclude incentives for SEOs to take unnecessary and excessive risk that threaten the value of the institution and eliminate features of employee compensation plans that pose unnecessary risks to the institution; (7) prohibit employee compensation plans that would encourage manipulation of earnings to enhance an employee’s compensation; (8) require the adoption of an excessive or luxury expenditures policy; (9) require compliance with federal securities laws and regulations regarding non-binding resolution on SEO compensation to shareholders; (10) require disclosure of perquisites offered to SEOs and certain highly compensated employees; and (11) require disclosures related to compensation consultant engagements.
Incentive Compensation
In June 2010, the Federal Reserve Board, the Office of the Comptroller of the Currency and the FDIC issued a comprehensive final guidance on incentive compensation intended to ensure that the incentive compensation policies of banking organizations do not undermine the safety and soundness of such organizations by encouraging excessive risk-taking. The guidance, which covers all employees that have the ability to materially affect the risk profile of an organization, either individually or as part of a group, is based upon the key principles that a banking organization’s incentive compensation arrangements should (i) provide incentives that do not encourage risk-taking beyond the organization’s ability to effectively identify and manage risks, (ii) be compatible with effective internal controls and risk management, and (iii) be supported by strong corporate governance, including active and effective oversight by the organization’s board of directors.
The Federal Reserve Board will review, as part of the regular, risk-focused examination process, the incentive compensation arrangements of banking organizations, such as the Company, that are not “large, complex banking organizations.” These reviews will be tailored to each organization based on the scope and complexity of the organization’s activities and the prevalence of incentive compensation arrangements. The findings of the supervisory initiatives will be included in reports of examination. Deficiencies will be incorporated into the organization’s supervisory ratings, which can affect the organization’s ability to make acquisitions and take other actions. Enforcement actions may be taken against a banking organization if its incentive compensation arrangements, or related risk-management control or governance processes, pose a risk to the organization’s safety and soundness and the organization is not taking prompt and effective measures to correct the deficiencies.
Regulation of the Bank
The Bank, as a member bank of the Federal Reserve System, is subject to regulation and examination by the Bureau and the Federal Reserve Board. In addition, the Bank is subject to the rules and regulations of the FDIC, which currently insures
10
Table of Contents
substantially all of the Bank’s deposits up to applicable limits of the DIF, and is subject to deposit insurance assessments to maintain the DIF.
FDIA and Associated Regulations
Section 36 of the FDIA and associated regulations require management of every insured depository institution with total assets between $500 million and $1 billion at the beginning of a fiscal year to obtain an annual audit of its financial statements by an independent public accountant, report to the banking agencies on the institution’s compliance with designated laws and regulations and establish an audit committee comprised of outside directors, at least a majority of whom must be independent of management. The Bank is subject to the annual audit, reporting and audit committee requirements of Section 36 of the FDIA.
FDIC Insurance, Assessments and Regulation
The Bank’s deposits are insured up to applicable limits by the DIF of the FDIC. The FDIC amended its risk-based assessment system in 2007 to implement authority granted by the Federal Deposit Insurance Reform Act of 2005 (“FDIRA”). Under the revised system, insured institutions are assigned to one of four risk categories based on supervisory evaluations, regulatory capital levels and certain other factors. An institution’s assessment rate depends upon the category to which it is assigned. Unlike the other categories, Risk Category I, which contains the least risky depository institutions, contains further risk differentiation based on the FDIC’s analysis of financial ratios, examination component ratings and other information. Assessment rates are determined by the FDIC and, for calendar year 2008, assessments ranged from five to 43 basis points of each institution’s deposit assessment base. Due to losses incurred by the DIF in 2008 from failed institutions, and anticipated future losses, the FDIC adopted an across the board seven basis point increase in the assessment range for the first quarter of 2009. The FDIC made further refinements to its risk-based assessment that became effective April 1, 2009, and effectively made the range seven to 77.5 basis points. The FDIC may adjust rates uniformly from one quarter to the next, except that no single adjustment can exceed three basis points.
FDIRA also provided for a one-time credit for eligible institutions based on their assessment base as of December 31, 1996. Subject to certain limitations with respect to institutions that are exhibiting weaknesses, credits can be used to offset assessments until exhausted. FDIRA also provided for the possibility that the FDIC may pay dividends to insured institutions if the DIF reserve ratio equals or exceeds 1.35 percent of estimated insured deposits.
The EESA temporarily raised the basic limit on federal deposit insurance coverage from $100,000 to $250,000 per depositor. The legislation originally provided that the basic deposit insurance limit would return to $100,000 after December 31, 2009. The legislation did not change coverage for retirement accounts, which continues to be $250,000. In July 2010, the Dodd-Frank Act made permanent the $250,000 limit for federal deposit insurance.
In November 2008, the FDIC adopted a final rule implementing the Temporary Liquidity Guarantee Program (the “TLGP”) because of disruptions in the credit markets, particularly the interbank lending market, which reduced banks’ liquidity and impaired their ability to lend. The goal of the TLGP is to decrease the cost of bank funding so that bank lending to consumers and businesses will normalize. The TLGP is industry funded and does not rely on the DIF to achieve its goals. The TLGP consists of two components: a temporary guarantee of certain newly-issued senior unsecured debt (the “Debt Guarantee Program”) and a temporary unlimited guarantee of funds in noninterest-bearing transaction accounts at FDIC-insured institutions (the “Transaction Account Guarantee Program”).
| • | Under the Debt Guarantee Program, all newly-issued senior unsecured debt (as defined in the regulation) will be charged an annualized assessment of up to 100 basis points (depending on debt term) on the amount of debt issued, and calculated through the earlier of the maturity date of that debt or December 31, 2012 (extended by subsequent amendment from June 30, 2012). The Company has thus far issued no such senior unsecured debt and has incurred no assessments under the Debt Guarantee Program. |
| • | Under the Transaction Account Guarantee Program, amounts exceeding the existing deposit insurance limit of $250,000 in any noninterest-bearing transaction accounts (as defined in the regulation) will be assessed an annualized 10 basis points collected quarterly for coverage through December 31, 2010 (extended twice from December 31, 2009 and June 30, 2010, respectively). The Company has customer accounts that qualify for this coverage and continued its participation until December 31, 2010. The Company incurred assessment charges from November 13, 2008 until the program’s conclusion. |
11
Table of Contents
In May 2009, the FDIC adopted a final rule imposing a five basis point special assessment on each insured depository institution’s assets minus Tier 1 capital as of June 30, 2009. The assessment was part of the FDIC’s efforts to rebuild the DIF and help maintain public confidence in the banking system. The Company was assessed $500 thousand, all of which was expensed in 2009.
In November 2009, the FDIC adopted a final rule requiring insured depository institutions to prepay their estimated quarterly risk-based assessments for the fourth quarter of 2009, and for all of 2010, 2011 and 2012, on December 31, 2009, along with each institution’s risk-based deposit insurance assessment for the third quarter of 2009. The prepayment was based on an institution’s assessment rate and assessment base for the third quarter of 2009, assuming a five percent annual growth in deposits each year. While the FDIC plan would maintain current assessment rates through 2010, effective January 1, 2011, the rates would increase by three basis points across the board. The FDIC has elected to forgo this increase under a new DIF restoration plan adopted in October 2010 as discussed below. On December 30, 2009, the Company prepaid $5.4 million of FDIC assessments.
In October 2010, the FDIC adopted a new DIF restoration plan to ensure that the fund reserve ratio reaches 1.35 percent by September 30, 2020, as required by the Dodd-Frank Act. Under the new restoration plan, the FDIC will forego the uniform three-basis point increase in initial assessment rates scheduled to take place on January 1, 2011 and maintain the current schedule of assessment rates for all depository institutions. At least semi-annually, the FDIC will update its loss and income projections for the fund and, if needed, will increase or decrease assessment rates, following notice-and-comment rulemaking if required.
In November 2010 and January 2011, the FDIC issued final rules to implement provisions of the Dodd-Frank Act and other federal legislation that provide for temporary unlimited coverage for noninterest-bearing transaction accounts beginning January 1, 2011 and continuing through December 2012. For purposes of this extension, the definition of noninterest-bearing transaction accounts excludes negotiable order of withdraw consumer checking accounts (NOW accounts) but includes Interest on Lawyer Trust Accounts (IOLTAs). The extended program is not optional and will no longer be funded by separate premiums.
FDIC insurance expense totaled $2.3 million, $1.7 million and $465 thousand in 2010, 2009 and 2008, respectively. FDIC insurance expense includes deposit insurance assessments and Financing Corporation (“FICO”) assessments related to outstanding FICO bonds. The FICO is a mixed-ownership government corporation established by the Competitive Equality Banking Act of 1987 whose sole purpose was to function as a financing vehicle for the now defunct Federal Savings & Loan Insurance Corporation.
In February 2011, the FDIC approved a final rule that changes the assessment base from domestic deposits to average consolidated total assets minus average tangible equity (defined as Tier 1 capital); adopts a new large-bank pricing assessment scheme; and sets a target size for the DIF. The changes will go into effect beginning with the second quarter of 2011 and will be payable at the end of September 2011. The rule, as mandated by the Dodd-Frank Act, finalizes a target size for the DIF at 2 percent of insured deposits. It also implements a lower assessment rate schedule when the fund reaches 1.15 percent and, in lieu of dividends, provides for a lower rate schedule when the reserve ration reaches 2 percent and 2.5 percent.
Monetary and Fiscal Policies
The commercial banking business is affected by the monetary policies adopted by the Federal Reserve Board. Changes in the discount rate on member bank borrowing, availability of borrowing at the “discount window,” open market operations, the imposition of any changes in reserve requirements against member banks’ deposits and certain borrowing by banks and their affiliates, and the limitation of interest rates which member banks may pay on deposits are some of the instruments of monetary policy available to the Federal Reserve. Taken together, these controls give the Federal Reserve a significant influence over the growth and profitability of all banks. The Company’s management is unable to predict how the Federal Reserve Board’s monetary policies (or the fiscal policies or economic controls imposed by federal or state governments) will affect the business and earnings of the Bank or the Company, or what those policies or controls will be.
USA Patriot Act of 2001
In October 2001, the USA Patriot Act of 2001 (the “Patriot Act”) was enacted in response to the terrorist attacks in New York, Pennsylvania and Washington, D.C. which occurred on September 11, 2001. The Patriot Act is intended to strengthen the
12
Table of Contents
ability of U.S. law enforcement agencies and the intelligence communities to work cohesively to combat terrorism on a variety of fronts. The potential impact of the Patriot Act on financial institutions of all kinds is significant and wide ranging. The Patriot Act contains sweeping anti-money laundering and financial transparency laws and imposes various regulations, including standards for verifying client identification at account opening, and rules to promote cooperation among financial institutions, regulators and law enforcement entities in identifying parties that may be involved in terrorism or money laundering.
Community Reinvestment Act
The Community Reinvestment Act (“CRA”) imposes on financial institutions an affirmative and ongoing obligation to meet the credit needs of their local communities, including low and moderate-income neighborhoods, consistent with the safe and sound operation of those institutions. A financial institution’s efforts in meeting community credit needs are assessed based on specified factors. These factors also are considered in evaluating mergers, acquisitions and applications to open a branch or facility. Following the Bank’s most recent scheduled compliance examination in September 2010, it received a CRA performance evaluation of “satisfactory”.
Federal Home Loan Bank of Atlanta
The Bank is a member of the Federal Home Loan Bank (“FHLB”) of Atlanta, which is one of 12 regional FHLBs that provide funding to their members for making housing loans as well as for affordable housing and community development loans. Each FHLB serves as a reserve, or central bank, for the members within its assigned region. Each is funded primarily from proceeds derived from the sale of consolidated obligations of the FHLB System. Each FHLB makes loans to members in accordance with policies and procedures established by the Board of Directors of the FHLB. As a member, the Bank must purchase and maintain stock in the FHLB of Atlanta. In 2004, the FHLB converted to its new capital structure, which established the minimum capital stock requirement for member banks as an amount equal to the sum of a membership requirement and an activity-based requirement. At December 31, 2010, the Bank held $8.3 million of FHLB of Atlanta stock.
Reporting Terrorist Activities
The Federal Bureau of Investigation (“FBI”) has sent, and will send, banking regulatory agencies lists of the names of persons suspected of involvement in terrorist activities. The Bank has been requested, and will be requested, to search its records for any relationships or transactions with persons on those lists. If the Bank finds any relationships or transactions, it must file a suspicious activity report with the Treasury Department and contact the FBI.
The Office of Foreign Assets Control (“OFAC”), which is a division of the Treasury Department, is responsible for helping to ensure that United States entities do not engage in transactions with “enemies” of the United States, as defined by various Executive Orders and Acts of Congress. OFAC has sent, and will send, banking regulatory agencies lists of names of persons and organizations suspected of aiding, harboring or engaging in terrorist acts. If the Bank finds a name on any transaction, account or wire transfer that is on an OFAC list, it must freeze such account, file a suspicious activity report with the Treasury Department and notify the FBI. The Bank has appointed an OFAC compliance officer to oversee the inspection of its accounts and the filing of any notifications. The Bank actively checks high-risk areas such as new accounts, wire transfers and customer files. The Bank performs these checks utilizing software, which is updated each time a modification is made to the lists of Specially Designated Nationals and Blocked Persons provided by OFAC and other agencies.
Interagency Appraisal and Evaluation Guidelines
In December 2010, the Federal Reserve Board, the Office of the Comptroller of the Currency and the FDIC, jointly with other federal regulatory agencies, issued the Interagency Appraisal and Evaluation Guidelines. This guidance, which updates guidance originally issued in 1994, sets forth the minimum regulatory standards for appraisals. The guidance incorporates previous regulatory issuances affecting appraisals, addresses advances in information technology used in collateral evaluation, and clarifies standards for use of analytical methods and technological tools in developing evaluations. The guidance also requires institutions to use strong internal controls to ensure reliable appraisals and evaluations and to monitor and periodically update valuations of collateral for existing real estate loans and transactions.
Consumer Protection
13
Table of Contents
The Fair and Accurate Credit Transactions Act of 2003, which amended the Fair Credit Reporting Act, requires financial institutions to implement policies and procedures that track identity theft incidents; provide identity-theft victims with evidence of fraudulent transactions upon request; block from reporting to consumer reporting agencies credit information resulting from identity theft; notify customers of adverse information concerning the customer in consumer reporting agency reports; and notify customers when reporting negative information concerning the customer to a consumer reporting agency.
Prompt Correction Action
The federal banking agencies have broad powers under current federal law to take prompt corrective action to resolve problems of insured depository institutions. The extent of these powers depends upon whether the institution in question is “well capitalized,” “adequately capitalized,” “undercapitalized,” “significantly undercapitalized” or “critically undercapitalized.” These terms are defined under uniform regulations issued by each of the federal banking agencies regulating these institutions. An insured depository institution which is less than adequately capitalized must adopt an acceptable capital restoration plan, is subject to increased regulatory oversight and is increasingly restricted in the scope of its permissible activities. As of December 31, 2010, the Bank was considered “well capitalized.”
Gramm-Leach-Bliley Act of 1999 (“GLBA”)
The GLBA implemented major changes to the statutory framework for providing banking and other financial services in the United States. The GLBA, among other things, eliminated many of the restrictions on affiliations among banks and securities firms, insurance firms and other financial service providers. A bank holding company that qualifies and elects to be a financial holding company is permitted to engage in activities that are financial in nature or incident or complimentary to financial activities. The activities that the GLBA expressly lists as financial in nature include insurance underwriting, sales and brokerage activities, financial and investment advisory services, underwriting services and limited merchant banking activities.
To become eligible for these expanded activities, a bank holding company must qualify as a financial holding company. To qualify as a financial holding company, each insured depository institution controlled by the bank holding company must be well-capitalized, well-managed and have at least a satisfactory rating under the CRA. In addition, the bank holding company must file with the Federal Reserve Board a declaration of its intention to become a financial holding company.
The GLBA has not had a material adverse impact on the Company’s or the Bank’s operations. To the extent that it allows banks, securities firms and insurance firms to affiliate, the financial services industry may experience further consolidation. The GLBA may have the result of increasing competition that the Bank faces from larger institutions and other companies that offer financial products and services that may have substantially greater financial resources than the Company or the Bank.
The GLBA and certain regulations issued by federal banking agencies also provide protections against the transfer and use by financial institutions of consumer nonpublic personal information. A financial institution must provide to its customers, at the beginning of the customer relationship and annually thereafter, the institution’s policies and procedures regarding the handling of customers’ nonpublic personal financial information. These privacy provisions generally prohibit a financial institution from providing a customer’s personal financial information to unaffiliated third parties other than permitted by law.
Future Regulation
Including and in addition to the specific proposals described above, from time to time, various legislative and regulatory initiatives are introduced in Congress and state legislatures, as well as by regulatory agencies. Such initiatives may include proposals to expand or contract the powers of bank holding companies and depository institutions or proposals to substantially change the financial institution regulatory system. Such legislation could change banking statutes and the operating environment of the Company in substantial and unpredictable ways. If enacted, such legislation could increase or decrease the cost of doing business, limit or expand permissible activities or affect the competitive balance among banks, savings associations, credit unions, and other financial institutions. The Company cannot predict whether any such legislation will be enacted, and, if enacted, the effect that it, or any implementing regulations, would have on the financial condition or results of operations of the Company. A change in statutes, regulations or regulatory policies applicable to the Company or any of its subsidiaries could have a material effect on the business of the Company.
Available Information
14
Table of Contents
The Company’s SEC filings are filed electronically and are available to the public over the Internet at the SEC’s web site at http://www.sec.gov. In addition, any document filed by the Company with the SEC can be read and copied at the SEC’s public reference facilities at 100 F Street, N.E., Room 1580, Washington, D.C. 20549. Copies of documents can be obtained at prescribed rates by writing to the Public Reference Section of the SEC at 100 F Street, N.E., Washington, D.C. 20549. The public may obtain information on the operation of the Public Reference Room by calling the SEC at 1-800-SEC-0330. The Company’s SEC filings also are available through our web site at http://www.evb.org under “SEC Filings” as soon as reasonably practicable after they are filed with the SEC. Copies of documents also can be obtained free of charge by writing to the Company’s Corporate Secretary at P.O. Box 1455, Tappahannock, VA 22560 or by calling 804-443-8400. The information on the Company’s website is not, and shall not be deemed to be, a part of this Annual Report on Form 10-K or incorporated into any other filings the Company makes with the SEC.
| Item 1A. | Risk Factors |
An investment in our common stock involves significant risks inherent to the Company’s business. Like other bank holding companies, we are subject to a number of risks, many of which are outside of our control. If any of the events or circumstances described in the following risk factors actually occur, our business, financial condition, results of operations and prospects could be harmed. These risks are not the only ones that we may face. Other risks of which we are not aware, including those which relate to the banking and financial services industry in general and us in particular, or those which we do not currently believe are material, may harm our future business, financial condition, results of operations and prospects. Readers should consider carefully the following important risks, in conjunction with the other information in this Annual Report on Form 10-K including our consolidated financial statements and related notes, in evaluating us, our business and an investment in our securities.
Difficult conditions in the economy and the capital markets continue to adversely affect our industry.
Dramatic declines in the housing market, with falling home prices and increasing foreclosures, followed by unemployment and under-employment, have negatively impacted the credit performance of real estate related loans and consumer loans and have resulted in significant write-downs of asset values by financial institutions. These write-downs spread to other securities and loans and have caused many financial institutions to seek additional capital, to reduce or eliminate dividends, to merge with larger and stronger institutions and, in some cases, to fail. In this environment, many lenders and institutional investors have reduced or ceased providing funding to borrowers, including to other financial institutions. This market turmoil and tightening of credit have led to an increased level of commercial and consumer delinquencies, lack of consumer confidence, and reduction of business activity generally. Continuing economic pressure on consumers may adversely affect our business and results of operations. Market developments may affect consumer confidence levels and may cause adverse changes in payment patterns, causing increases in delinquencies and default rates, which may impact our charge-offs and provision for loan losses. A worsening of these conditions would likely exacerbate the adverse effects of these difficult market conditions on us and others in the financial institutions industry.
The capital and credit markets have experienced volatility and disruption in recent years. In some cases, these markets have produced downward pressure on stock prices and credit availability for certain issuers without regard to those issuers’ underlying financial strength. If these levels of market disruption and volatility recur, there can be no assurance that we will not experience an adverse effect, which may be material, on our ability to access capital and on our business, financial condition and results of operations.
The Company has a high concentration of loans secured by both residential and commercial real estate and a further downturn in either or both real estate markets, for any reason, may increase the Company’s credit losses, which would negatively affect its financial results.
The Company offers a variety of secured loans, including commercial lines of credit, commercial term loans, real estate, construction, home equity, consumer and other loans. Most of the Company’s loans are secured by real estate (both residential and commercial) in its market area. At December 31, 2010, approximately 85.5% of the Company’s $774.8 million loan portfolio was secured by residential and commercial real estate. Changes in the real estate market, such as the greater deterioration in market value of collateral, or a greater decline in local employment rates or economic conditions, could adversely affect the Company’s customers ability to pay these loans, which in turn could impact the Company’s profitability. There has been a slowdown in the housing market across our geographical footprint, reflecting declining prices and excess inventories of houses to be sold. Repayment of our commercial loans is often dependent on the cash flow of the borrower,
15
Table of Contents
which may be unpredictable in the current economy. If the value of real estate serving as collateral for the loan portfolio materially declines, a significant portion of the loan portfolio could become under-collateralized. If the loans that are secured by real estate become troubled when real estate market conditions are declining or have declined, in the event of foreclosure the Company may not be able to realize the amount of collateral that was anticipated at the time of originating the loan. In that event, the Company may have to increase the provision for loan losses, which could have a material adverse effect on its operating results and financial condition.
We have a concentration of credit exposure in acquisition and development (“ADC”) real estate loans.
At December 31, 2010, we have approximately $76.3 million in loans for the acquisition and development of real estate and for construction of improvements to real estate, representing approximately 9.9% of our total loans outstanding as of that date. These loans are to developers, builders and individuals. Project types financed include acquisition and development of residential subdivisions and commercial developments, builder lines for 1-4 family home construction and loans to individuals for primary and secondary residence construction. These types of loans are generally viewed as having more risk of default than residential real estate loans. Completion of development projects and sale of developed properties may be affected significantly by general economic conditions, and further downturn in the local economy or in occupancy rates in the local economy where the property is located could increase the likelihood of default. Because our loan portfolio contains acquisition and development loans with relatively large balances, the deterioration of one or a few of these loans could cause a significant increase in our percentage of non-performing loans. An increase in non-performing loans could result in a loss of earnings from these loans, an increase in the provision for loan losses and an increase in charge-offs, all of which could have a material adverse effect on our financial condition and results of operations.
Deterioration in the soundness of our counterparties could adversely affect us.
Our ability to engage in routine funding transactions could be adversely affected by the actions and commercial soundness of other financial institutions. Financial services institutions are interrelated as a result of trading, clearing, counterparty or other relationships, and we routinely execute transactions with counterparties in the financial industry, including brokers and dealers, commercial banks, and other institutional clients. As a result, defaults by, or even rumors or questions about, one or more financial services institutions, or the financial services industry generally, could create another market-wide liquidity crisis similar to that experienced in late 2008 and early 2009 and could lead to losses or defaults by us or by other institutions. There is no assurance that the failure of our counterparties would not materially adversely affect the Company’s results of operations.
Our small to medium-sized business target market may have fewer financial resources to weather a downturn in the economy.
We target our commercial development and marketing strategy primarily to serve the banking and financial services needs of small and medium-sized businesses. These businesses generally have fewer financial resources in terms of capital or borrowing capacity than larger entities. If general economic conditions negatively impact this major economic sector in the markets in which we operate, our results of operations and financial condition may be adversely affected.
We may be adversely affected by economic conditions in our market area.
We operate in a mixed market environment with influences from both rural and urban areas. Because our lending operation is concentrated in the Northern Neck, Middle Peninsula, Capital and Southern Regions of Virginia, we will be affected by the general economic conditions in these markets. Changes in the local economy may influence the growth rate of our loans and deposits, the quality of the loan portfolio, and loan and deposit pricing. A significant decline in general economic conditions caused by inflation, recession, unemployment or other factors beyond our control would impact these local economic conditions and the demand for banking products and services generally, which could negatively affect our financial condition and performance. Although we might not have significant credit exposure to all the businesses in our areas, the downturn in any of these businesses could have a negative impact on local economic conditions and real estate collateral values generally, which could negatively affect our profitability.
If our allowance for loan losses becomes inadequate, our results of operations may be adversely affected.
Making loans is an essential element of our business. The risk of nonpayment is affected by a number of factors, including but not limited to: the duration of the credit; credit risks of a particular customer; changes in economic and industry conditions; and,
16
Table of Contents
in the case of a collateralized loan, risks resulting from uncertainties about the future value of the collateral. Although we seek to mitigate risks inherent in lending by adhering to specific underwriting practices, our loans may not be repaid. We attempt to maintain an appropriate allowance for loan losses to provide for potential losses in our loan portfolio. Our allowance for loan losses is determined by analyzing historical loan losses, current trends in delinquencies and charge-offs, current economic conditions that may affect a borrower’s ability to repay and the value of collateral, changes in the size and composition of the loan portfolio and industry information. Also included in our estimates for loan losses are considerations with respect to the impact of economic events, the outcome of which are uncertain. Because any estimate of loan losses is necessarily subjective and the accuracy of any estimate depends on the outcome of future events, we face the risk that charge-offs in future periods will exceed our allowance for loan losses and that additional increases in the allowance for loan losses will be required. Additions to the allowance for loan losses would result in a decrease of our net income. Although we believe our allowance for loan losses is adequate to absorb probable losses in our loan portfolio, we cannot predict such losses or that our allowance will be adequate in the future.
Compliance with laws, regulations and supervisory guidance, both new and existing, may adversely impact our business, financial condition and results of operations.
We are subject to numerous laws, regulations and supervision from both federal and state agencies. During the past few years, there has been an increase in legislation related to and regulation of the financial services industry. We expect this increased level of oversight to continue. Failure to comply with these laws and regulations could result in financial, structural and operational penalties, including receivership. In addition, establishing systems and processes to achieve compliance with these laws and regulations may increase our costs and/or limit our ability to pursue certain business opportunities.
Laws and regulations, and any interpretations and applications with respect thereto, generally are intended to benefit consumers, borrowers and depositors, not stockholders. The legislative and regulatory environment is beyond our control, may change rapidly and unpredictably and may negatively influence our revenue, costs, earnings, and capital levels. Our success depends on our ability to maintain compliance with both existing and new laws and regulations.
The Dodd-Frank Act could increase our regulatory compliance burden and associated costs, place restrictions on certain products and services, and limit our future capital raising strategies.
A wide range of regulatory initiatives directed at the financial services industry have been proposed in recent months. One of those initiatives, the Dodd-Frank Act, was signed into law on July 21, 2010. The Dodd-Frank Act represents a sweeping overhaul of the financial services industry within the United States and mandates significant changes in the financial regulatory landscape that will impact all financial institutions, including the Company. The Dodd-Frank Act will likely increase our regulatory compliance burden and may have a material adverse effect on us, by increasing the costs associated with our regulatory examinations and compliance measures. The federal regulatory agencies, and particularly bank regulatory agencies, are given significant discretion in drafting the Dodd-Frank Act’s implementing rules and regulations and, consequently, many of the details and much of the impact of the Dodd-Frank Act will depend on the final implementing rules and regulations. Accordingly, it remains too early to fully assess the impact of the Dodd-Frank Act and subsequent regulatory rulemaking processes on our business, financial condition or results of operations.
Among the Dodd-Frank Act’s significant regulatory changes, the Dodd-Frank Act creates a new financial consumer protection agency that could impose new regulations on us and include its examiners in our routine regulatory examinations conducted by the FDIC, which could increase our regulatory compliance burden and costs and restrict the financial products and services we can offer to our customers. This agency, named the Consumer Financial Protection Bureau, may reshape the consumer financial laws through rulemaking and enforcement of the Dodd-Frank Act’s prohibitions against unfair, deceptive and abusive business practices, which may directly impact the business operations of financial institutions offering consumer financial products or services, including the Company. This agency’s broad rulemaking authority includes identifying practices or acts that are unfair, deceptive or abusive in connection with any consumer financial transaction or consumer financial product or service. Although the Consumer Financial Protection Bureau has jurisdiction over banks with $10 billion or greater in assets, rules, regulations and policies issued by the Bureau may also apply to the Company or its subsidiaries by virtue of the adoption of such policies and best practices by the Federal Reserve and FDIC. The costs and limitations related to this additional regulatory agency and the limitations and restrictions that will be placed upon the Company with respect to its consumer product and service offerings have yet to be determined. However, these costs, limitations and restrictions may produce significant, material effects on our business, financial condition and results of operations.
17
Table of Contents
The Dodd-Frank Act also increases regulatory supervision and examination of bank holding companies and their banking and non-banking subsidiaries, which could increase our regulatory compliance burden and costs and restrict our ability to generate revenues from non-banking operations. The Dodd-Frank Act imposes more stringent capital requirements on bank holding companies, which could limit our future capital strategies. The Dodd-Frank Act also increases regulation of derivatives and hedging transactions, which could limit our ability to enter into, or increase the costs associated with, interest rate hedging transactions.
The Company may incur losses if it is unable to successfully manage interest rate risk.
The Company’s profitability depends in substantial part upon the spread between the interest rates earned on investments and loans and interest rates paid on deposits and other interest-bearing liabilities. These rates are normally in line with general market rates and rise and fall based on the asset liability committee’s view of our financing and liquidity needs. The Company may selectively pay above-market rates to attract deposits as it has done in some of the Company’s marketing promotions in the past. Changes in interest rates will affect the Company’s operating performance and financial condition in diverse ways including the pricing of securities, loans and deposits, which, in turn, may affect the growth in loan and retail deposit volume. The Company attempts to minimize the Company’s exposure to interest rate risk, but cannot eliminate it. The Company’s net interest income will be adversely affected if market interest rates change so that the interest it pays on deposits and borrowings increases faster than the interest earned on loans and investments. The Company’s net interest spread will depend on many factors that are partly or entirely outside its control, including competition, federal economic, monetary and fiscal policies, and economic conditions generally. Fluctuations in market rates are neither predictable nor controllable and may have a material and negative effect on the Company’s business, financial condition and results of operations.
Changes in interest rates also affect the value of the Company’s loans. An increase in interest rates could adversely affect the Company’s borrowers’ ability to pay the principal or interest on existing loans or reduce their desire to borrow more money. This may lead to an increase in nonperforming assets or a decrease in loan originations, either of which could have a material and negative effect on the Company’s results of operations.
Our future success is dependent on our ability to compete effectively in the highly competitive banking industry.
We face vigorous competition from other banks and other financial institutions, including savings and loan associations, savings banks, finance companies and credit unions for deposits, loans and other financial services in our market area. A number of these banks and other financial institutions are significantly larger than we are and have substantially greater access to capital and other resources, as well as larger lending limits and branch systems, and offer a wider array of banking services. To a limited extent, we also compete with other providers of financial services, such as money market mutual funds, brokerage firms, consumer finance companies, insurance companies and governmental organizations which may offer more favorable financing than we can. Many of our non-bank competitors are not subject to the same extensive regulations that govern us. As a result, these non-bank competitors have advantages over us in providing certain services. While we believe we compete effectively with these other financial institutions in our primary markets, we may face a competitive disadvantage as a result of our smaller size, smaller asset base, lack of geographic diversification and inability to spread our marketing costs across a broader market. If we have to raise interest rates paid on deposits or lower interest rates charged on loans to compete effectively, our net interest margin and income could be negatively affected. Failure to compete effectively to attract new or to retain existing, clients may reduce or limit our margins and our market share and may adversely affect our results of operations, financial condition and growth.
The Company and Bank have entered into the Written Agreement with the Federal Reserve Bank of Richmond and the Virginia Bureau of Financial Institutions, which requires us to dedicate a significant amount of resources to complying with the agreement and may have a material adverse effect on our operations and the value of our securities.
Effective February 17, 2011, the Company and Bank entered into a Written Agreement with the Reserve Bank and the Bureau.
The Written Agreement requires the Company and the Bank to address significant aspects of their business operations, including submitting plans to the Reserve Bank and the Bureau to strengthen board oversight, credit risk management practices, lending and credit administration, and loan grading and allowance for loan losses methodologies. In order to appropriately address the topics referenced in and comply with the Written Agreement, as well as to maximize the improvements to our operations, the Company will dedicate a significant amount of resources to tasks related to the Written Agreement. These resources may not be available for use in other aspects of our business, which may have a material adverse impact on our operations.
18
Table of Contents
For a full description of the Written Agreement, please see “Regulation and Supervision–Written Agreement” in Item 1 of this Annual Report on Form 10-K.
Under the terms of the Written Agreement, both the Company and the Bank have agreed to submit capital plans to maintain sufficient capital at the Company, on a consolidated basis, and the Bank, on a stand-alone basis, and to refrain from declaring or paying dividends without prior regulatory approval. The Company has agreed that it will not take any other form of payment representing a reduction in the Bank’s capital or make any distributions of interest, principal, or other sums on subordinated debentures or trust preferred securities without prior regulatory approval. The Company may not incur, increase or guarantee any debt without prior regulatory approval and has agreed not to purchase or redeem any shares of its stock without prior regulatory approval.
This description of the Written Agreement is qualified in its entirety by reference to the copy of the Written Agreement filed with the Company’s Current Report on Form 8-K, filed February 17, 2011. If the Company and Bank do not comply with the Written Agreement, we could be subject to the assessment of civil money penalties, further regulatory sanctions, or other regulatory enforcement actions.
The Company is subject to restrictions and obligations as a participant in the Treasury’s Capital Purchase Program.
In January 2009, as part of the Capital Purchase Program, we issued and sold to the Treasury Series A Preferred Stock and a Warrant for an aggregate purchase price of approximately $24.0 million. Participation in the Capital Purchase Program subjects us to specific restrictions under the terms of the Capital Purchase Program, including limits on our ability to pay dividends and repurchase our capital stock, limitations on executive compensation, and increased oversight by the Treasury, regulators and Congress under the EESA.
Many recipients under the Capital Purchase Program have repaid the Treasury and are no longer subject to the restrictions imposed under the Capital Purchase Program. Withdrawing from the Capital Purchase Program requires approval of banking regulators and we may not be able to obtain such approval, or a condition of obtaining such approval may require us to raise additional capital. Unanticipated consequences of participation in the Capital Purchase Program could materially and adversely affect our business, results of operations, financial condition, access to funding and the trading price of our common stock.
We rely heavily on our management team and the unexpected loss of any of those personnel could adversely affect our operations; we depend on our ability to attract and retain key personnel.
We are a customer-focused and relationship-driven organization. We expect our future growth to be driven in a large part by the relationships maintained with our customers by our president and chief executive officer and other senior officers. We have entered into employment agreements with the majority of our executive officers. The existence of such agreements, however, does not necessarily assure that we will be able to continue to retain their services. The unexpected loss of any of our key employees could have an adverse effect on our business and possibly result in reduced revenues and earnings. We do maintain bank-owned life insurance on key officers that would help cover some of the economic impact of a loss caused by death. The implementation of our business strategy will also require us to continue to attract, hire, motivate and retain skilled personnel to develop new customer relationships as well as new financial products and services. Many experienced banking professionals employed by our competitors are covered by agreements not to compete or solicit their existing customers if they were to leave their current employment. These agreements make the recruitment of these professionals more difficult. The market for these people is competitive, and we cannot assure you that we will be successful in attracting, hiring, motivating or retaining them.
We may not be able to successfully manage our long-term growth, which may adversely affect our results of operations and financial condition.
A key aspect of our long-term business strategy is our continued growth and expansion. Our ability to continue to grow depends, in part, upon our ability to:
| • | open new branch offices or acquire existing branches or other financial institutions; |
| • | attract deposits to those locations; and |
| • | identify attractive loan and investment opportunities. |
19
Table of Contents
We may not be able to successfully implement our growth strategy if we are unable to identify attractive markets, locations or opportunities to expand in the future, or if we are subject to regulatory restrictions on growth or expansion of our operations. Our ability to manage our growth successfully also will depend on whether we can maintain capital levels adequate to support our growth, maintain cost controls and asset quality and successfully integrate any businesses we acquire into our organization. As we identify opportunities to implement our growth strategy by opening new branches or acquiring branches or other banks, we may incur increased personnel, occupancy and other operating expenses. In the case of new branches, we must absorb those higher expenses while we begin to generate new deposits, and there is a further time lag involved in redeploying new deposits into attractively priced loans and other higher yielding earning assets. Thus, any plans for branch expansion could decrease our earnings in the short run, even if we efficiently execute our branching strategy.
Our deposit insurance premiums could increase in the future, which may adversely affect our future financial performance.
The FDIC insures deposits at FDIC insured financial institutions, including the Bank. The FDIC charges insured financial institutions premiums to maintain the DIF at a certain level. Economic conditions since 2008 have increased the rate of bank failures and expectations for further bank failures, requiring the FDIC to make payments for insured deposits from the DIF and prepare for future payments from the DIF.
During 2009, the FDIC imposed a special deposit insurance assessment on all institutions which it regulates, including the Bank. This special assessment was imposed due to the need to replenish the DIF, as a result of increased bank failures and expected future bank failures. In addition, the FDIC required regulated institutions to prepay their fourth quarter 2009, and full year 2010, 2011 and 2012 assessments in December 2009. Any similar, additional measures taken by the FDIC to maintain or replenish the DIF may have an adverse effect on our financial condition and results of operations.
On February 7, 2011, the FDIC adopted final rules to implement changes required by the Dodd-Frank Act with respect to the FDIC assessment rules that will be effective April 1, 2011. Once these changes are effective, a depository institution’s deposit insurance assessment will be calculated based on the institution’s total assets less tangible equity, rather than the previous base of total deposits. The Company expects that these changes will not increase the Company’s FDIC insurance assessments for comparable asset and deposit levels. However, if the Bank’s asset size increases or the FDIC takes other actions to replenish the DIF, the Bank’s FDIC insurance premiums could increase.
The Company’s disclosure controls and procedures and internal controls may not prevent or detect all errors or acts of fraud.
The Company’s disclosure controls and procedures are designed to reasonably assure that information required to be disclosed by the Company in reports it files or submits under the Exchange Act of 1934 (the “Exchange Act”) is accumulated and communicated to management, and recorded, processed, summarized and reported within the time periods specified in the SEC’s rules and forms. The Company believes that any disclosure controls and procedures or internal controls and procedures, no matter how well conceived and operated, can provide only reasonable, not absolute, assurance that the objectives of the control system are met. These inherent limitations include the realities that judgments in decision-making can be faulty, and that breakdowns can occur because of simple error or omission. Additionally, controls can be circumvented by individual acts, by collusion by two or more people and/or by override of the established controls. Accordingly, because of the inherent limitations in the Company’s control systems and in human nature, misstatements due to error or fraud may occur and not be detected.
The Company’s information systems may experience an interruption in service or breach in security.
The Company relies heavily on communications and information systems to conduct the Company’s business. Any failure, interruption or breach of security of these systems could result in failures or disruptions in the Company’s customer relationship management, transaction processing systems and various accounting and data management systems. While it has policies and procedures designed to prevent and/or limit the effect of any failure, interruption or security breach of the Company’s communication and information systems, there can be no assurance that any such failures, interruptions or security breaches will not occur, or, if they do occur, they will be adequately addressed on a timely basis. The occurrence of failures, interruptions or security breaches of the Company’s communication and information systems could damage the Company’s reputation, result in a loss of customer business, subject us to additional regulatory scrutiny, or expose us to civil litigation and possible financial liability, any of which could have a material adverse effect on its financial condition and results of operations.
20
Table of Contents
Changes in accounting standards and management’s selection of accounting methods, including assumptions and estimates, could materially impact our financial statements.
From time to time the SEC and the Financial Accounting Standards Board (“FASB”) change the financial accounting and reporting standards that govern the preparation of the Company’s financial statements. These changes can be hard to predict and can materially impact how the Company records and reports its financial condition and results of operations. In some cases, the Company could be required to apply a new or revised standard retroactively, resulting in changes to previously reported financial results, or a cumulative charge to retained earnings. In addition, management is required to use certain assumptions and estimates in preparing our financial statements, including determining the fair value of certain assets and liabilities, among other items. If the assumptions or estimates are incorrect, the Company may experience unexpected material consequences.
We may need to raise additional capital that may not be available to us.
As a result of our continuing losses, we may need to raise additional capital in the future if we continue to incur additional losses or due to regulatory mandates. The ability to raise additional capital, if needed, will depend in part on conditions in the capital markets at that time, which are outside our control, and on our financial performance. Accordingly, additional capital may not be raised, if and when needed, on terms acceptable to us, or at all. If we cannot raise additional capital when needed, our ability to maintain our capital ratios could be materially impaired, and we could face additional regulatory challenges.
Liquidity needs could adversely affect our results of operations and financial condition.
We rely on dividends from the Bank as our primary source of funds. The primary sources of funds of the Bank are client deposits and loan repayments. While scheduled loan repayments are a relatively stable source of funds, they are subject to the ability of borrowers to repay the loans. The ability of borrowers to repay loans can be adversely affected by a number of factors, including changes in economic conditions, adverse trends or events affecting business industry groups, reductions in real estate values or markets, business closings or lay-offs, inclement weather, natural disasters and international instability. Additionally, deposit levels may be affected by a number of factors, including rates paid by competitors, general interest rate levels, regulatory capital requirements, returns available to clients on alternative investments and general economic conditions. Accordingly, we may be required from time to time to rely on secondary sources of liquidity to meet withdrawal demands or otherwise fund operations. Such sources include Federal Home Loan Bank advances, sales of securities and loans, and federal funds lines of credit from correspondent banks, as well as out-of-market time deposits. While we believe that these sources are currently adequate, there can be no assurance they will be sufficient to meet future liquidity demands.
Lack of consumer confidence in financial institutions may decrease our level of deposits.
Our level of deposits may be affected by lack of consumer confidence in financial institutions, which have caused fewer depositors to be willing to maintain deposits that are not FDIC insured accounts. This may cause depositors to withdraw deposits and place them in other institutions or to invest uninsured funds in investments perceived as being more secure, such as securities issued by the Treasury. These consumer preferences may force us to pay higher interest rates to retain deposits and may constrain liquidity as we seek to meet funding needs caused by reduced deposit levels.
We have goodwill that may become impaired, and thus result in a charge against earnings.
We are required by U.S. generally accepted accounting principles to test goodwill for impairment at least annually. Testing for impairment of goodwill involves the identification of reporting units and the estimation of fair values. The estimation of fair values involves a high degree of judgment and subjectivity in the assumptions used. As of December 31, 2010, we had $16.0 million of goodwill related to branch acquisitions in 2003 and 2008. To date, we have not recorded any impairment charges on our goodwill, however there is no guarantee that we may not be forced to recognize impairment charges in the future as operating and economic conditions change.
A substantial decline in the value of our Federal Home Loan Bank of Atlanta common stock may result in an other-than temporary impairment charge.
We are a member of the Federal Home Loan Bank of Atlanta, or FHLB, which enables us to borrow funds under the Federal
21
Table of Contents
Home Loan Bank advance program. As a FHLB member, we are required to own FHLB common stock, the amount of which increases with the level of our FHLB borrowings. The carrying value of our FHLB common stock was $8.3 million as of December 31, 2010. The FHLB has suspended daily repurchases of FHLB common stock, which adversely affects the liquidity of these shares. If the financial condition of FHLB deteriorates further, there is a risk that our investment could be deemed other-than-temporarily impaired at some time in the future.
Other-than-temporary impairment (OTTI) could reduce our earnings.
We may be required to record other-than-temporary impairment charges on our investment securities if they suffer a decline in value that is considered other-than-temporary. Numerous factors, including lack of liquidity for re-sales of certain investment securities, absence of reliable pricing information for certain investment securities, adverse changes in business climate, adverse actions by regulators, or unanticipated changes in the competitive environment could have a negative effect on our securities portfolio in future periods. An other-than-temporary impairment charge could have a material adverse effect on our results of operations and financial condition.
We may be parties to certain legal proceedings that may impact our earnings.
We face significant legal risks in our businesses, and the volume of claims and amount of damages and penalties claimed in litigation and regulatory proceedings against financial institutions remain high. Substantial legal liability or significant regulatory action against us could have material adverse financial impact or cause significant reputational risk to us, which in turn could seriously harm our business prospects.
| Item 1B. | Unresolved Staff Comments |
None.
| Item 2. | Properties |
Our principal executive offices are located at 330 Hospital Road, Tappahannock, Virginia 22560 where we opened a 15,632 square foot corporate headquarters and operations center in July 2003. In December 2010, we consolidated our Aylett office into our Central Garage office. At the end of 2010, the Company owned twenty-four full service branch buildings including the land on which eighteen of those buildings are located and two remote drive-in facilities. The Company currently has long-term leases for six of its branches. Five of the leases are for the branch buildings and one lease is for the land on which the Company owned branch is located. All leases are under long-term non-cancelable operating lease agreements with renewal options, at total annual rentals of approximately $486 thousand as of December 31, 2010. The counties of Gloucester, Northumberland and Middlesex are each the home to three of our branches. Essex County is home to two branch offices. In addition, Essex County houses the Bank’s loan administration center and the Company’s corporate/operations center. Hanover County houses four branch offices while Caroline, Henrico, King William County, Lancaster, New Kent, Southampton, Surry, Sussex Counties and Colonial Heights each have one full service branch office. Southampton County and Sussex County also each have a stand-alone drive-in/automated teller machine location.
On February 26, 2009, we utilized a Section 1031 “like kind” exchange transaction to transfer the 5.5 acre parcel of unimproved land purchased in 2008 on Walnut Grove Road in Hanover County for a 5.5 acre parcel of unimproved land in the Bell Creek business park in anticipation of future growth needs. On September 15, 2009, we purchased an additional 2 acres of land adjacent to the Bell Creek property. In November 2009, we purchased 3 business condo units (2,400 square feet per unit) at Atlee Commons in Hanover County. In June 2010, we purchased 4 more business condo units with the same specifications at the same Hanover County location. All of these properties were purchased in anticipation of future space needs and to lower or eliminate current rental costs. In early 2011, land was purchased in Colonial Heights with the intent to build and relocate our existing rented branch to this owned property at some point in the future. No new branches were built or purchased in 2009 or 2010.
The Company believes its facilities are in good operating condition, are suitable and adequate for its operational needs and are adequately insured.
See Item 13. “Certain Relationships and Related Transactions, and Director Independence” and Item 8. “Financial Statements and Supplementary Data,” under the heading “Note 22: Related Party Leases” of this Form 10-K for more information on the
22
Table of Contents
Company’s related party leases.
| Item 3. | Legal Proceedings |
The Company is not a party to, nor is any of its property the subject of, any material pending legal proceedings incidental to its businesses other than those arising in the ordinary course of business. Although the amount of any ultimate liability with respect to such matters cannot be determined, in the opinion of management, any such liability from legal proceedings incidental to the Company’s business will not have a material adverse effect on the consolidated financial position or results of operations of the Company.
| Item 4. | (Removed and Reserved) |
Executive Officers of the Registrant
Following are the persons who are currently executive officers of the Company, their ages as of December 31, 2010, their current titles and positions held during the last five years:
Joe A. Shearin, 54, joined the Company in 2001 as the President and Chief Executive Officer of Southside Bank. Mr. Shearin served in that capacity until 2006 when he became President and Chief Executive Officer of the Bank. Mr. Shearin became the President and Chief Executive Officer of the Company in 2002.
Joseph H. James, Jr., 55, joined the Company in 2000 as Vice President and Operations Officer. From April 2002 to November 2002, Mr. James served as Vice President and Chief Operations Officer. From November 2002 through April 2006, Mr. James served as Senior Vice President and Chief Operations Officer. From April 2006 to January 2009, Mr. James served as an Executive Vice President of the Bank and the Chief Operations Officer of the Company. In January 2009, Mr. James became our Senior Executive Vice President and Chief Operating Officer.
Douglas C. Haskett, II, 42, joined the Company in April 2010 as Executive Vice President and Chief Financial Officer. From March 2008 until joining the Company, Mr. Haskett served as Senior Vice President and Chief Financial Officer of Farmers Bank. From August 2004 until March 2008, Mr. Haskett served as Senior Vice President of Alliance Bank and Chief Operating Officer of Alliance Bank Mortgage Division.
James S. Thomas, 56, joined the Company in 2003 as Senior Vice President and Retail Banking Manager of Southside Bank. In 2005, he became Executive Vice President and Chief Operating Officer of Southside Bank. In April 2006, Mr. Thomas became Executive Vice President of Retail Banking for the Bank. In June 2007, Mr. Thomas was promoted to Executive Vice President and Chief Credit Officer of the Bank.
Douglas R. Taylor, 54, joined the Company in April 2010 as Executive Vice President and Chief Risk Officer. From December 2004 until joining the Company, Mr. Taylor served as Director of Risk Management for First Market Bank. From October 2001 until December 2004, Mr. Taylor served as Chief Administrative Officer of Citizens Bank and Trust.
Part II
| Item 5. | Market for Registrant’s Common Equity, Related Stockholder Matters and Issuer Purchases of Equity Securities |
Common Stock Performance
The Company’s common stock is traded on the NASDAQ Global Market under the symbol “EVBS.” As of March 24, 2011, there were approximately 2,857 shareholders of record. As of that date, the closing price of our common stock on the NASDAQ Global Market was $3.50. Set forth below is the high and low sales prices as reported by the NASDAQ Stock Market, along with the dividends that were paid quarterly in 2010 and 2009.
23
Table of Contents
| 2010 | 2009 | |||||||||||||||||||||||
| Quarter |
High | Low | Dividends | High | Low | Dividends | ||||||||||||||||||
| First |
$ | 8.19 | $ | 7.00 | $ | 0.05 | $ | 11.57 | $ | 7.44 | $ | 0.16 | ||||||||||||
| Second |
8.09 | 6.34 | 0.05 | 9.55 | 6.94 | 0.05 | ||||||||||||||||||
| Third |
6.87 | 2.94 | 0.01 | 9.45 | 7.45 | 0.05 | ||||||||||||||||||
| Fourth |
4.47 | 3.36 | 0.01 | 8.25 | 6.75 | 0.05 | ||||||||||||||||||
Stock Performance Graph
The graph below presents five-year cumulative total return comparisons through December 31, 2010, in stock price appreciation and dividends for the Company’s common stock, the NASDAQ Composite and the SNL $1 billion - $5 billion Bank Index. Returns assume an initial investment of $100 at the market close on December 31, 2005 and reinvestment of dividends. Values as of each year end of the $100 initial investment are shown in the table and graph below.
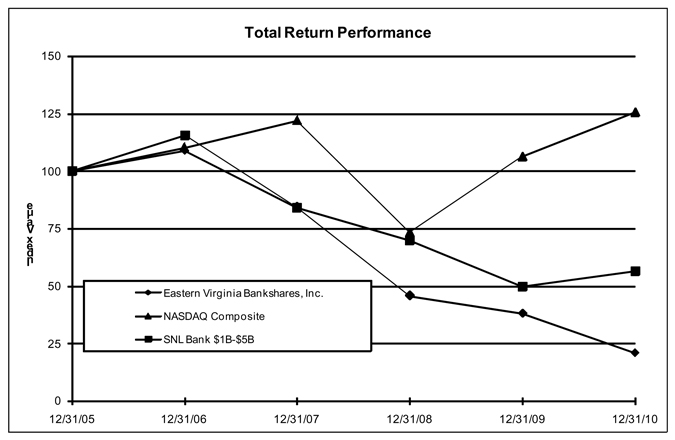
| Period Ending | ||||||||||||||||||||||||
| Index |
12/31/05 | 12/31/06 | 12/31/07 | 12/31/08 | 12/31/09 | 12/31/10 | ||||||||||||||||||
| Eastern Virginia Bankshares, Inc. |
100.00 | 109.02 | 84.44 | 45.80 | 38.18 | 20.97 | ||||||||||||||||||
| NASDAQ Composite |
100.00 | 110.39 | 122.15 | 73.32 | 106.57 | 125.91 | ||||||||||||||||||
| SNL Bank $1B-$5B |
100.00 | 115.72 | 84.29 | 69.91 | 50.11 | 56.81 | ||||||||||||||||||
Dividend Reinvestment and Stock Purchase Plan
The Company has a Dividend Reinvestment and Stock Purchase Plan (the “DRIP”), which provides for the automatic conversion of dividends into common stock for enrolled shareholders. This conversion is based on the average closing price of the Company’s common stock for the three trading days prior to each dividend record date. The DRIP also permits participants
24
Table of Contents
to make optional cash payments of up to $5 thousand per shareholder per calendar quarter for the purchase of additional shares of the Company’s common stock. The shares are issued at market value without incurring brokerage commissions.
Dividend Information
The ability of the Company to pay dividends depends upon the amount of dividends declared by the Bank, which is limited by regulatory restrictions on the Bank’s ability to pay dividends. The Company has historically paid a quarterly dividend, which was suspended beginning with the Company’s first quarter of 2011. For further information regarding payment of dividends, including restrictions stemming from the Company’s participation in the Capital Purchase Program as well as the Company entering into a Written Agreement, refer to Item 1. “Business,” under the heading “Limits on Dividends” and Item 8. “Financial Statements and Supplementary Data,” under the heading “Note 16: Dividend Limitations” of this Form 10-K.
Purchases of Equity Securities by the Issuer
In January 2001, the Company announced a stock repurchase program by which management was authorized to repurchase up to 300,000 shares of the Company’s common stock. This plan was amended in 2003 and the number of shares by which management is authorized to repurchase is up to 5% of the outstanding shares of the Company’s common stock on January 1 of each year. There is no stated expiration date for the program. During 2010 and 2009, the Company did not repurchase any of its common stock. During 2008, the Company repurchased 70,545 shares of its common stock at an average price of $17.53 per share.
In connection with the Company’s sale to the Treasury of its Series A Preferred Stock under the Capital Purchase Program, as previously described, there are certain limitations on the Company’s ability to purchase its common stock prior to the earlier of January 9, 2012 or the date on which Treasury no longer holds any of the Series A Preferred Stock. Prior to such time, the Company generally may not purchase any of its common stock without the consent of the Treasury.
In connection with the Company entering into a written agreement with the Reserve Board and the Bureau, as previously described, the Company is subject to additional limitations and regulatory restrictions and may not purchase or redeem shares of its stock without prior regulatory approval.
| Item 6. | Selected Financial Data |
25
Table of Contents
| SELECTED FINANCIAL DATA |
||||||||||||||||||||
| (dollars in thousands, except per share data) |
||||||||||||||||||||
| Year Ended December 31, | ||||||||||||||||||||
| 2010 | 2009 | 2008 | 2007 | 2006 | ||||||||||||||||
| Operating Statement Data: |
||||||||||||||||||||
| Interest and dividend income |
$ | 53,510 | $ | 56,727 | $ | 59,386 | $ | 58,201 | $ | 51,016 | ||||||||||
| Interest expense |
17,722 | 24,050 | 26,809 | 24,962 | 19,444 | |||||||||||||||
| Net interest income |
35,788 | 32,677 | 32,577 | 33,239 | 31,572 | |||||||||||||||
| Provision for loan losses |
28,930 | 4,200 | 4,025 | 1,238 | 725 | |||||||||||||||
| Net interest income after provision for loan losses |
6,858 | 28,477 | 28,552 | 32,001 | 30,847 | |||||||||||||||
| Noninterest income (loss) |
9,992 | (12,489 | ) | 2,970 | 6,110 | 5,165 | ||||||||||||||
| Noninterest expense |
34,571 | 30,648 | 27,945 | 25,874 | 25,819 | |||||||||||||||
| Income (loss) before income taxes |
(17,721 | ) | (14,660 | ) | 3,577 | 12,237 | 10,193 | |||||||||||||
| Income tax expense (benefit) |
(6,962 | ) | (5,856 | ) | 506 | 3,483 | 2,956 | |||||||||||||
| Net income (loss) |
(10,759 | ) | (8,804 | ) | 3,071 | 8,754 | 7,237 | |||||||||||||
| Effective dividend on preferred stock |
1,492 | 1,459 | — | — | — | |||||||||||||||
| Net income (loss) available to common shareholders |
$ | (12,251 | ) | $ | (10,263 | ) | $ | 3,071 | $ | 8,754 | $ | 7,237 | ||||||||
| Per Share Data: |
||||||||||||||||||||
| Diluted income (loss) per common share |
$ | (2.05 | ) | $ | (1.73 | ) | $ | 0.52 | $ | 1.45 | $ | 1.45 | ||||||||
| Dividends per share, common |
0.12 | 0.31 | 0.64 | 0.64 | 0.63 | |||||||||||||||
| Book value per common share |
11.28 | 13.67 | 13.23 | 15.30 | 14.43 | |||||||||||||||
| Balance Sheet Data: |
||||||||||||||||||||
| Assets |
$ | 1,119,330 | $ | 1,126,283 | $ | 1,051,363 | $ | 926,711 | $ | 851,398 | ||||||||||
| Loans, net of unearned income |
774,774 | 853,063 | 819,266 | 708,817 | 650,492 | |||||||||||||||
| Securities |
256,464 | 178,383 | 161,879 | 160,865 | 127,167 | |||||||||||||||
| Deposits |
868,146 | 856,640 | 817,489 | 675,957 | 656,690 | |||||||||||||||
| Total capital |
91,418 | 105,198 | 78,029 | 90,769 | 87,807 | |||||||||||||||
| Shareholders’ equity |
67,418 | 81,198 | 78,029 | 90,769 | 87,807 | |||||||||||||||
| Average shares outstanding - basic |
5,978 | 5,920 | 5,889 | 6,035 | 4,985 | |||||||||||||||
| Average shares outstanding - diluted |
5,978 | 5,920 | 5,890 | 6,040 | 4,992 | |||||||||||||||
| Performance Ratios: |
||||||||||||||||||||
| Return on average assets |
-1.11 | % | -0.93 | % | 0.31 | % | 0.99 | % | 0.91 | % | ||||||||||
| Return on average common equity |
-15.36 | % | -12.32 | % | 3.55 | % | 9.75 | % | 11.10 | % | ||||||||||
| Dividend payout ratio |
n/a | n/a | 123.02 | % | 44.19 | % | 42.81 | % | ||||||||||||
| Efficiency ratio (1) |
79.89 | % | 76.84 | % | 70.15 | % | 64.75 | % | 69.18 | % | ||||||||||
| Average equity to average assets |
9.40 | % | 9.23 | % | 8.69 | % | 10.14 | % | 10.61 | % | ||||||||||
| Asset Quality Ratios: |
||||||||||||||||||||
| Allowance for loan losses to period end loans |
3.26 | % | 1.42 | % | 1.29 | % | 1.11 | % | 1.08 | % | ||||||||||
| Allowance for loan losses to nonaccrual loans |
97.80 | % | 62.91 | % | 77.66 | % | 544.47 | % | 503.52 | % | ||||||||||
| Nonperforming assets to period end loans and other real estate owned |
5.00 | % | 3.10 | % | 2.04 | % | 0.40 | % | 0.45 | % | ||||||||||
| Net charge-offs to average loans |
1.89 | % | 0.31 | % | 0.24 | % | 0.06 | % | 0.04 | % | ||||||||||
| Capital Ratios: |
||||||||||||||||||||
| Leverage capital ratio |
7.38 | % | 9.08 | % | 8.62 | % | 10.80 | % | 11.57 | % | ||||||||||
| Tier 1 risk-based capital |
10.51 | % | 11.60 | % | 10.51 | % | 13.82 | % | 15.04 | % | ||||||||||
| Total risk-based capital |
11.70 | % | 12.29 | % | 11.56 | % | 14.75 | % | 16.15 | % | ||||||||||
| Note: (1) | Efficiency ratio is computed by dividing noninterest expense by the sum of net interest income on a tax equivalent basis and noninterest income, net of gains or losses. |
26
Table of Contents
| Item 7. | Management’s Discussion and Analysis of Financial Condition and Results of Operation |
This commentary provides an overview of the Company’s financial condition as of December 31, 2010 and 2009, and changes in financial condition and results of operations for the years 2008 through 2010. This section of the Form 10-K should be read in conjunction with the Consolidated Financial Statements and related Notes thereto included under Item 8. “Financial Statements and Supplementary Data” of this Form 10-K.
Forward Looking Statements
Certain statements contained in this Annual Report on Form 10-K that are not historical facts may constitute “forward-looking statements” within the meaning of Section 27A of the Securities Act of 1933, as amended, and Section 21E of the Securities Exchange Act of 1934, as amended. In addition, certain statements may be contained in the Company’s future filings with the SEC, in press releases, and in oral and written statements made by or with the approval of the Company that are not statements of historical fact and constitute forward-looking statements within the meaning of the Act. Examples of forward-looking statements include, but are not limited to: (i) projections of revenues, expenses, income or loss, earnings or loss per share, the payment or nonpayment of dividends, capital structure and other financial items; (ii) statements of plans, objectives and expectations of the Company or its management or Board of Directors, including those relating to products or services; (iii) statements of future economic performance; (iv) statements regarding the impact of the Written Agreement on our financial condition, operations and capital strategies; (v) statements of management’s expectations regarding future trends in interest rates, real estate values, and economic conditions generally and in the Company’s markets; and (vi) statements of assumptions underlying such statements. Words such as “believes”, “anticipates,” “expects,” “intends,” “targeted,” “continue,” “remain,” “will,” “should,” “may” and other similar expressions are intended to identify forward-looking statements but are not the exclusive means of identifying such statements.
Forward-looking statements involve risks and uncertainties that may cause actual results to differ materially from those in such statements. Factors that could cause actual results to differ from those discussed in the forward-looking statements include, but are not limited to:
| • | our ability to assess, manage and improve our asset quality; |
| • | the strength of the economy in our target market area, as well as general economic, market, or business factors; |
| • | changes in the quality or composition of our loan or investment portfolios, including adverse developments in borrower industries, decline in real estate values in our markets, or in the repayment ability of individual borrowers or issuers; |
| • | the impact of government intervention in the banking business; |
| • | an insufficient allowance for loan losses; |
| • | our ability to meet the capital expectations of our regulatory agencies; |
| • | changes in laws, regulations and the policies of federal or state regulators and agencies; |
| • | changes in the interest rates affecting our deposits and our loans; |
| • | the loss of any of our key employees; |
| • | changes in our competitive position, competitive actions by other financial institutions and the competitive nature of the financial services industry and our ability to compete effectively against other financial institutions in our banking markets; |
| • | our potential growth, including our entrance or expansion into new markets, the opportunities that may be presented to and pursued by us and the need for sufficient capital to support that growth; |
| • | changes in government monetary policy, interest rates, deposit flow, the cost of funds, and demand for loan products and financial services; |
| • | our ability to maintain internal control over financial reporting; |
| • | our ability to raise capital as needed by our business; |
| • | our reliance on secondary sources, such as Federal Home Loan Bank advances, sales of securities and loans, federal funds lines of credit from correspondent banks and out-of-market time deposits, to meet our liquidity needs; |
| • | our ability to comply with the Written Agreement, which requires us to designate a significant amount of resources to complying with the agreement and may have a material adverse effect on our operations and the value of our securities; and |
| • | other circumstances, many of which are beyond our control. |
27
Table of Contents
Forward-looking statements speak only as of the date on which such statements are made. The Company undertakes no obligation to update any forward-looking statement to reflect events or circumstances after the date on which such statement is made, or to reflect the occurrence of unanticipated events. In addition, as evidenced by a significant increase in our loan losses, a continuation of the recent distress in significant portions of the national and local economy and global financial markets, particularly if it worsens, could continue to negatively impact our performance, both directly by affecting our revenues and the value of our assets and liabilities, and indirectly by affecting our counterparties and the economy generally. Dramatic declines in the housing market in the past three years have resulted in significant write-downs of asset values by financial institutions in the United States, including by the Company. Concerns about the stability of the U.S. financial markets generally have reduced the availability of funding to certain financial institutions, leading to a tightening of credit, and a reduction of business activity. In addition, our business and financial performance could be impacted as the financial industry restructures in the current environment, both by changes in the creditworthiness and performance of our counterparties and by changes in the competitive landscape.
The reader should refer to risks detailed under Item 1A. “Risk Factors” included above in this Form 10-K and in our periodic and current reports filed with the Securities and Exchange Commission for specific factors that could cause our actual results to be significantly different from those expressed or implied by our forward-looking statements.
Critical Accounting Policies
The preparation of financial statements requires us to make estimates and assumptions. Those accounting policies with the greatest uncertainty and that require our most difficult, subjective or complex judgments affecting the application of these policies, and the likelihood that materially different amounts would be reported under different conditions, or using different assumptions, are described below.
Allowance for Loan Losses
The Company establishes the allowance for loan losses through charges to earnings in the form of a provision for loan losses. Loan losses are charged against the allowance when we believe that the collection of the principal is unlikely. Subsequent recoveries of losses previously charged against the allowance are credited to the allowance. The allowance represents an amount that, in our judgment, will be adequate to absorb any losses on existing loans that may become uncollectible. Our judgment in determining the level of the allowance is based on evaluations of the collectability of loans while taking into consideration such factors as trends in delinquencies and charge-offs, changes in the nature and volume of the loan portfolio, current economic conditions that may affect a borrower’s ability to repay and the value of collateral, overall portfolio quality and review of specific potential losses. This evaluation is inherently subjective because it requires estimates that are susceptible to significant revision as more information becomes available. For more information see the section titled “Asset Quality” within Item 7.
Impairment of Loans
The Company considers a loan impaired when, based on current information and events, it is probable that the Company will be unable to collect the scheduled payments of principal and interest when due, according to the contractual terms of the loan agreement. The Company does not consider a loan impaired during a period of insignificant payment shortfalls if we expect the ultimate collection of all amounts due. Impairment is measured on a loan by loan basis for real estate (including multifamily residential, construction, farmland and non-farm, non-residential) and commercial loans by either the present value of expected future cash flows discounted at the loan’s effective interest rate, the loan’s obtainable market price, or the fair value of the collateral if the loan is collateral dependent. Large groups of smaller balance homogeneous loans, representing consumer, one to four family residential first and seconds and home equity lines, are collectively evaluated for impairment. We maintain a valuation allowance to the extent that the measure of the impaired loan is less than the recorded investment. Troubled debt restructurings (“TDRs”) are also considered impaired loans. A TDR occurs when the Company, for economic or legal reasons related to the borrower’s financial condition, grants a concession to the borrower that it would not otherwise consider. For more information see the section titled “Asset Quality” within Item 7.
Impairment of Securities
Impairment of securities occurs when the fair value of a security is less than its amortized cost. For debt securities, impairment is considered other-than-temporary and recognized in its entirety in net income if either (i) we intend to sell the security or (ii) it
28
Table of Contents
is more likely than not that we will be required to sell the security before recovery of its amortized cost basis. If, however, we do not intend to sell the security and it is not more likely than not that we will be required to sell the security before recovery, we must determine what portion of the impairment is attributable to a credit loss, which occurs when the amortized cost basis of the security exceeds the present value of the cash flows expected to be collected from the security. If there is no credit loss, there is no other-than-temporary impairment. If there is a credit loss, other-than-temporary impairment exists, and the credit loss must be recognized in net income and the remaining portion of impairment must be recognized in other comprehensive income. For equity securities, impairment is considered to be other-than-temporary based on our ability and intent to hold the investment until a recovery of fair value. Other-than-temporary impairment of an equity security results in a write-down that must be included in net income. We regularly review each investment security for other-than-temporary impairment based on criteria that includes the extent to which cost exceeds market price, the duration of that market decline, the financial health of and specific prospects for the issuer, our best estimate of the present value of cash flows expected to be collected from debt securities, our intention with regard to holding the security to maturity and the likelihood that we would be required to sell the security before recovery.
Other Real Estate Owned
Real estate acquired through, or in lieu of, foreclosure is held for sale and is stated at the lower of cost or estimated fair market value of the property, less estimated disposal costs, if any. Any excess of cost over the estimated fair market value at the time of acquisition is charged to the allowance for loan losses. The estimated fair market value is reviewed periodically by management and any write-downs are charged against current earnings.
Goodwill
Goodwill is not amortized but is subject to impairment tests on at least an annual basis or earlier whenever an event occurs indicating that goodwill may be impaired. In assessing the recoverability of the Company’s goodwill, all of which was recognized in connection with the acquisition of branches in 2003 and 2008, we must make assumptions in order to determine the fair value of the respective assets. The Company completed the annual goodwill impairment test during the fourth quarter of 2010 and determined there was no impairment to be recognized in 2010. If the underlying estimates and related assumptions change in the future, the Company may be required to record impairment charges.
Retirement Plan
The Company has a defined benefit pension plan. Effective January 28, 2008, the Company took action to freeze the plan with no additional contributions for a majority of participants. Employees age 55 or greater or with 10 years of credited service were grandfathered in the plan. No additional participants have been added to the plan. Effective February 28, 2011, the Company took action to again freeze the plan with no additional contributions for grandfathered participants. Benefits for all participants will remain frozen in the plan until such time as further action occurs. Plan assets, which consist primarily of mutual funds invested in marketable equity securities and corporate and government fixed income securities, are valued using market quotations. The Company’s actuary determines plan obligations and annual pension expense using a number of key assumptions. Key assumptions may include the discount rate, the estimated return on plan assets and the anticipated rate of compensation increases. Changes in these assumptions in the future, if any, or in the method under which benefits are calculated may impact pension assets, liabilities or expense.
Accounting for Income Taxes
In the ordinary course of business, there are transactions and calculations for which the ultimate tax outcomes are uncertain. In addition, the Company’s tax returns are subject to audit by various tax authorities. Although we believe that the estimates are reasonable, no assurance can be given that the final tax outcome will not be materially different than that which is reflected in the income tax provision and accrual.
For further information concerning accounting policies, refer to Item 8. “Financial Statements and Supplementary Data,” under the heading “Note 1. Summary of Significant Accounting Policies.”
Executive Overview
The Company is committed to delivering strong long-term earnings using a prudent allocation of capital, in business lines where
29
Table of Contents
we have demonstrated the ability to compete successfully. Over the past three years, our Company has struggled with the challenging economic environment and has focused on credit quality initiatives to position our Company for growth once the economic climate improves. In 2008 and 2009, this focus was on our investment securities portfolio, including Fannie Mae and Freddie Mac preferred equity investments and trust preferred securities that were subject to other-than-temporary impairment and have been subsequently written off. While those issues have been resolved, the challenging economic environment has significantly impacted the markets we serve and many of our customers have had difficulty meeting their financial obligations. The challenging economic environment is impacting the credit quality of the loan portfolios at the vast majority of community banks, as the economic environment has negatively impacted the credit quality of our loan portfolio, and generally credit quality is not expected to show broad-based improvement until all levels of the economy experience a resurgence of positive cash flows.
During 2010, the Company saw a significant increase in the number of loans that were negatively impacted by continued economic conditions within our markets. The Company continues to see declining real estate values in our markets and increased stress on our customer’s ability to pay their loans as agreed due to high unemployment levels. As a result, during 2010 the Company has experienced increases to our nonperforming assets, to which we have responded by aggressively charging-off loans and increasing our allowance for potential future loan losses. While the elevated level of provision for loan losses expense recorded for 2010 negatively impacts our operating results, the Company believes these elevated provisions are necessary as the economic growth seen in some national statistics has not been realized in the local markets we serve. The Company is proactively managing our problem assets and has allocated increased resources internally to help expedite satisfactory resolutions of problem assets. Despite the losses we have incurred over the past two years, the Company and the Bank remain “well-capitalized” under all regulatory definitions and feel the enhanced level of the allowance for loan losses prepares us to aggressively resolve our credit issues.
The primary driver for the Company’s 2010 results was the need to significantly increase our allowance for loan losses as a result of continued deterioration of credit quality in our loan portfolio. The Company believes the steps we have taken during 2010 will significantly enhance the long term credit quality of our Company and properly position us to deliver stronger earnings as we move forward once the economic climate improves. As part of our overall strategy to proactively manage our Company through the challenging economic conditions that continue to affect us, during the third quarter of 2010 the Company successfully executed the sale of $27.8 million in 1-4 residential mortgage loans on a servicing retained basis. This sale had several benefits for our Company. First, the gain generated from the sale of these loans will allow us to more aggressively work through our more problematic loans. Second, it demonstrates that the Company can use our loan portfolio as a source of liquidity, which is critical in the difficult economic environment. Lastly, it reduced our overall exposure to 1-4 residential mortgage loans. Our senior management and board continue to evaluate various strategies that we believe will best position our Company for long-term success.
During 2010, the Company significantly reduced and ultimately suspended the payment of its quarterly common stock dividend beginning with the first quarter of 2011. Given the prolonged economic downturn and the impact it has had on the Company’s level of profitability, the Company’s Board of Directors determined that it was prudent to suspend these payments. With the significant challenges facing the banking industry, maintaining the Company’s “well-capitalized” status is absolutely critical as we prepare our company for growth once economic conditions improve. In conjunction with this, the Company also began deferring its regular quarterly cash dividend with respect to its Series A Fixed Rate Cumulative Perpetual Preferred Stock which the Company issued to the United States Department of Treasury in connection with the Company’s participation in the Treasury’s Capital Purchase Program in January 2009. As economic conditions improve, and as the Company is able to generate earnings to support its current and future capital needs, the Company plans to restore its common and preferred stock dividends.
On February 17, 2011, the Company and EVB entered into a written agreement with the Reserve Bank and the Bureau. The purpose of this agreement is to formally document the common goal of the Company, EVB and the regulatory agencies to maintain the financial soundness of the Company and the Bank. This agreement contains many of the steps that the Company has already initiated during 2010 to address our deteriorating asset quality and associated challenges brought on during the economic recession. The agreement addresses improving oversight and administration of the Company’s operations, including improving credit risk management processes, lending and credit administration processes, the quality of the loan and asset portfolios and processes to manage the quality of these portfolios, and the balance of and processes related to loan loss reserves. The directors of the Company and the Bank have recognized and unanimously agree with the common goal of financial soundness represented by the agreement and have confirmed the intent of the directors and executive management to diligently seek to comply with all requirements of the written agreement. The Company is pleased with the continued support of the
30
Table of Contents
regulatory agencies and looks forward to the successful results of our actions. For further information concerning the written agreement, refer to Item 1. “Business,” under the heading “Regulation and Supervision.”
For the year ended December 31, 2010, the following key points were significant factors in our reported results:
| • | Provision expense for the allowance for loan losses of $28.9 million to fund possible losses in the loan portfolio. |
| • | Gain on sale of loans of $1.3 million. |
| • | Net charge-offs of $15.8 million to write off uncollectible balances on nonperforming assets. |
| • | Gain on the sale of available for sale securities of $2.5 million resulting from adjustments in the composition of the investment portfolio. |
| • | Improvement in net interest income by $3.1 million over 2009. |
| • | Impairment losses of $928 thousand related to valuation adjustments on other real estate owned. |
| • | Expenses related to collection, repossession and other real estate owned of $2.1 million. |
For the years ended December 31, 2010, 2009 and 2008, the reported net income (loss) of ($10.8) million, ($8.8) million and $3.1 million, respectively equate to the following performance metrics:
| • | On available common income, Annualized Return on Average Assets (ROA) of (1.11%) for the year ended December 31, 2010 which compares to ROA of (0.93%) for the year ended December 31, 2009 and ROA of 0.31% for the year ended December 31, 2008. |
| • | On available common income, Annualized Return on Average Shareholder’s Equity (ROE) of (15.36%) for the year ended December 31, 2010 which compares to ROE of (12.32%) for the year ended December 31, 2009 and ROE of 3.55% for the year ended December 31, 2008. |
| • | On a per share basis, the diluted and basic earnings (loss) per common share (EPS) is ($2.05) for the year ended December 31, 2010 which compares to an EPS of ($1.73) for the year ended December 31, 2009 and an EPS of $0.52 for the year ended December 31, 2008. |
The Company is not satisfied with these financial results and continues to focus on credit quality initiatives that we believe will ultimately result in an improvement in our asset quality and allow us to focus greater resources on growing our franchise and delivering financial results more consistent with our pre-recession performance. As detailed later in this Item 7 under the caption “Asset Quality”, the Company continues to work on the timely resolution of our nonperforming assets but expects that additional charge-offs will be likely. However, the Company believes that the loan loss reserves set aside during 2010 should be sufficient to cover our known credit issues under current economic conditions. Any further deterioration of economic conditions or credit quality could possibly require the adjustment of our provision for loan losses to reserve against additional charge-offs.
Results of Operations
The table below lists our quarterly performance for the years ended December 31, 2010 and 2009.
31
Table of Contents
TABLE 1: SUMMARY OF FINANCIAL RESULTS BY QUARTER
(dollars in thousands)
| Three Months Ended | Three Months Ended | |||||||||||||||||||||||||||||||
| 2010 | 2009 | |||||||||||||||||||||||||||||||
| Dec. 31 | Sep. 30 | June 30 | Mar. 31 | Dec. 31 | Sep. 30 | June 30 | Mar. 31 | |||||||||||||||||||||||||
| Interest and dividend income |
$ | 12,888 | $ | 13,568 | $ | 13,394 | $ | 13,660 | $ | 14,091 | $ | 14,047 | $ | 14,656 | $ | 13,933 | ||||||||||||||||
| Interest expense |
4,197 | 4,428 | 4,447 | 4,650 | 5,227 | 5,990 | 6,464 | 6,369 | ||||||||||||||||||||||||
| Net interest income |
8,691 | 9,140 | 8,947 | 9,010 | 8,864 | 8,057 | 8,192 | 7,564 | ||||||||||||||||||||||||
| Provision for loan losses |
12,905 | 1,550 | 12,625 | 1,850 | 1,700 | 850 | 750 | 900 | ||||||||||||||||||||||||
| Net interest income (loss) after provision for loan losses |
(4,214 | ) | 7,590 | (3,678 | ) | 7,160 | 7,164 | 7,207 | 7,442 | 6,664 | ||||||||||||||||||||||
| Noninterest income (loss) |
1,225 | 3,527 | 3,116 | 2,124 | 1,423 | (13,200 | ) | (2,269 | ) | 1,557 | ||||||||||||||||||||||
| Noninterest expenses |
8,916 | 8,999 | 8,771 | 7,885 | 7,903 | 7,330 | 8,036 | 7,379 | ||||||||||||||||||||||||
| Income (loss) before income taxes |
(11,905 | ) | 2,118 | (9,333 | ) | 1,399 | 684 | (13,323 | ) | (2,863 | ) | 842 | ||||||||||||||||||||
| Income tax expense (benefit) |
(4,193 | ) | 532 | (3,366 | ) | 65 | (78 | ) | (4,805 | ) | (1,092 | ) | 119 | |||||||||||||||||||
| Net income (loss) |
$ | (7,712 | ) | $ | 1,586 | $ | (5,967 | ) | $ | 1,334 | $ | 762 | $ | (8,518 | ) | $ | (1,771 | ) | $ | 723 | ||||||||||||
| Less: Effective dividend on preferred stock |
373 | 373 | 373 | 373 | 373 | 372 | 372 | 342 | ||||||||||||||||||||||||
| Net income (loss) available to common shareholders |
$ | (8,085 | ) | $ | 1,213 | $ | (6,340 | ) | $ | 961 | $ | 389 | $ | (8,890 | ) | $ | (2,143 | ) | $ | 381 | ||||||||||||
| Income (loss) per common share, basic and diluted |
$ | (1.35 | ) | $ | 0.20 | $ | (1.06 | ) | $ | 0.16 | $ | 0.07 | $ | (1.50 | ) | $ | (0.36 | ) | $ | 0.06 | ||||||||||||
Net Interest Income and Net Interest Margin
Net interest income, the fundamental source of the Company’s earnings, is defined as the difference between income on earning assets and the cost of funds supporting those assets. Significant categories of earning assets are loans and investment securities, while deposits and long-term borrowings represent the major portion of interest bearing liabilities. The level of net interest income is impacted primarily by variations in the volume and mix of these assets and liabilities, as well as changes in interest rates when compared to previous periods of operations and the yield of our interest earning assets compared to our cost of funding these assets.
Table 2 presents the average interest earning assets and average interest bearing liabilities, the average yields earned on such assets (on a tax equivalent basis) and rates paid on such liabilities, and the net interest margin for the indicated periods. The variance in interest income and expense caused by differences in average balances and rate is shown in Table 3.
For comparative purposes, income from tax-exempt securities is adjusted to a tax-equivalent basis using the federal statutory tax rate of 34% and adjusted by the Tax Equity and Fiscal Responsibility Act (“TEFRA”) adjustment. This latter adjustment is for the disallowance as a deduction of a portion of total interest expense related to the ratio of average tax-exempt securities to average total assets. By making these adjustments, tax-exempt income and their yields are presented on a comparable basis with income and yields from fully taxable earning assets. The net interest margin is calculated by expressing tax-equivalent net interest income as a percentage of average interest earning assets, and represents the Company’s net yield on its earning assets. Net interest margin is an indicator of the Company’s effectiveness in generating income from its earning assets. The net interest margin is affected by the structure of the balance sheet as well as by competitive pressures, Federal Reserve Board policies and the economy. The spread that can be earned between interest earning assets and interest bearing liabilities is also dependent to a large extent on the slope of the yield curve.
2010 compared with 2009
Net interest income, on a fully tax equivalent basis, increased $3.0 million or 8.9% to $36.5 million for the year ended December 31, 2010, up from $33.5 million for the year ended December 31, 2009. While total average earning assets and interest-bearing liabilities had little change from the 2009 balances, the increase in net interest income was driven by the change in the mix and pricing of the balance sheet components. These shifts resulted in an increase of 29 basis points in our net interest margin from 3.26% in 2009 to 3.55% in 2010. The percentage of average earning assets to total average assets decreased from 93.3% in 2009 to 93.1% in 2010.
Total interest income decreased $3.3 million from $57.6 million for the year ended December 31, 2009 to $54.2 million for the
32
Table of Contents
same period of 2010. This was driven by a decline in the yield on interest earning assets from 5.61% for the year ended December 31, 2009 to 5.28% for 2010, which was partially offset by a $396 thousand increase in average earning assets during the same periods. This decrease was the result of reduced yields on the investment securities portfolio and nearly no growth in the average loan balances.
Average total loan balances increased $426 thousand from $835.1 million for 2009 to $835.5 million for 2010. The yield on loans declined to 5.71% for 2010 compared to 5.95% for 2009. This resulted in a $2.0 million, or 24 basis points, drop in our largest earning asset category from the prior year’s income level to $47.7 million for 2010 compared to $49.7 million in 2009. This performance decline was the result of weak loan demand, adjustments to our variable rate loans in the low interest rate environment, increased charge-offs, payment curtailments on outstanding loans, an increase in nonperforming loans and the aforementioned loan sale.
Average investment security balances increased $5.6 million from $159.6 million for 2009 to $165.2 million for 2010. While the average volume was up, the yield on securities declined 95 basis points from 4.84% for 2009 to 3.89% for 2010. The lower yield resulted from our investing in shorter duration investments which had a corresponding lower yield in 2010. Taxable investment securities increased $11.2 million but the yield declined from 4.71% in 2009 to 3.42% in 2010, a drop of 129 basis points.
Our excess funds are invested in short term investments. Average interest bearing deposits in other banks increased $13.7 million from $12.1 million in 2009 to $25.8 million in 2010 while federal funds sold decreased $19.3 million to $838 thousand in 2010 compared to $20.1 million in 2009. This reflected a change in our short term investment strategy as short term yields as a whole were very low but were slightly higher outside the federal funds market. In total, our excess funds decreased $5.6 million from 2009 to 2010.
Average interest bearing liabilities decreased only $41 thousand to remain at $893.1 million for 2009 and 2010. Average interest bearing deposits increased $839 thousand from $756.5 million for December 31, 2009 to $757.3 million for December 31, 2010. Changes within the mix of these balances and the corresponding decrease in the rates on deposits were significant drivers for the reduction in interest expense related to interest-bearing deposits and the corresponding increase in our net interest income. Our overall cost of funds decreased $6.3 million, as the total rate for average interest bearing deposits fell from 2.41% for December 31, 2009 to 1.63% in 2010, a drop of 78 basis points. Deposits continued to shift from higher priced certificates to lower priced NOW, money market and savings accounts with the largest increase coming in the aggressively priced NOW balance with an increase of $44.2 million in average balance and a corresponding rate decrease of 26 basis points from 1.52% to 1.26%. Money market deposits increased $15.7 million and savings were up $3.0 million with corresponding rate declines. Average large dollar certificates decreased $15.5 million from $177.7 million to $162.2 million in 2010 and the rate dropped 114 basis points from 3.34% in 2009 to 2.20% in 2010. Other certificates average balance declined $46.7 million from $235.1 in 2009 to $188.4 million in 2010, with a corresponding 105 basis point drop in rate. Other interest-bearing liabilities added to the decrease as long-term FHLB borrowings cost declined $386 thousand from $5.4 million at the end of 2009 to $5.0 million at the end of 2010. In addition, trust preferred debt interest expense declined $61 thousand as the variable rate on this instrument declined 59 basis points between 2009 and 2010.
2009 compared with 2008
Net interest income, on a fully tax equivalent basis, increased $206 thousand to $33.5 million for the year ended December 31, 2009, up from $33.3 million for the year ended December 31, 2008. Total average earning assets increased $93.6 million from $933.2 million for 2008 to $1.0 billion in 2009. The overall balance sheet increase was not accompanied by strong earnings increases as the yield on earning assets declined 83 basis points from 6.44% in 2008 to 5.61% in 2009. The cost of interest-bearing liabilities declined 64 basis points from 3.33% in 2008 to 2.69% in 2009. This continued a trend we saw throughout 2008 as the Federal Reserve rapidly lowered rates to deal with the financial crisis resulting in a gap between the quick repricing of assets and a slower repricing of interest bearing liabilities. The net interest margin decreased 31 basis points from 3.57% in 2008 to 3.26% in 2009. The percentage of average earning assets to total average assets decreased from 93.7% in 2008 to 93.3% in 2009.
Total interest income decreased $2.6 million from $60.1 million for December 31, 2008 to $57.6 million for the same period of 2009. This was driven by a 69 basis point decline in loan yields and a 75 basis point decline in investment securities yields. The decrease in loan interest income was a result of the low rate environment, while investment securities earnings were impacted by the impairment losses on trust preferred and agency preferred securities in 2008 and 2009 and the lower yield on
33
Table of Contents
more recent investment securities.
Average total loan balances increased $61.2 million to $835.1 million for 2009 from $773.8 million for December 31, 2008. The yield on loans declined to 5.95% for 2009 compared to 6.64% for 2008 and resulted in a $1.7 million drop in interest income generated by our largest earning asset category to $49.7 million for 2009 compared to $51.4 million in 2008. This loan balance increase was the result of growth in our market area.
Average investment security balances increased $4.6 million from $155.0 million for 2008 to $159.6 million for 2009. While the average volume was up, the yield on securities declined 75 basis points from 5.59% for 2008 to 4.84% for 2009. As noted above, the lower yield was the result of impairment losses in our portfolio and the lower rate environment. Taxable investment securities decreased $1.8 million, while the yield declined from 5.61% in 2008 to 4.71% in 2009, a drop of 90 basis points.
Average interest bearing deposits in other banks increased from $0 in 2008 to $12.1 million in 2009, as we moved out of the federal funds market in search of higher yields. Federal funds sold increased $15.7 million to $20.1 million in 2009 compared to $4.4 million in 2008. The high level of excess funds reflects the difficulty of deploying the $24.0 million in TARP money in a low rate environment. In total, our excess funds increased $27.8 million between 2008 and 2009.
Average interest bearing liabilities increased $87.9 million from $805.2 million in 2008 to $893.1 million in 2009. Average interest bearing deposits grew $99.6 million, up 15.2% from $656.8 million for December 31, 2008 to $756.5 million for December 31, 2009. For 2009, interest checking experienced the largest growth in total dollars increasing $40.9 million despite a 50 basis point decrease in the rate from 2.02% in 2008 to 1.52% in 2009. The largest percentage increase in interest bearing deposits was money market savings which grew $31.9 million or 60.9% compared to 2008 totals and also despite a 78 basis point decline in the rate from 2.40% in 2008 to 1.62% in 2009. Average large dollar certificates increased $34.5 million from $143.1 million to $177.7 million in 2009 and the rate dropped 112 basis points from 4.46% in 2008 to 3.34% in 2009. Other certificates average balance declined $7.1 million from $242.2 million in 2008 to $235.1 million in 2009, with a corresponding 53 basis point drop in rates. Other interest-bearing liabilities added to the decrease as long-term FHLB borrowings cost declined $358 thousand from $5.8 million at the end of 2008 to $5.4 million at the end of 2009. In addition, trust preferred debt interest expense declined $233 thousand as the rate on this variable rate instrument dropped from 6.09% at year end 2008 to 3.83% at year end 2009.
34
Table of Contents
Table 2: Average Balance Sheet and Net Interest Margin Analysis
(dollars in thousands)
| Year Ended December 31, | ||||||||||||||||||||||||||||||||||||
| 2010 | 2009 | 2008 | ||||||||||||||||||||||||||||||||||
| Average | Income/ | Yield/ | Average | Income/ | Yield/ | Average | Income/ | Yield/ | ||||||||||||||||||||||||||||
| Balance | Expense | Rate (1) | Balance | Expense | Rate (1) | Balance | Expense | Rate (1) | ||||||||||||||||||||||||||||
| Assets: |
||||||||||||||||||||||||||||||||||||
| Securities |
||||||||||||||||||||||||||||||||||||
| Taxable, available for sale |
$ | 114,845 | $ | 3,928 | 3.42 | % | $ | 103,684 | $ | 4,879 | 4.71 | % | $ | 105,473 | $ | 5,918 | 5.61 | % | ||||||||||||||||||
| Restricted securities |
9,496 | 138 | 1.45 | % | 8,922 | 103 | 1.15 | % | 9,034 | 355 | 3.93 | % | ||||||||||||||||||||||||
| Tax exempt, available for sale (2) |
40,826 | 2,365 | 5.79 | % | 46,974 | 2,737 | 5.83 | % | 40,482 | 2,388 | 5.90 | % | ||||||||||||||||||||||||
| Total securities |
165,167 | 6,431 | 3.89 | % | 159,580 | 7,719 | 4.84 | % | 154,989 | 8,661 | 5.59 | % | ||||||||||||||||||||||||
| Interest bearing deposits in other banks |
25,769 | 113 | 0.44 | % | 12,094 | 99 | 0.82 | % | — | — | 0.00 | % | ||||||||||||||||||||||||
| Federal funds sold |
838 | 1 | 0.12 | % | 20,130 | 43 | 0.21 | % | 4,416 | 84 | 1.90 | % | ||||||||||||||||||||||||
| Loans, net of unearned income (3) |
835,502 | 47,687 | 5.71 | % | 835,076 | 49,702 | 5.95 | % | 773,838 | 51,371 | 6.64 | % | ||||||||||||||||||||||||
| Total earning assets |
1,027,276 | 54,232 | 5.28 | % | 1,026,880 | 57,563 | 5.61 | % | 933,243 | 60,116 | 6.44 | % | ||||||||||||||||||||||||
| Less allowance for loan losses |
(16,324 | ) | (11,247 | ) | (9,489 | ) | ||||||||||||||||||||||||||||||
| Total non-earning assets |
92,987 | 84,783 | 72,659 | |||||||||||||||||||||||||||||||||
| Total assets |
$ | 1,103,939 | $ | 1,100,416 | $ | 996,413 | ||||||||||||||||||||||||||||||
| Liabilities & Shareholders’ Equity: |
||||||||||||||||||||||||||||||||||||
| Interest-bearing deposits |
||||||||||||||||||||||||||||||||||||
| Checking |
$ | 229,637 | $ | 2,885 | 1.26 | % | $ | 185,436 | $ | 2,815 | 1.52 | % | $ | 144,558 | $ | 2,925 | 2.02 | % | ||||||||||||||||||
| Savings |
77,122 | 472 | 0.61 | % | 74,081 | 540 | 0.73 | % | 74,667 | 671 | 0.90 | % | ||||||||||||||||||||||||
| Money market savings |
99,924 | 1,276 | 1.28 | % | 84,192 | 1,367 | 1.62 | % | 52,321 | 1,256 | 2.40 | % | ||||||||||||||||||||||||
| Large dollar certificates of deposit (4) |
162,176 | 3,565 | 2.20 | % | 177,650 | 5,935 | 3.34 | % | 143,115 | 6,376 | 4.46 | % | ||||||||||||||||||||||||
| Other certificates of deposit |
188,436 | 4,114 | 2.18 | % | 235,097 | 7,584 | 3.23 | % | 242,184 | 9,109 | 3.76 | % | ||||||||||||||||||||||||
| Total interest-bearing deposits |
757,295 | 12,312 | 1.63 | % | 756,456 | 18,241 | 2.41 | % | 656,845 | 20,337 | 3.10 | % | ||||||||||||||||||||||||
| Federal funds purchased and repurchase agreements |
4,960 | 57 | 1.15 | % | 1,725 | 18 | 1.04 | % | 3,817 | 90 | 2.36 | % | ||||||||||||||||||||||||
| Short-term borrowings |
1,767 | 9 | 0.51 | % | — | — | 0.00 | % | — | — | 0.00 | % | ||||||||||||||||||||||||
| Long-term borrowings |
118,763 | 5,010 | 4.22 | % | 124,645 | 5,396 | 4.33 | % | 134,219 | 5,754 | 4.29 | % | ||||||||||||||||||||||||
| Trust preferred debt |
10,310 | 334 | 3.24 | % | 10,310 | 395 | 3.83 | % | 10,310 | 628 | 6.09 | % | ||||||||||||||||||||||||
| Total interest-bearing liabilities |
893,095 | 17,722 | 1.98 | % | 893,136 | 24,050 | 2.69 | % | 805,191 | 26,809 | 3.33 | % | ||||||||||||||||||||||||
| Noninterest-bearing liabilities |
||||||||||||||||||||||||||||||||||||
| Demand deposits |
100,970 | 96,220 | 99,763 | |||||||||||||||||||||||||||||||||
| Other liabilities |
6,098 | 9,622 | 4,881 | |||||||||||||||||||||||||||||||||
| Total liabilities |
1,000,163 | 998,978 | 909,835 | |||||||||||||||||||||||||||||||||
| Shareholders’ equity |
103,776 | 101,438 | 86,578 | |||||||||||||||||||||||||||||||||
| Total liabilities and shareholders’ equity |
$ | 1,103,939 | $ | 1,100,416 | $ | 996,413 | ||||||||||||||||||||||||||||||
| Net interest income (2) |
$ | 36,510 | $ | 33,513 | $ | 33,307 | ||||||||||||||||||||||||||||||
| Interest rate spread (2)(5) |
3.30 | % | 2.92 | % | 3.11 | % | ||||||||||||||||||||||||||||||
| Interest expense as a percent of average earning assets |
1.73 | % | 2.34 | % | 2.87 | % | ||||||||||||||||||||||||||||||
| Net interest margin (2)(6) |
3.55 | % | 3.26 | % | 3.57 | % | ||||||||||||||||||||||||||||||
Notes:
| (1) | Yields are based on average daily balances. |
| (2) | Income and yields are reported on a tax equivalent basis assuming a federal tax rate of 34%, with an adjustment of $722, $836 and $730 in 2010, 2009 and 2008, respectively. |
| (3) | Nonaccrual loans have been included in the computations of average loan balances. |
| (4) | Large dollar certificates of deposit are certificates issued in amounts of $100,000 or greater. |
| (5) | Interest rate spread is the average yield on earning assets, calculated on a fully taxable basis, less the average rate incurred on interest-bearing liabilities. |
| (6) | Net interest margin is the net interest income, calculated on a fully taxable basis, expressed as a percentage of average earning assets. |
35
Table of Contents
As the largest component of income, net interest income represents the amount that interest and fees earned on loans and investments exceeds the interest costs of funds used to support these earning assets. Net interest income is determined by the relative levels, rates and mix of earning assets and interest bearing liabilities. The following table attributes changes in net interest income either to changes in average volume or to rate changes in proportion to the relationship of the absolute dollar amount of the change in each.
| Table 3: Volume and Rate Analysis (1) |
||||||||||||||||||||||||
| 2010 from 2009 | 2009 from 2008 | |||||||||||||||||||||||
| Increase (Decrease) | Increase (Decrease) | |||||||||||||||||||||||
| Due to Changes in: | Due to Changes in: | |||||||||||||||||||||||
| (dollars in thousands) |
Volume | Rate | Total | Volume | Rate | Total | ||||||||||||||||||
| Interest income: |
||||||||||||||||||||||||
| Securities: |
||||||||||||||||||||||||
| Taxable securities |
$ | 624 | $ | (1,575 | ) | $ | (951 | ) | $ | (104 | ) | $ | (935 | ) | $ | (1,039 | ) | |||||||
| Restricted securities |
7 | 28 | 35 | (4 | ) | (248 | ) | (252 | ) | |||||||||||||||
| Tax exempt securities (2) |
(353 | ) | (19 | ) | (372 | ) | 377 | (28 | ) | 349 | ||||||||||||||
| Total securities |
278 | (1,566 | ) | (1,288 | ) | 269 | (1,211 | ) | (942 | ) | ||||||||||||||
| Interest bearing deposits in other banks |
24 | (10 | ) | 14 | 99 | — | 99 | |||||||||||||||||
| Federal funds sold |
(29 | ) | (13 | ) | (42 | ) | (55 | ) | 14 | (41 | ) | |||||||||||||
| Loans, net of unearned income |
(10 | ) | (2,005 | ) | (2,015 | ) | 5,442 | (7,111 | ) | (1,669 | ) | |||||||||||||
| Total interest income |
263 | (3,594 | ) | (3,331 | ) | 5,755 | (8,308 | ) | (2,553 | ) | ||||||||||||||
| Interest expense: |
||||||||||||||||||||||||
| Interest-bearing deposits: |
||||||||||||||||||||||||
| Checking |
260 | (190 | ) | 70 | (822 | ) | 712 | (110 | ) | |||||||||||||||
| Savings |
26 | (94 | ) | (68 | ) | (5 | ) | (126 | ) | (131 | ) | |||||||||||||
| Money market savings |
683 | (774 | ) | (91 | ) | 235 | (124 | ) | 111 | |||||||||||||||
| Large dollar certificates of deposit (3) |
(485 | ) | (1,885 | ) | (2,370 | ) | 11,062 | (11,503 | ) | (441 | ) | |||||||||||||
| Other certificates of deposit |
(1,306 | ) | (2,164 | ) | (3,470 | ) | (273 | ) | (1,252 | ) | (1,525 | ) | ||||||||||||
| Total interest-bearing deposits |
(822 | ) | (5,107 | ) | (5,929 | ) | 10,197 | (12,293 | ) | (2,096 | ) | |||||||||||||
| Federal funds purchased and repurchase agreements |
37 | 2 | 39 | (36 | ) | (36 | ) | (72 | ) | |||||||||||||||
| Short-term borrowings |
9 | — | 9 | — | — | — | ||||||||||||||||||
| Long-term borrowings |
(251 | ) | (135 | ) | (386 | ) | (412 | ) | 54 | (358 | ) | |||||||||||||
| Trust preferred debt |
— | (61 | ) | (61 | ) | — | (233 | ) | (233 | ) | ||||||||||||||
| Total interest expense |
(1,027 | ) | (5,301 | ) | (6,328 | ) | 9,749 | (12,508 | ) | (2,759 | ) | |||||||||||||
| Change in net interest income |
$ | 1,290 | $ | 1,707 | $ | 2,997 | $ | (3,994 | ) | $ | 4,200 | $ | 206 | |||||||||||
Notes:
| (1) | Changes caused by the combination of rate and volume are allocated based on the percentage caused by each. |
| (2) | Income and yields are reported on a tax-equivalent basis, assuming a federal tax rate of 34%. |
| (3) | Large dollar certificates of deposit are certificates issued in amounts of $100,000 or greater. |
Interest Sensitivity
Our primary goals in interest rate risk management are to minimize negative fluctuations in net interest margin as a percentage of earning assets and to increase the dollar amount of net interest income at a growth rate consistent with the growth rate of total assets. These goals are accomplished by managing the interest sensitivity gap, which is the difference between interest sensitive assets and interest sensitive liabilities in a specific time interval. Interest sensitivity gap is managed by balancing the volume of floating rate liabilities with a similar volume of floating rate assets, by keeping the fixed rate average maturity of asset and liability contracts reasonably consistent and short, and by routinely adjusting pricing to market conditions on a regular basis.
36
Table of Contents
We strive to maintain a position flexible enough to move to a balanced position between rate-sensitive assets and rate-sensitive liabilities, which may be desirable when there are wide and frequent fluctuations in interest rates. Matching the amount of assets and liabilities maturing in the same time interval helps to hedge interest rate risk and to minimize the impact on net interest income in periods of rising or falling interest rates. Interest rate gaps are managed through investments, loan pricing and deposit pricing strategies. When an unacceptable positive gap within a one-year time frame occurs, maturities can be extended by selling shorter-term investments and purchasing longer maturities. When an unacceptable negative gap occurs, variable rate loans can be increased and more investment in shorter-term investments can be made.
The Company began 2010 with high interest rates on investment securities. These rates trended down through the first three quarters of the year, and then trended back up in the fourth quarter of 2010. In the second and third quarters of 2010, the Company restructured the investment portfolio and recognized some gains on the disposition of securities held due to an increase in prices as rates fell. Contrary to the Company’s original expectations, interest rates did not rise in 2010 due to the slow economic recovery. As the Company restructured its balance sheet during 2010 to better address declines in asset quality, our earning assets were sensitive to rate decreases over the past several years and the impact of nonaccrual loans. Given this limited earnings environment and the low yields on investment securities, the Company was able to compensate for lower earnings with larger declines in the deposit costs. The Company’s only deposit category that did not have a decrease in interest expense was our interest checking product, which had a volume driven increase despite the low rate environment. Our customers continue to stay short-term in their deposit investments. These changes and adjustments throughout the year allowed us to generate an overall increase in net interest income and to maintain an asset sensitive position with expectations more likely to point towards an increasing interest rate cycle.
Noninterest Income (Loss)
Noninterest income (loss) is comprised of all sources of income (loss) other than interest income (loss) on our earning assets. Significant revenue items include fees collected on certain deposit account transactions, debit and credit card fees, other general services, earnings from other investments we own in part or in full, gains or losses from investments, and gains or losses on sales of investments, loans, fixed assets and other real estate owned.
The following table depicts noninterest income (loss) for the years ended December 31, 2010, 2009 and 2008.
Table 4: Noninterest Income (Loss)
| Years Ended December 31, | ||||||||||||
| (dollars in thousands) |
2010 | 2009 | 2008 | |||||||||
| Service charges and fees on deposit accounts |
$ | 3,873 | $ | 3,841 | $ | 3,991 | ||||||
| Debit/credit card fees |
1,340 | 1,189 | 1,135 | |||||||||
| Gain on sale of available for sale securities, net |
2,455 | 66 | 44 | |||||||||
| Other-than-temporary impairment losses on securities |
(77 | ) | (18,919 | ) | (4,933 | ) | ||||||
| Gain on sale of fixed assets |
26 | — | 129 | |||||||||
| Gain (loss) on sale of other real estate owned |
(22 | ) | 357 | — | ||||||||
| Impairment losses on other real estate owned |
(928 | ) | — | (229 | ) | |||||||
| Gain on sale of loans |
1,326 | — | — | |||||||||
| Gain on bank owned life insurance |
604 | — | — | |||||||||
| Actuarial gain on pension curtailment |
— | — | 1,328 | |||||||||
| Other operating income |
1,395 | 977 | 1,505 | |||||||||
| Total noninterest income (loss) |
$ | 9,992 | $ | (12,489 | ) | $ | 2,970 | |||||
2010 Compared to 2009
Noninterest income for 2010 was $10.0 million, an increase of $22.5 million or 180.0% over the noninterest (loss) of $12.5 million for 2009. The significant improvement in this component was caused by the following events:
| • | Debit/credit card fees were $1.3 million in 2010, an increase of $151 thousand or 12.7% over the $1.2 million in 2009 and were driven by a 20.5% increase in debit card income; |
| • | Sales of available for sale securities generated gains of $2.5 million in 2010, an increase of $2.4 million or 3,619.7% over gains of $66 thousand in 2009; |
37
Table of Contents
| • | Other-than-temporary impairment losses on trust preferred securities were $77 thousand in 2010, a decrease of $18.8 million or 99.6% over the losses of $18.9 million in 2009; |
| • | Losses on the sale of other real estate owned were $22 thousand in 2010, a decrease of $379 thousand or 106.2% over the gains of $357 thousand in 2009; |
| • | Impairment losses related to valuation adjustments on other real estate owned were $928 thousand in 2010, while no such impairment losses were recognized in 2009; |
| • | The sale of 1-4 residential mortgage loans during 2010 generated a gain of $1.3 million, while no such gains were generated during 2009; |
| • | Bank owned life insurance proceeds resulting from the death of a former officer generated a gain of $604 thousand in 2010, while no such gains were generated during 2009; and |
| • | Other operating income was $1.4 million in 2010, an increase of $418 thousand or 42.8% over the $977 thousand in 2009 and was driven by an 83.4% increase in investment services income and a 55.9% decrease in write downs of our investments in community and housing development funds. |
2009 Compared to 2008
Noninterest (loss) for 2009 was ($12.5) million, a decrease of $15.5 million or 520.5% over the noninterest income of $3.0 million for 2008. The significant decrease in this component was caused by the following events:
| • | Service charges and fees on deposit accounts were $3.8 million in 2009, a decrease of $150 thousand or 3.8% over the $4.0 million in 2008 which was driven by a 4.9% decrease in NSF charges; |
| • | Other-than-temporary impairment losses on trust preferred securities were $18.9 million in 2009, an increase of $14.0 million or 283.5% over the losses of $4.9 million in 2008 on agency preferred securities; |
| • | Gains on the sale of other real estate owned were $357 thousand in 2009, while no such gains were generated during 2008; |
| • | There were no impairment losses related to valuation adjustments on other real estate owned in 2009, compared to $229 thousand in 2008; |
| • | A $1.3 million actuarial gain was recorded in 2008 on a pension plan restructuring that was not present in 2009; and |
| • | Other operating income was $977 thousand in 2009, a decrease of $528 thousand or 35.1% over the $1.5 million in 2008 and was driven by a 367.4% increase in write downs of our investments in community and housing development funds. |
Noninterest Expense
Noninterest expense includes all expenses with the exception of those paid for interest on borrowings and deposits. Significant expense items included in this component are salaries and employee benefits, occupancy and operating expenses.
The following table depicts noninterest expense for the years ended December 31, 2010, 2009 and 2008.
Table 5: Noninterest Expense
| Years Ended December 31, | ||||||||||||
| (dollars in thousands) |
2010 | 2009 | 2008 | |||||||||
| Salaries and employee benefits |
$ | 16,362 | $ | 15,254 | $ | 14,776 | ||||||
| Occupancy and equipment expenses |
5,183 | 5,144 | 4,738 | |||||||||
| Telephone |
1,149 | 1,070 | 996 | |||||||||
| FDIC expense |
2,325 | 1,705 | 465 | |||||||||
| Consultant fees |
905 | 751 | 653 | |||||||||
| Collection, repossession and other real estate owned |
2,134 | 569 | 193 | |||||||||
| Marketing and advertising |
1,325 | 737 | 874 | |||||||||
| Other operating expenses |
5,188 | 5,418 | 5,250 | |||||||||
| Total noninterest expense |
$ | 34,571 | $ | 30,648 | $ | 27,945 | ||||||
2010 Compared to 2009
38
Table of Contents
Noninterest expense for 2010 was $34.6 million, an increase of $3.9 million or 12.8% over the noninterest expense of $30.6 million for 2009. Significant contributors to the increase in these expenses are as follows:
| • | Salaries and employee benefits were $16.4 million for 2010, an increase of $1.1 million or 7.3% over the $15.3 million for 2009. Salaries expense has increased as we have added additional positions to strengthen our management team. The increased regulatory burden resulting from recently enacted financial regulatory reforms will likely necessitate hiring additional personnel to meet increased regulatory compliance requirements. Salaries expense is also impacted by the application of an accounting standard to defer certain salary amounts over the life of our loan originations to better match income and expense from those assets. Decreased loan demand during 2010 has resulted in lower originations that, on a comparative basis, have increased the period expense associated with salaries; |
| • | FDIC expense, the Company’s cost for deposit insurance, was $2.3 million for 2010, an increase of $620 thousand or 36.4% over the $1.7 million for 2009. This trend of increased assessments is likely continue for the foreseeable future and will present challenges to our ability to decrease overall noninterest expense; |
| • | Consultant fees were $905 thousand for 2010, an increase of $154 thousand or 20.5% over the $751 thousand for 2009. The elevation of these expenses were primarily due to added costs related to working out problem loans; |
| • | Collection, repossession and other real estate owned expenses were $2.1 million for 2010, an increase of $1.6 million or 275.0% over the $569 thousand for 2009. The elevation of these expenses was due to the larger number of past due loans and nonperforming assets during 2010 as well as the larger number of properties during 2010; |
| • | Marketing and advertising expenses were $1.3 million for 2010, an increase of $588 thousand or 79.8% over the $737 thousand for 2009. The elevation of these expenses was due to the promotion and celebration of the Company’s Centennial Anniversary as well as deposit promotions; and |
| • | Other operating expenses were $5.2 million for 2010, a decrease of $230 thousand or 4.2% over the $5.4 million for 2009. Within this category, most controllable expenses (i.e. office supplies, postage, etc.) saw reductions from the prior year, however these were offset by increases in other professional fees and ATM/EFT dispute charge-offs. In addition, this category was benefited by the absence of costs related to the terminated merger in 2009. |
2009 Compared to 2008
Noninterest expense for 2009 was $30.6 million, an increase of $2.7 million or 9.7% over the noninterest expense of $27.9 million for 2008. Significant contributors to the increase in these expenses are as follows:
| • | Salaries and employee benefits were $15.3 million for 2009, an increase of $478 thousand or 3.2% over the $14.8 million for 2008. The elevation of these expenses was due to the hiring of additional personnel as well as promotions, and an increase in periodic pension plan expense, partially offset by a decrease in salaries expense relating to the deferral of certain salary amounts; |
| • | Occupancy and equipment expenses were $5.1 million for 2009, an increase of $406 thousand or 8.6% over the $4.7 million for 2008. The elevation of these expenses were driven by increases in service contracts, software maintenance and software amortization as the Company upgraded its software infrastructure during the year; |
| • | FDIC expense was $1.7 million for 2009, an increase of $1.2 million or 266.7% over the $465 thousand for 2008. The elevation of these expenses were due to increased assessments as well as a onetime special assessment during the second quarter of approximately $500 thousand; |
| • | Consultant fees were $751 thousand for 2009, an increase of $98 thousand or 15.0% over the $653 thousand for 2008. The elevation of these expenses were primarily due to the added costs related to the terminated merger in 2009; |
| • | Collection, repossession and other real estate owned expenses were $569 thousand for 2009, an increase of $376 thousand or 194.8% over the $193 thousand for 2008. The elevation of these expenses was due to the larger number of past due loans and nonperforming assets during 2009 as well as the larger number of properties during 2009; |
| • | Marketing and advertising expenses were $737 thousand for 2009, a decrease of $137 thousand or 15.7% over the $874 thousand for 2008. The reduction of these expenses from 2008 to 2009 was primarily due to not having any marketing expenses related to branch openings; and |
| • | Other operating expenses were $5.4 million for 2009, an increase of $168 thousand or 3.2% over the $5.3 million for 2008. The elevation of these expenses was primarily attributed to the costs related to the terminated merger in 2009. |
Income Taxes
39
Table of Contents
The Company recorded an income tax benefit of $7.0 million and $5.9 million in 2010 and 2009, respectively, compared to income tax expense of $506 thousand in 2008. The Company’s effective tax rate for the years ended December 31, 2010, 2009 and 2008 was 34.6%, 35.3% and 28.0%, respectively. The effective tax rate differs from the statutory income tax rate of 34% due to the Company’s investment in tax-exempt loans and securities, income from bank owned life insurance, and community/housing development tax credits. For further information concerning Income Taxes, refer to Item 8. “Financial Statements and Supplementary Data,” under the heading “Note 10. Income Taxes.”
Asset Quality
Provision and Allowance for Loan Losses
The allowance for loan losses is a reserve for estimated credit losses on individually evaluated loans determined to be impaired as well as estimated credit losses inherent in the loan portfolio, and is based on periodic evaluations of the collectability and historical loss experience of loans. A provision for loan losses, which is a charge against earnings, is recorded to bring the allowance for loan losses to a level that, in management’s judgment, is appropriate to absorb probable losses in the loan portfolio. Actual credit losses are deducted from the allowance for loan losses for the difference between the carrying value of the loan and the estimated net realizable value or fair value of the collateral, if collateral dependent. Subsequent recoveries, if any, are credited to the allowance for loan losses.
The allocation methodology applied by the Company, designed to assess the appropriateness of the allowance for loan losses, includes an allocation methodology, as well as management’s ongoing review and grading of the loan portfolio into criticized loan categories (defined as specific loans warranting either specific allocation, or a classified status of substandard, doubtful or loss). The allocation methodology focuses on evaluation of several factors, including but not limited to: evaluation of facts and issues related to specific loans, management’s ongoing review and grading of the loan portfolio, consideration of historical loan loss experience (rolling five year average with weighting factors applied to more recent experience) and delinquency experience on each portfolio category, trends in past due and nonaccrual loans, the level of classified loans, the risk characteristics of the various classifications of loans, changes in the size and character of the loan portfolio, concentrations of loans to specific borrowers or industries, existing economic conditions, the fair value of underlying collateral, and other qualitative and quantitative factors which could affect potential credit losses. Because each of the criteria used is subject to change, the allocation of the allowance for loan losses is made for analytical purposes and is not necessarily indicative of the trend of future loan losses in any particular loan category. The total allowance is available to absorb losses from any segment of the portfolio. In determining the allowance for loan losses, the Company considers its portfolio segments and loan classes to be the same.
The allowance for loan losses is comprised of a specific allowance for identified problem loans and a general allowance representing estimations done pursuant to either FASB ASC Topic 450 “Accounting for Contingencies”, or FASB ASC Topic 310 “Accounting by Creditors for Impairment of a Loan.” The specific component relates to loans that are classified as impaired, and is established when the discounted cash flows (or collateral value or observable market price) of the impaired loan is lower than the carrying value of that loan. For collateral dependent loans, an updated appraisal will be ordered if a current one is not on file. Appraisals are performed by independent third-party appraisers with relevant industry experience. Adjustments to the appraised value may be made based on recent sales of like properties or general market conditions when deemed appropriate. The general component covers non-classified or performing loans and those loans classified as substandard, doubtful or loss that are not impaired. The general component is based on historical loss experience adjusted for qualitative factors, such as economic conditions, interest rates and unemployment rates. The Company uses a risk grading system for real estate (including multifamily residential, construction, farmland and non-farm, non-residential) and commercial loans. Loans are graded on a scale from 1 to 9. Non-impaired real estate and commercial loans are assigned an allowance factor which increases with the severity of risk grading. A general description of the characteristics of the risk grades is as follows:
Pass Grades
| • | Risk Grade 1 loans have little or no risk and are generally secured by cash or cash equivalents; |
| • | Risk Grade 2 loans have minimal risk to well qualified borrowers and no significant questions as to safety; |
| • | Risk Grade 3 loans are satisfactory loans with strong borrowers and secondary sources of repayment; |
| • | Risk Grade 4 loans are satisfactory loans with borrowers not as strong as risk grade 3 loans but may exhibit a higher degree of financial risk based on the type of business supporting the loan; and |
| • | Risk Grade 5 loans are loans that warrant more than the normal level of supervision and have the possibility of an event occurring that may weaken the borrower’s ability to repay. |
40
Table of Contents
Special Mention
| • | Risk Grade 6 loans have increasing potential weaknesses beyond those at which the loan originally was granted and if not addressed could lead to inadequately protecting the Company’s credit position. |
Classified Grades
| • | Risk Grade 7 loans are substandard loans and are inadequately protected by the current sound worth or paying capacity of the obligor or the collateral pledged. These have well defined weaknesses that jeopardize the liquidation of the debt with the distinct possibility the Company will sustain some loss if the deficiencies are not corrected; |
| • | Risk Grade 8 loans are doubtful of collection and the possibility of loss is high but pending specific borrower plans for recovery, its classification as a loss is deferred until its more exact status is determined; and |
| • | Risk Grade 9 loans are loss loans which are considered uncollectable and of such little value that their continuance as a bank asset is not warranted. |
The Company uses a past due grading system for consumer loans, including one to four family residential first and seconds and home equity lines. The past due status of a loan is based on the contractual due date of the most delinquent payment due. The consumer loans are segregated between performing and nonperforming loans. Performing loans are those that have made timely payments in accordance with the terms of the loan agreement and are not past due 90 days or more. Nonperforming loans are those that do not accrue interest or are greater than 90 days past due and accruing interest. The past due grading of consumer loans is based on the following categories: current, 1-29 days past due, 30-59 days past due, 60-89 days past due and over 90 days past due. Non-impaired consumer loans are assigned an allowance factor which increases with the severity of past due status. This component of the allowance reflects the margin of imprecision inherent in the underlying assumptions used in the methodologies for estimating specific and general losses in the loan portfolio.
Management believes that the level of the allowance for loan losses is appropriate. While management uses available information to recognize losses on loans, future additions to the allowance for loan losses may be necessary based on changes in economic conditions. In addition, various regulatory agencies, as an integral part of their examination process, periodically review the Company’s allowance for loan losses. Such agencies may require the Company to recognize additions to the allowance for loan losses or may require that certain loan balances be charged-off or downgraded into classified loan categories when their credit evaluations differ from those of management based on their judgments about information available to them at the time of their examinations.
The following table presents the Company’s loan loss experience for the past five years:
41
Table of Contents
Table 6: Allowance for Loan Losses
| Years Ended December 31, | ||||||||||||||||||||
| (dollars in thousands) |
2010 | 2009 | 2008 | 2007 | 2006 | |||||||||||||||
| Average loans outstanding* |
$ | 835,502 | $ | 835,076 | $ | 773,838 | $ | 681,456 | $ | 614,330 | ||||||||||
| Allowance for loan losses, January 1 |
12,155 | 10,542 | 7,888 | 7,051 | 6,601 | |||||||||||||||
| Charge-offs: |
||||||||||||||||||||
| Commercial, industrial and agricultural |
5,608 | 561 | 606 | 177 | 174 | |||||||||||||||
| Real estate - one to four family residential: |
||||||||||||||||||||
| Closed end first and seconds |
2,643 | 566 | 292 | 61 | 42 | |||||||||||||||
| Home equity lines |
458 | 40 | 69 | 33 | — | |||||||||||||||
| Real estate - construction (1): |
||||||||||||||||||||
| One to four family residential |
162 | 451 | 605 | 4 | — | |||||||||||||||
| Other construction, land development and other land |
3,491 | 163 | 126 | — | — | |||||||||||||||
| Real estate - non-farm, non-residential (2): |
||||||||||||||||||||
| Owner occupied |
2,178 | 278 | — | — | — | |||||||||||||||
| Non-owner occupied |
580 | — | — | — | — | |||||||||||||||
| Consumer |
990 | 935 | 715 | 586 | 554 | |||||||||||||||
| Total loans charged-off |
16,110 | 2,994 | 2,413 | 861 | 770 | |||||||||||||||
| Recoveries: |
||||||||||||||||||||
| Commercial, industrial and agricultural |
94 | 114 | 240 | 126 | 83 | |||||||||||||||
| Real estate - one to four family residential: |
||||||||||||||||||||
| Closed end first and seconds |
19 | 53 | 30 | 14 | 8 | |||||||||||||||
| Home equity lines |
— | — | — | 13 | 3 | |||||||||||||||
| Real estate - construction (1): |
||||||||||||||||||||
| One to four family residential |
13 | 1 | — | — | — | |||||||||||||||
| Other construction, land development and other land |
2 | — | — | — | — | |||||||||||||||
| Real estate - non-farm, non-residential (2): |
||||||||||||||||||||
| Owner occupied |
8 | — | — | — | 12 | |||||||||||||||
| Consumer |
177 | 239 | 284 | 307 | 389 | |||||||||||||||
| Total recoveries |
313 | 407 | 554 | 460 | 495 | |||||||||||||||
| Net charge-offs |
15,797 | 2,587 | 1,859 | 401 | 275 | |||||||||||||||
| Adjustment from branch purchase |
— | — | 488 | — | — | |||||||||||||||
| Provision for loan losses |
28,930 | 4,200 | 4,025 | 1,238 | 725 | |||||||||||||||
| Allowance for loan losses, December 31 |
$ | 25,288 | $ | 12,155 | $ | 10,542 | $ | 7,888 | $ | 7,051 | ||||||||||
| Ratios: |
||||||||||||||||||||
| Ratio of allowance for loan losses to total loans outstanding, end of year |
3.26 | % | 1.42 | % | 1.29 | % | 1.11 | % | 1.08 | % | ||||||||||
| Ratio of net charge-offs to average loans outstanding during the year |
1.89 | % | 0.31 | % | 0.24 | % | 0.06 | % | 0.04 | % | ||||||||||
| * | Net of unearned income and includes nonaccrual loans. |
| (1) | A break down between 1-4 family residential and all other real estate construction loans is not available for 2007 and 2006. |
| (2) | A break down between owner occupied and non-owner occupied non-farm, non-residential loans is not available for 2007 and 2006. |
As a result of the historical challenges continuing to face the financial markets today, the Company made provisions for loan losses of $28.9 million in 2010 compared to $4.2 million in 2009, $4.0 million in 2008, $1.2 million in 2007 and $725 thousand in 2006. Net charge-offs in 2010 were $15.8 million compared to $2.6 million in 2009, $1.9 million in 2008, $401 thousand in 2007 and $275 thousand in 2006. This represents 1.89% of average loans outstanding in 2010, 0.31% in 2009, 0.24% in 2008, 0.06% in 2007 and 0.04% in 2006. The contribution to the provision and the related increase in the allowance in 2010 was made in response to continued deterioration of credit quality in our loan portfolio as well as current market
42
Table of Contents
conditions and the current economic climate, all of which indicate that credit quality issues may continue to adversely impact our loan portfolio and our earnings. The contribution to the provision and the related increase in the allowance for 2009 and 2008 was also due to the current market conditions and the overall growth in total loans. The contribution to the provision and the related increase in the allowance for 2007 and 2006 was due to the overall growth in total loans.
The allowance for loan losses at December 31, 2010 was $25.3 million, compared with $12.2 million at December 31, 2009, $10.5 million at December 31, 2008, $7.9 million at December 31, 2007 and $7.1 million at December 31, 2006. This represented 3.26% of year end loans at December 31, 2010 compared with 1.42% of year end loans at December 31, 2009, 1.29% of year end loans at December 31, 2008, 1.11% of year end loans at December 31, 2007 and 1.08% of year end loans at December 31, 2006.
The following table shows the allocation of the allowance for loan losses at the dates indicated. Notwithstanding these allocations, the entire allowance for loan losses is available to absorb charge-offs in any category of loan.
Table 7: Allocation of Allowance for Loan Losses
| At December 31, | ||||||||||||||||||||||||||||||||||||||||
| 2010 | 2009 | 2008 | 2007 | 2006 | ||||||||||||||||||||||||||||||||||||
| (dollars in thousands) | Allowance | Percent | Allowance | Percent | Allowance | Percent | Allowance | Percent | Allowance | Percent | ||||||||||||||||||||||||||||||
| Commercial, industrial and agricultural |
$ | 5,981 | 9.39 | % | $ | 2,683 | 9.68 | % | $ | 1,454 | 8.42 | % | $ | 1,235 | 8.57 | % | $ | 1,061 | 9.20 | % | ||||||||||||||||||||
| Real estate - one to four family residential: |
||||||||||||||||||||||||||||||||||||||||
| Closed end first and seconds |
3,340 | 33.62 | % | 2,533 | 34.89 | % | 1,695 | 35.15 | % | 1,109 | 38.17 | % | 1,060 | 39.31 | % | |||||||||||||||||||||||||
| Home equity lines |
587 | 12.05 | % | 556 | 10.09 | % | 487 | 8.14 | % | — | 4.84 | % | — | 3.47 | % | |||||||||||||||||||||||||
| Real estate - multifamily residential |
23 | 1.51 | % | 15 | 0.95 | % | 56 | 0.94 | % | — | 0.50 | % | — | 0.23 | % | |||||||||||||||||||||||||
| Real estate - construction (1): |
||||||||||||||||||||||||||||||||||||||||
| One to four family residential |
344 | 3.29 | % | 616 | 4.33 | % | 1,256 | 5.97 | % | 1,606 | 13.95 | % | 1,066 | 13.21 | % | |||||||||||||||||||||||||
| Other construction, land development and other land |
7,837 | 6.56 | % | 3,476 | 5.96 | % | 1,368 | 6.58 | % | — | 0.00 | % | — | 0.00 | % | |||||||||||||||||||||||||
| Real estate - farmland |
17 | 1.07 | % | 27 | 1.06 | % | 71 | 1.19 | % | 36 | 1.32 | % | 84 | 1.27 | % | |||||||||||||||||||||||||
| Real estate - non-farm, non-residential (2): |
||||||||||||||||||||||||||||||||||||||||
| Owner occupied |
2,546 | 17.32 | % | 985 | 17.60 | % | 2,003 | 17.45 | % | 2,569 | 25.11 | % | 2,630 | 25.35 | % | |||||||||||||||||||||||||
| Non-owner occupied |
3,072 | 10.12 | % | 568 | 9.91 | % | 1,018 | 9.62 | % | — | 0.00 | % | — | 0.00 | % | |||||||||||||||||||||||||
| Consumer |
905 | 4.65 | % | 481 | 4.97 | % | 969 | 5.76 | % | 981 | 7.36 | % | 949 | 7.91 | % | |||||||||||||||||||||||||
| Other loans and overdrafts |
280 | 0.42 | % | 215 | 0.56 | % | 84 | 0.78 | % | 55 | 0.18 | % | 54 | 0.05 | % | |||||||||||||||||||||||||
| Total allowance for balance sheet loans |
24,932 | 100.00 | % | 12,155 | 100.00 | % | 10,461 | 100.00 | % | 7,591 | 100.00 | % | 6,904 | 100.00 | % | |||||||||||||||||||||||||
| Unallocated |
356 | — | 81 | 297 | 147 | |||||||||||||||||||||||||||||||||||
| Total allowance for loan losses |
$ | 25,288 | $ | 12,155 | $ | 10,542 | $ | 7,888 | $ | 7,051 | ||||||||||||||||||||||||||||||
(Percent is portfolio loans in category divided by total loans)
| (1) | A break down between 1-4 family residential and all other real estate construction loans is not available for 2007 and 2006. |
| (2) | A break down between owner occupied and non-owner occupied non-farm, non-residential loans is not available for 2007 and 2006. |
The following table presents commercial loans by credit quality indicator at December 31, 2010.
43
Table of Contents
Table 8: Commercial Credit Quality Indicators
| (dollars in thousands) |
Pass | Special Mention |
Substandard | Doubtful | Impaired | Total | ||||||||||||||||||
| Commercial, industrial and agricultural |
$ | 58,812 | $ | 8,187 | $ | 5,228 | $ | 114 | $ | 449 | $ | 72,790 | ||||||||||||
| Real estate - multifamily residential |
10,591 | 1,091 | — | — | — | 11,682 | ||||||||||||||||||
| Real estate - construction: |
||||||||||||||||||||||||
| One to four family residential |
22,642 | 613 | 1,434 | 231 | 534 | 25,454 | ||||||||||||||||||
| Other construction, land development and other land |
17,361 | 4,485 | 10,561 | 156 | 18,278 | 50,841 | ||||||||||||||||||
| Total real estate - construction |
40,003 | 5,098 | 11,995 | 387 | 18,812 | 76,295 | ||||||||||||||||||
| Real estate - farmland |
6,915 | 608 | 781 | — | — | 8,304 | ||||||||||||||||||
| Real estate - non-farm, non-residential: |
||||||||||||||||||||||||
| Owner occupied |
79,335 | 35,989 | 10,185 | 267 | 8,410 | 134,186 | ||||||||||||||||||
| Non-owner occupied |
48,271 | 12,570 | 5,232 | — | 12,323 | 78,396 | ||||||||||||||||||
| Total real estate - non-farm, non-residential |
127,606 | 48,559 | 15,417 | 267 | 20,733 | 212,582 | ||||||||||||||||||
| Total commercial loans |
$ | 243,927 | $ | 63,543 | $ | 33,421 | $ | 768 | $ | 39,994 | $ | 381,653 | ||||||||||||
The following table presents consumer loans, including one to four family residential first and seconds and home equity lines by payment activity at December 31, 2010.
Table 9: Consumer Payment Activity
| (dollars in thousands) |
Performing | Nonperforming | Total | |||||||||
| Real estate - one to four family residential: |
||||||||||||
| Closed end first and seconds |
$ | 248,210 | $ | 12,232 | $ | 260,442 | ||||||
| Home equity lines |
92,533 | 854 | 93,387 | |||||||||
| Total real estate - one to four family residential |
340,743 | 13,086 | 353,829 | |||||||||
| Consumer |
35,588 | 412 | 36,000 | |||||||||
| Other |
3,294 | — | 3,294 | |||||||||
| Total consumer loans |
$ | 379,625 | $ | 13,498 | $ | 393,123 | ||||||
Nonperforming Assets
The past due status of a loan is based on the contractual due date of the most delinquent payment due. Loans, including impaired loans, are generally classified as nonaccrual if they are past due as to maturity or payment of principal or interest for a period of more than 90 days, unless such loans are well-secured and in the process of collection. Loans greater than 90 days past due may remain on an accrual status if management determines it has adequate collateral to cover the principal and interest. If a loan or a portion of a loan is adversely classified, or is partially charged off, the loan is generally classified as nonaccrual. Additionally, whenever management becomes aware of facts or circumstances that may adversely impact the collectability of principal or interest on loans, it is management’s practice to place such loans on a nonaccrual status immediately, rather than delaying such action until the loans become 90 days past due.
When a loan is placed on nonaccrual status, previously accrued and uncollected interest is reversed, and the amortization of related deferred loan fees or costs are suspended. While a loan is classified as nonaccrual and the future collectability of the recorded loan balance is doubtful, collections of interest and principal are generally applied as a reduction to principal outstanding. When the future collectability of the recorded loan balance is expected, interest income may be recognized on a cash basis. In the case where a nonaccrual loan has been partially charged off, recognition of interest on a cash basis is limited to that which would have been recognized on the recorded loan balance at the contractual interest rate. Cash interest receipts in excess of that amount are recorded as recoveries to the allowance for loan losses until prior charge-offs have been fully recovered. These policies are applied consistently across our loan portfolio.
44
Table of Contents
Loans may be returned to accrual status when all principal and interest amounts contractually due (including arrearages) are reasonably assured of repayment within an acceptable period of time, and there is a sustained period of repayment performance by the borrower, in accordance with the contractual terms of interest and principal.
Real estate acquired through, or in lieu of, foreclosure is held for sale and is stated at the lower of cost or estimated fair market value of the property, less estimated disposal costs, if any. Cost includes loan principal and accrued interest. Any excess of cost over the estimated fair market value at the time of acquisition is charged to the allowance for loan losses. The estimated fair market value is reviewed periodically by management and any write-downs are charged against current earnings. Development and improvement costs relating to property are capitalized. Net operating income or expenses of such properties are included in collection, repossession and other real estate owned expenses.
The following table presents information concerning nonperforming assets for the periods indicated.
Table 10: Nonperforming Assets
| December 31, | ||||||||||||||||||||
| (dollars in thousands) |
2010 | 2009 | 2008 | 2007 | 2006 | |||||||||||||||
| Nonaccrual loans* |
$ | 25,858 | $ | 19,321 | $ | 13,574 | $ | 1,449 | $ | 1,400 | ||||||||||
| Loans past due 90 days and accruing interest |
1,836 | 3,090 | 2,590 | 358 | 1,504 | |||||||||||||||
| Total nonperforming loans |
27,694 | 22,411 | 16,164 | 1,807 | 2,904 | |||||||||||||||
| Other real estate owned |
11,617 | 4,136 | 560 | 1,056 | — | |||||||||||||||
| Total nonperforming assets |
$ | 39,311 | $ | 26,547 | $ | 16,724 | $ | 2,863 | $ | 2,904 | ||||||||||
| Nonperforming assets to total loans and other real estate owned |
5.00 | % | 3.10 | % | 2.04 | % | 0.40 | % | 0.45 | % | ||||||||||
| Allowance for loan losses to nonaccrual loans |
97.80 | % | 62.91 | % | 77.66 | % | 544.37 | % | 503.52 | % | ||||||||||
| Net charge-offs to average loans for the year |
1.89 | % | 0.31 | % | 0.24 | % | 0.06 | % | 0.04 | % | ||||||||||
| Allowance for loan losses to year end loans |
3.26 | % | 1.42 | % | 1.29 | % | 1.11 | % | 1.08 | % | ||||||||||
| Foregone interest income on nonaccrual loans |
$ | 1,583 | $ | 893 | $ | 571 | $ | 72 | $ | 45 | ||||||||||
| * | Includes $6.2 million and $696 thousand in nonaccrual TDRs at December 31, 2010 and 2009, respectively. |
The following table presents the changes in the OREO balance for 2010 and 2009.
Table 11: OREO Changes
| December 31, | ||||||||
| (dollars in thousands) | 2010 | 2009 | ||||||
| Balance at the beginning of year, gross |
$ | 4,136 | $ | 560 | ||||
| Transfers from loans |
10,998 | 5,723 | ||||||
| Capitalized costs |
337 | 735 | ||||||
| Sales proceeds |
(2,904 | ) | (3,239 | ) | ||||
| Gain (loss) on disposition |
(22 | ) | 357 | |||||
| Balance at the end of year, gross |
12,545 | 4,136 | ||||||
| Less valuation allowance |
(928 | ) | — | |||||
| Balance at the end of year, net |
$ | 11,617 | $ | 4,136 | ||||
Nonperforming assets were $39.3 million or 5.00% of total loans and other real estate owned at December 31, 2010 compared to $26.5 million or 3.10% at December 31, 2009. This number has steadily increased since 2008 as a result of the continued economic downturn which has significantly increased unemployment, reduced profitability of local businesses, and reduced the ability of many of our customers to keep their loans current. The sluggish economy and the increasing number of weaker loans have prompted the Company to raise the allowance for loan losses, which is 97.80% of nonaccrual loans at December 31, 2010,
45
Table of Contents
compared to 62.91% at December 31, 2009. Nonperforming loans increased $5.3 million or 23.6% during the year ended December 31, 2010 to $27.7 million.
Nonaccrual loans were $25.9 million at December 31, 2010, an increase of $6.5 million or 33.8% from $19.3 million at December 31, 2009. Of the current $25.9 million in nonaccrual loans, $25.0 million or 96.7% is secured by real estate in our market area. Of these real estate secured loans, $9.0 million are residential real estate, $8.0 million are real estate construction and $8.0 million are commercial properties.
Loans past due 90 days and still accruing interest were $1.8 million at December 31, 2010, a decrease of $1.3 million or 40.6% from $3.1 million at December 31, 2009. As of December 31, 2010, all of these loans, except for $64 thousand in credit card loans, are secured by real estate in our market area. Of these real estate secured loans, $1.2 million are residential real estate and $585 thousand are real estate construction.
Other real estate owned at December 31, 2010 was $11.6 million, an increase of $7.5 million or 180.9% from $4.1 million at December 31, 2009. The balance at December 31, 2010 was comprised of 30 properties of which $5.1 million are secured by residential real estate, $5.2 million are secured by real estate construction and $1.3 million are secured by commercial properties. During the year ended December 31, 2010, new foreclosures included properties totaling $11.0 million transferred from loans. Sales of other real estate owned for the year ended December 31, 2010 resulted in a net loss of $22 thousand. At December 31, 2010, there were eleven properties under contract for sale. Subsequent to December 31, 2010, six of the properties under contract for sale at December 31, 2010 have sold resulting in a loss of approximately $48 thousand. The remaining properties are being actively marketed and the Company does not anticipate any material losses associated with these properties. As a direct result of the continued decline in the real estate market, the Company recorded losses of $928 thousand in its consolidated statement of operations for the year ended December 31, 2010, due to valuation adjustments on other real estate owned properties as compared to no such losses in 2009 and $229 thousand in 2008. Asset quality continues to be a top priority for the Company. We continue to allocate significant resources to the expedient disposition and collection of non-performing and other lower quality assets.
As discussed earlier in Item 7, the Company measures impaired loans based on the present value of expected future cash flows discounted at the effective interest rate of the loan or, as a practical expedient, at the loan’s observable market price or the fair value of the collateral if the loan is collateral dependent. The Company maintains a valuation allowance to the extent that the measure of the impaired loan is less than the recorded investment. TDRs occur when we agree to modify the original terms of a loan by granting a concession due to the deterioration in the financial condition of the borrower. TDRs are considered impaired loans. These concessions can be temporary and are done in an attempt to avoid foreclosure and are made with the intent to restore the loan to a performing status once sufficient payment history can be demonstrated. These concessions could include reductions in the interest rate, payment extensions, forgiveness of principal, forbearance or other actions.
The following table presents loans individually evaluated for impairment by class of loans as of December 31, 2010.
Table 12: Impaired Loans
| (dollars in thousands) |
Recorded Investment |
Unpaid Principal Balance |
Recorded Investment With No Allowance |
Recorded Investment With Allowance |
Related Allowance |
Average Recorded Investment |
Interest Income Recognized |
|||||||||||||||||||||
| Commercial, industrial and agricultural |
$ | 449 | $ | 2,639 | $ | 96 | $ | 353 | $ | 343 | $ | 2,868 | $ | 7 | ||||||||||||||
| Real estate - one to four family residential: |
||||||||||||||||||||||||||||
| Closed end first and seconds |
9,463 | 9,837 | 2,763 | 6,700 | 1,247 | 9,241 | 304 | |||||||||||||||||||||
| Real estate - construction: |
||||||||||||||||||||||||||||
| One to four family residential |
534 | 534 | 534 | — | — | 604 | 21 | |||||||||||||||||||||
| Other construction, land development and other land |
18,278 | 20,579 | 14,110 | 4,168 | 2,032 | 11,002 | 696 | |||||||||||||||||||||
| Total real estate - construction |
18,812 | 21,113 | 14,644 | 4,168 | 2,032 | 11,606 | 717 | |||||||||||||||||||||
| Real estate - non-farm, non-residential: |
||||||||||||||||||||||||||||
| Owner occupied |
8,410 | 8,901 | 2,444 | 5,966 | 1,013 | 6,351 | 432 | |||||||||||||||||||||
| Non-owner occupied |
12,323 | 12,553 | 1,925 | 10,398 | 2,264 | 3,492 | 573 | |||||||||||||||||||||
| Total real estate - non-farm, non-residential |
20,733 | 21,454 | 4,369 | 16,364 | 3,277 | 9,843 | 1,005 | |||||||||||||||||||||
| Total loans |
$ | 49,457 | $ | 55,043 | $ | 21,872 | $ | 27,585 | $ | 6,899 | $ | 33,558 | $ | 2,033 | ||||||||||||||
46
Table of Contents
At December 31, 2010, the balance of impaired loans was $49.5 million, for which there were specific valuation allowances of $6.9 million. At December 31, 2009, the balance of impaired loans was $29.4 million, for which there were specific valuation allowances of $5.8 million. The average balance of impaired loans was $33.6 million for 2010, $21.8 million for 2009 and $8.6 million for 2008. The Company’s balance of impaired loans has increased since 2008 as a result of the economic downturn which has significantly increased unemployment, reduced profitability of local businesses, and reduced the ability of many of our customers to keep their loans current.
The following table presents the balances of TDRs at December 31, 2010 and 2009.
Table 13: Troubled Debt Restructurings (TDRs)
| December 31, | ||||||||
| (dollars in thousands) | 2010 | 2009 | ||||||
| Performing TDRs |
$ | 2,411 | $ | 6,003 | ||||
| Nonaccrual TDRs* |
6,177 | 696 | ||||||
| Total TDRs |
$ | 8,588 | $ | 6,699 | ||||
| * | Included in nonaccrual loans in Table 10: Nonperforming Assets. |
At the time of a TDR, the loan is placed on nonaccrual status. A loan may be returned to accrual status if the borrower has demonstrated a sustained period of repayment performance (typically six months) in accordance with the contractual terms of the loan and there is reasonable assurance the borrower will continue to make payments as agreed.
Financial Condition
Summary
Total assets were $1.1 billion at December 31, 2010, a decrease of $7.0 million or 0.62% from $1.1 billion at December 31, 2009. While total assets have remained fairly stable during 2010, the composition of our balance sheet has changed significantly. Loans have decreased as a result of weak loan demand, increased charge-offs, payment curtailments on outstanding credits and the aforementioned loan sale during the third quarter of 2010. The investment portfolio significantly increased during 2010 as a result of our continued effort to restructure its composition, including deployment of excess cash strategically as investment opportunities are available and the reinvestment of the proceeds from the loan sale. The decline in net loans and increase in securities available for sale during 2010 are responsible for the significant majority of the changes to our balance sheet during the year.
While the Company’s deposit initiatives have been successful in bringing in noninterest and lower cost interest-bearing transactional account balances, 2010 saw a further decrease in time deposits (certificates). In the near term, the Company plans to continue to focus on attracting lower cost funds. However, as the economy improves and loan demand increases, we are developing strategies to fix our funding at low rates over longer terms before interest rates start to rise significantly.
At December 31, 2010, our total outstanding borrowings, short-term and long-term, with the FHLB were $142.5 million, an increase of $19.3 million or 15.7% from the $123.2 million at December 31, 2009. At the end of the year, the Company borrowed $25.0 million in short-term advances from the FHLB which allowed us to acquire certain investment securities and lock in the investment yields. Subsequent to year end, this borrowing was repaid. The growth in our lower cost deposits, combined with the lower loan demand allowed the Company to also retire at $5.7 million long-term FHLB advance upon maturity early in 2010.
Loan Portfolio
The Company offers an array of lending and credit services to customers including mortgage, commercial and consumer loans. A substantial portion of the loan portfolio is represented by commercial and residential mortgage loans in our market area. The ability of our debtors to honor their contracts is dependent upon the real estate and general economic conditions in our market area. The loan portfolio is the largest component of earning assets and accounts for the greatest portion of total interest income.
47
Table of Contents
Total loans were $774.8 million at December 31, 2010, a decrease of $78.3 million or 9.2% from $853.1 million at December 31, 2009. As previously mentioned our loan portfolio has substantially decreased as a result of weak loan demand, increased charge-offs, payment curtailments on outstanding credits and the aforementioned loan sale.
The following table presents the composition of the loan portfolio at the dates indicated.
Table 14: Summary of Loans
| December 31, | ||||||||||||||||||||||||||||||||||||||||
| 2010 | 2009 | 2008 | 2007 | 2006 | ||||||||||||||||||||||||||||||||||||
| (dollars in thousands) |
Amount | Percent | Amount | Percent | Amount | Percent | Amount | Percent | Amount | Percent | ||||||||||||||||||||||||||||||
| Commercial, industrial and agricultural |
$ | 72,790 | 9.39 | % | $ | 82,563 | 9.68 | % | $ | 69,024 | 8.42 | % | $ | 60,778 | 8.57 | % | $ | 59,859 | 9.20 | % | ||||||||||||||||||||
| Real estate - one to four family residential: |
||||||||||||||||||||||||||||||||||||||||
| Closed end first and seconds |
260,442 | 33.62 | % | 297,675 | 34.89 | % | 287,973 | 35.15 | % | 270,557 | 38.17 | % | 255,742 | 39.31 | % | |||||||||||||||||||||||||
| Home equity lines |
93,387 | 12.05 | % | 86,084 | 10.09 | % | 66,772 | 8.14 | % | 34,339 | 4.84 | % | 22,660 | 3.47 | % | |||||||||||||||||||||||||
| Total real estate - one to four family residential |
353,829 | 45.67 | % | 383,759 | 44.98 | % | 354,745 | 43.29 | % | 304,896 | 43.01 | % | 278,402 | 42.78 | % | |||||||||||||||||||||||||
| Real estate - multifamily residential |
11,682 | 1.51 | % | 8,141 | 0.95 | % | 7,678 | 0.94 | % | 3,579 | 0.50 | % | 1,493 | 0.23 | % | |||||||||||||||||||||||||
| Real estate - construction (1): |
||||||||||||||||||||||||||||||||||||||||
| One to four family residential |
25,454 | 3.29 | % | 36,930 | 4.33 | % | 48,871 | 5.97 | % | 98,877 | 13.95 | % | 85,910 | 13.21 | % | |||||||||||||||||||||||||
| Other construction, land development and other land |
50,841 | 6.56 | % | 50,852 | 5.96 | % | 53,966 | 6.58 | % | — | 0.00 | % | — | 0.00 | % | |||||||||||||||||||||||||
| Total real estate - construction |
76,295 | 9.85 | % | 87,782 | 10.29 | % | 102,837 | 12.55 | % | 98,877 | 13.95 | % | 85,910 | 13.21 | % | |||||||||||||||||||||||||
| Real estate - farmland |
8,304 | 1.07 | % | 8,946 | 1.06 | % | 9,644 | 1.19 | % | 9,292 | 1.32 | % | 8,219 | 1.27 | % | |||||||||||||||||||||||||
| Real estate - non-farm, non-residential (2): |
||||||||||||||||||||||||||||||||||||||||
| Owner occupied |
134,186 | 17.32 | % | 150,119 | 17.60 | % | 142,946 | 17.45 | % | 178,011 | 25.11 | % | 164,948 | 25.35 | % | |||||||||||||||||||||||||
| Non-owner occupied |
78,396 | 10.12 | % | 84,557 | 9.91 | % | 78,823 | 9.62 | % | — | 0.00 | % | — | 0.00 | % | |||||||||||||||||||||||||
| Total real estate - non-farm, non-residential |
212,582 | 27.44 | % | 234,676 | 27.51 | % | 221,769 | 27.07 | % | 178,011 | 25.11 | % | 164,948 | 25.35 | % | |||||||||||||||||||||||||
| Consumer |
36,000 | 4.65 | % | 42,416 | 4.97 | % | 47,226 | 5.76 | % | 52,170 | 7.36 | % | 51,446 | 7.91 | % | |||||||||||||||||||||||||
| Other |
3,294 | 0.42 | % | 4,786 | 0.56 | % | 6,354 | 0.78 | % | 1,243 | 0.18 | % | 305 | 0.05 | % | |||||||||||||||||||||||||
| Total loans |
774,776 | 100.00 | % | 853,069 | 100.00 | % | 819,277 | 100.00 | % | 708,846 | 100.00 | % | 650,582 | 100.00 | % | |||||||||||||||||||||||||
| Less unearned income |
(2 | ) | (6 | ) | (11 | ) | (29 | ) | (90 | ) | ||||||||||||||||||||||||||||||
| Less allowance for loan losses |
(25,288 | ) | (12,155 | ) | (10,542 | ) | (7,888 | ) | (7,051 | ) | ||||||||||||||||||||||||||||||
| Loans, net |
$ | 749,486 | $ | 840,908 | $ | 808,724 | $ | 700,929 | $ | 643,441 | ||||||||||||||||||||||||||||||
| (1) | A break down between 1-4 family residential and all other real estate construction loans is not available for 2007 and 2006. |
| (2) | A break down between owner occupied and non-owner occupied commercial real estate loans is not available for 2007 and 2006. |
The following table presents the remaining maturities of loans held in the portfolio at December 31, 2010.
48
Table of Contents
Table 15: Remaining Maturities of Loans
| December 31, 2010 | ||||||||||||||||||||||||||||||||||||
| Variable Rate | Fixed Rate | |||||||||||||||||||||||||||||||||||
| (dollars in thousands) | With 1 year | 1 to 5 years | After 5 years | Total | With 1 year | 1 to 5 years | After 5 years | Total | Total Maturities |
|||||||||||||||||||||||||||
| Commercial, industrial and agricultural loans |
$ | 4,914 | $ | 3,917 | $ | 71 | $ | 8,901 | $ | 44,210 | $ | 14,403 | $ | 5,276 | $ | 63,889 | $ | 72,790 | ||||||||||||||||||
| Real estate - one to four family residential: |
||||||||||||||||||||||||||||||||||||
| Closed end first and seconds |
44,899 | 95,108 | 14,948 | 154,955 | 23,803 | 10,757 | 70,927 | 105,487 | 260,442 | |||||||||||||||||||||||||||
| Home equity lines |
41,992 | 56 | — | 42,048 | 9,363 | 406 | 41,570 | 51,339 | 93,387 | |||||||||||||||||||||||||||
| Real estate - multifamily residential |
52 | 4,262 | — | 4,314 | 439 | — | 6,929 | 7,368 | 11,682 | |||||||||||||||||||||||||||
| Real estate - construction: |
||||||||||||||||||||||||||||||||||||
| One to four family residential |
4,954 | 2,983 | 438 | 8,375 | 13,573 | 1,185 | 2,320 | 17,079 | 25,454 | |||||||||||||||||||||||||||
| Other construction, land development and other land |
13,432 | 2,923 | — | 16,355 | 20,246 | 13,016 | 1,224 | 34,487 | 50,841 | |||||||||||||||||||||||||||
| Real estate - Farmland |
1,268 | 3,204 | 368 | 4,840 | 2,348 | 83 | 1,033 | 3,464 | 8,304 | |||||||||||||||||||||||||||
| Real estate - non-farm, non-residential: |
||||||||||||||||||||||||||||||||||||
| Owner occupied |
26,036 | 48,730 | 298 | 75,063 | 20,562 | 5,868 | 32,693 | 59,123 | 134,186 | |||||||||||||||||||||||||||
| Non-owner occupied |
12,016 | 39,034 | 104 | 51,154 | 15,733 | 3,173 | 8,336 | 27,242 | 78,396 | |||||||||||||||||||||||||||
| Consumer |
3,157 | 63 | — | 3,220 | 8,450 | 10,563 | 13,767 | 32,780 | 36,000 | |||||||||||||||||||||||||||
| Other |
— | 135 | — | 135 | 2,937 | 222 | — | 3,159 | 3,294 | |||||||||||||||||||||||||||
| Total loans |
$ | 152,720 | $ | 200,414 | $ | 16,227 | $ | 369,360 | $ | 161,664 | $ | 59,676 | $ | 184,075 | $ | 405,415 | $ | 774,776 | ||||||||||||||||||
The principal risk associated with each of the categories of loans in our portfolio is the creditworthiness of our borrowers. Within each category, such risk is increased or decreased, depending on various factors. The risks associated with real estate mortgage loans, commercial loans and consumer loans vary based on employment levels, consumer confidence, fluctuations in the value of real estate and other conditions that affect the ability of borrowers to repay indebtedness. The risk associated with real estate construction loans varies based on the supply and demand for the type of real estate under construction. In an effort to manage these risks, we have loan approval limits for individual loan officers based on their position and level of experience.
We have written policies and procedures to help manage credit risk. We use a loan review process that includes a portfolio management strategy, guidelines for underwriting standards and risk assessment, procedures for ongoing identification and management of credit deterioration, and regular independent third party portfolio reviews to establish loss exposure and to monitor compliance with policies. Third party reviews are done on an annual basis by a consulting firm that is comprised of experienced commercial lenders who understand the laws, regulations and critical areas of portfolio management. They provide management with an unbiased opinion of our credits and actions needed to strengthen them or protect the company.
Our loan approval process includes our Management Loan Committee, Directors Loan Committee and, for larger loans, the Board of Directors. Our Chief Credit Officer is responsible for reporting to the Directors Loan Committee monthly on the activities of the Management Loan Committee and on the status of various delinquent and nonperforming loans. The Directors Loan Committee also reviews lending policies proposed by management. Our Board of Directors establishes our total lending limit policy which is less than the legal lending limit.
One to four family residential real estate loans continue to be the largest component of the portfolio. At December 31, 2010 these loans were $353.8 million or 45.7% of the portfolio, a decrease of $29.9 million or 7.8% from $383.8 million or 45.0% of the portfolio at December 31, 2009. Closed end first and seconds were $260.4 million at December 31, 2010, a decrease of $37.2 million or 12.5% from $297.7 million at December 31, 2009. Home equity lines were $93.4 million at December 31, 2010, an increase of $7.3 million or 8.5% from $86.1 million at December 31, 2009. During 2010, this category was heavily impacted by the $27.8 million in loans sold, although one to four family residential real estate loans increased slightly as a percentage of the total loan portfolio due to greater proportionate decreases during 2010 in the other loan segments. At December 31, 2010, non-farm, non-residential (commercial) real estate loans were $212.6 million or 27.4% of the portfolio, a decrease of $22.1 million or 9.4% from $234.7 million or 27.5% of the portfolio at December 31, 2009. Owner occupied loans were $134.2 million at December 31, 2010, a decrease of $15.9 million or 10.6% from $150.1 million at December 31, 2009. Non-owner occupied loans were $78.4 million at December 31, 2010, a decrease of $6.2 million or 7.3% from $84.6 million at December 31, 2009. At December 31, 2010, real estate construction loans were $76.3 million or 9.9% of the portfolio, a
49
Table of Contents
decrease of $11.5 million or 13.1% from $87.8 million or 10.3% of the portfolio at December 31, 2009. One to four family real estate construction loans were $25.5 million at December 31, 2010, a decrease of $11.5 million or 31.1% from December 31, 2009. Other real estate construction loans were $50.8 million at December 31, 2010, a decrease of $11 thousand or 0.02% from $50.9 million at December 31, 2009. At December 31, 2010, commercial, industrial and agricultural loans were $72.8 million or 9.4% of the portfolio, a decrease of $9.8 million or 11.8% from $82.6 million or 9.7% of the portfolio at December 31, 2009. At December 31, 2010, consumer loans were $36.0 million or 4.7% of the portfolio, a decrease of $6.4 million or 15.1% from $42.4 million at December 31, 2009. At December 31, 2010, multifamily residential real estate loans were $11.7 million or 1.5% of the portfolio, an increase of $3.5 million or 43.5% from $8.1 million or 1.0% of the portfolio at December 31, 2009. At December 31, 2010, farmland real estate loans were $8.3 million or 1.1% of the portfolio, a decrease of $642 thousand or 7.2% from $8.9 million or 1.1% of the portfolio at December 31, 2009. At December 31, 2010, other loans were $3.3 million or 0.4% of the portfolio, a decrease of $1.5 million or 31.2% from $4.8 million at December 31, 2009.
At December 31, 2010, loans secured by real estate were $662.7 million or 85.5% of the portfolio, compared to $723.3 million or 84.8% of the portfolio at December 31, 2009.
Consistent with our focus on providing community-based financial services, we generally do not make loans outside of our principal market region. We do not engage in foreign lending activities and consequently the loan portfolio is not exposed to the sometimes volatile risk from foreign credits. We further maintain a policy not to originate or purchase loans classified by regulators as highly leveraged transactions or loans to foreign entities or individuals. Historically, our loan collateral has been primarily real estate because of the nature of our market region; however, in our newer markets at the fringe of our market foot print, we are encountering other collateral options, which in lieu of real estate, are booked based on strong credit guidelines and controls to monitor the status of the collateral.
Investment Securities
The investment portfolio plays a primary role in the management of the Company’s interest rate sensitivity. In addition, the portfolio serves as a source of liquidity and is used as needed to meet collateral requirements, such as those related to secure public deposits, balances with the Federal Reserve Bank and repurchase agreements. The investment portfolio consists of securities available for sale, which may be sold in response to changes in market interest rates, changes in prepayment risk, increases in loan demand, general liquidity needs and other similar factors. These securities are carried at estimated fair value. Total investment securities were $246.1 million at December 31, 2010, reflecting an increase of $76.7 million or 45.3% from $169.4 million at December 31, 2009. The valuation allowance for the available for sale portfolio had an unrealized loss, net of tax benefit, of $2.2 million at December 31, 2010 compared with an unrealized gain, net of tax expense, of $745 thousand at December 31, 2009.
The investment portfolio significantly increased during 2010 as a result of our continued effort to restructure its composition and to increase the portfolio size as a percentage of assets. As part of our overall asset liability management strategy, we are targeting our investment portfolio to be approximately 20% of our total assets. As of December 31, 2010 and 2009, our investment portfolio was 22.0% and 15.0%, respectively of total assets. This growth was the result of excess funding provided by the increase in deposits, decreased loan demand and the reinvestment of the proceeds from the loan sale. In 2010, management began allocating a substantial percentage of the investment portfolio to SBA Pool securities. These securities are modified mortgage pass-through securities that are assembled using the guaranteed portions of SBA loans and as such are unconditionally guaranteed as to principal and accrued interest by the U.S. Government. Management began investing in these SBA Pool securities because they qualify as 0% risk weighted assets, which more efficiently uses capital to produce a reasonable rate of return. Approximately 48.9% of the SBA Pool securities are adjustable rate products which will assist the Company with mitigating interest rate risk. In addition, these securities provide a pledgable investment for liquidity planning purposes.
There are no securities classified as “Held to Maturity” or “Trading.” Our mortgage-backed securities consist entirely of residential mortgage-backed securities. We do not hold any commercial mortgage-backed securities. Our mortgage-backed securities are all agency backed and AAA-rated with no subprime issues. We follow a policy of not engaging in activities considered to be derivative in nature such as options, futures, swaps or forward commitments. We consider derivatives to be speculative in nature and contrary to our historical investment philosophy.
Our pooled trust preferred securities include one senior issue of Preferred Term Securities XXVII which is current on all payments and on which we took an impairment charge in the third quarter of 2009 to reduce our book value to the market value
50
Table of Contents
at September 30, 2009. As of December 31, 2010, that security has an estimated fair value that is $26 thousand greater than its amortized cost after impairment. During the second quarter of 2010 we recognized an impairment charge in the amount of $77 thousand on our investment in Preferred Term Securities XXIII mezzanine tranche, thus reducing the book value to $0. The decision to recognize the other-than-temporary impairment was based upon an analysis of the market value of the discounted cash flow for the security as provided by Moody’s at June 30, 2010, which indicated that the Company was unlikely to recover any of its remaining investment in this security.
The following table presents the amortized cost and estimated fair value of securities at the dates indicated.
Table 16: Investment Securities Available for Sale
| December 31, 2010 | December 31, 2009 | December 31, 2008 | ||||||||||||||||||||||
| (dollars in thousands) | Amortized Cost |
Estimated Fair Value |
Amortized Cost |
Estimated Fair Value |
Amortized Cost |
Estimated Fair Value |
||||||||||||||||||
| Available for Sale: |
||||||||||||||||||||||||
| Obligations of U.S. Government agencies |
$ | 23,982 | $ | 23,829 | $ | 34,180 | $ | 34,522 | $ | 33,149 | $ | 33,619 | ||||||||||||
| SBA Pool securities |
62,685 | 61,890 | — | — | — | — | ||||||||||||||||||
| Agency mortgage-backed securities |
46,780 | 46,284 | 39,774 | 41,481 | 50,419 | 51,481 | ||||||||||||||||||
| Agency CMO securities |
41,855 | 41,477 | 29,727 | 29,992 | 11,256 | 11,472 | ||||||||||||||||||
| Non agency CMO securities |
12,093 | 12,042 | 5,149 | 5,145 | 6,676 | 6,199 | ||||||||||||||||||
| State and political subdivisions |
58,780 | 57,346 | 47,938 | 48,072 | 39,376 | 39,241 | ||||||||||||||||||
| Pooled trust preferred securities |
545 | 571 | 632 | 688 | 19,075 | 3,582 | ||||||||||||||||||
| FNMA and FHLMC preferred stock |
77 | 89 | 77 | 126 | 94 | 94 | ||||||||||||||||||
| Corporate securities |
2,597 | 2,592 | 10,819 | 9,416 | 10,802 | 6,957 | ||||||||||||||||||
| Total |
$ | 249,394 | $ | 246,120 | $ | 168,296 | $ | 169,442 | $ | 170,847 | $ | 152,645 | ||||||||||||
The Company reviews the investment securities portfolio on a quarterly basis to monitor its exposure to other-than-temporary impairment that may result due to the current adverse economic conditions and associated credit deterioration. Based on the Company’s evaluation, management does not believe any remaining unrealized loss at December 31, 2010, represents an other-than-temporary impairment as these unrealized losses are primarily attributable to changes in interest rates and the current volatile market conditions, and not credit deterioration. At December 31, 2010, there are 104 debt securities with fair values totaling $191.2 million considered temporarily impaired. Of these debt securities, 100 with fair values totaling $189.0 million were in an unrealized loss position of less than 12 months and 4 with fair values totaling $2.2 million were in an unrealized loss position of 12 months or more. Because the Company intends to hold these investments in debt securities to maturity and it is more likely than not that the Company will not be required to sell these investments before a recovery of unrealized losses, the Company does not consider these investments to be other-than-temporarily impaired at December 31, 2010 and no impairment has been recognized. At December 31, 2010, there is 1 equity security with a fair value of $22 thousand in an unrealized loss position of less than 12 months. The Company has the intent and ability to hold this equity security until a recovery of the unrealized loss and therefore does not consider this investment to be other-than-temporarily impaired at December 31, 2010.
However, in the event that the Company is required or decides to use its investment securities portfolio in 2011 to manage its liquidity position, the Company may sell a portion of the securities in a temporary unrealized loss position before these securities recover their fair value, which would result in the Company recognizing losses on the sale of investment securities.
The following table presents the maturity and yields of securities at their amortized cost at the date indicated.
51
Table of Contents
Table 17: Maturity and Yields of Securities
| December 31, 2010 | ||||||||||||||||||||||||||||||||||||||||
| Maturing within 1 year |
Maturing after 1 year, but within 5 years |
Maturing after 5 years, but within 10 years |
Maturing after 10 years |
Total | ||||||||||||||||||||||||||||||||||||
| Available for Sale: | Amortized Cost |
Weighted Average Yield |
Amortized Cost |
Weighted Average Yield |
Amortized Cost |
Weighted Average Yield |
Amortized Cost |
Weighted Average Yield |
Amortized Cost |
Weighted Average Yield |
||||||||||||||||||||||||||||||
| Obligations of U.S. Government Agencies |
$ | 20,000 | 0.00 | % | $ | — | 0.00 | % | $ | 3,982 | 2.56 | % | $ | — | 0.00 | % | $ | 23,982 | 2.56 | % | ||||||||||||||||||||
| SBA Pool Securities - Fixed |
— | 0.00 | % | 11,304 | 3.14 | % | 21,096 | 3.86 | % | — | 0.00 | % | 32,400 | 3.62 | % | |||||||||||||||||||||||||
| SBA Pool Securities - Variable |
— | 0.00 | % | 4,001 | 0.79 | % | 26,284 | 1.55 | % | — | 0.00 | % | 30,285 | 1.45 | % | |||||||||||||||||||||||||
| Agency mortgage-backed securities |
— | 0.00 | % | 35,098 | 2.30 | % | 11,682 | 3.21 | % | — | 0.00 | % | 46,780 | 2.53 | % | |||||||||||||||||||||||||
| Agency and Non agency CMO securities |
2,590 | 2.92 | % | 18,925 | 2.85 | % | 32,433 | 3.44 | % | — | 0.00 | % | 53,948 | 3.21 | % | |||||||||||||||||||||||||
| State and political subdivisions |
540 | 7.27 | % | 1,648 | 6.21 | % | 31,674 | 5.35 | % | 24,918 | 5.93 | % | 58,780 | 5.64 | % | |||||||||||||||||||||||||
| Pooled trust preferred securities |
545 | 0.60 | % | — | 0.00 | % | — | 0.00 | % | — | 0.00 | % | 545 | 0.60 | % | |||||||||||||||||||||||||
| FNMA and FHLMC preferred stock |
— | 0.00 | % | — | 0.00 | % | — | 0.00 | % | 77 | 0.00 | % | 77 | 0.00 | % | |||||||||||||||||||||||||
| Corporate securities |
— | 0.00 | % | 1,597 | 2.85 | % | 1,000 | 3.32 | % | — | 0.00 | % | 2,597 | 3.01 | % | |||||||||||||||||||||||||
| Total |
$ | 23,675 | 0.50 | % | $ | 72,573 | 2.59 | % | $ | 128,151 | 3.55 | % | $ | 24,995 | 5.93 | % | $ | 249,394 | 3.22 | % | ||||||||||||||||||||
| * | Yields on tax-exempt securities have been computed on a taxable-equivalent basis. |
Deposits
The Company’s predominant source of funds is depository accounts. The Company’s deposit base, which is provided by individuals and businesses located within the communities served, is comprised of demand deposits, savings and money market accounts, and time deposits. The Company augments its deposit base through conservative use of brokered deposits, including through the Certificate of Deposit Account Registry Service program (“CDARS”). The Company’s balance sheet growth is largely determined by the availability of deposits in its markets, the cost of attracting the deposits and the prospects of profitably utilizing the available deposits by increasing the loan or investment portfolios.
Total deposits were $868.1 million as of December 31, 2010, an increase of 1.3% or $11.5 million over 2009. This is a continuation of the growth experienced in 2009 of $39.2 million or 4.8% to $856.6 million. Noninterest-bearing demand deposits increased $3.8 million or 4.1% during 2010 following a decrease of $740 thousand or 0.8% during 2009. Interest-bearing demand deposits increased $18.8 million or 8.5% during 2010 following an increase of $63.8 million or 40.4% during 2009. Savings deposits increased $968 thousand or 1.3% during 2010 following an increase of $5.5 million or 7.8% during 2009. Time deposits decreased $33.8 million or 9.2% during 2010 following a decrease of $66.8 million or 15.4% during 2009. The Company continues to see a shift from interest-bearing time deposits to lower cost non-maturity interest-bearing deposits as our consumers are willing to forego the higher yield on longer-term products in order to have more readily available access to their funds. The Company believes the overall growth in deposits is a result of the Company’s competitive interest rates on all deposit products, special deposit promotions and product enhancements, as well as the Company’s continued marketing efforts surrounding the successful Reward Checking program. This product, which has continually grown since its introduction in late 2006, pays an above market interest rate if the customer achieves some basic requirements that encourage the utilization of electronic transactions which are less costly to the Company. Also, included in time deposits at December 31, 2010, 2009 and 2008 were $38.4 million, $43.0 million and $55.0 million, respectively in broker certificates of deposits. The interest rates paid on these deposits are consistent, if not lower, than the market rates offered in our local area. Amounts included in these brokered certificates of deposits also include deposits under the CDARS program.
Interest rates paid on specific deposit types are set by management through its Rate Committee and are determined based on (i) the interest rates offered by competitors, (ii) anticipated amount and timing of funding needs, (iii) availability of and cost of alternative sources of funding and (iv) anticipated future economic conditions and interest rates. Customer deposits are attractive sources of liquidity because of their stability, cost and the ability to generate fee income through the cross-sale of other services to the depositors. The Company will continue funding assets with deposit liability accounts and focus upon core deposit growth as its primary source of liquidity and stability.
52
Table of Contents
The following table presents average deposit balances and average rates paid for the periods indicated.
Table 18: Average Deposits and Average Rates Paid
| Years Ended December 31, | ||||||||||||||||||||||||
| 2010 | 2009 | 2008 | ||||||||||||||||||||||
| (dollars in thousands) |
Balance | Rate | Balance | Rate | Balance | Rate | ||||||||||||||||||
| Noninterest-bearing demand deposits |
$ | 100,970 | $ | 96,220 | $ | 99,763 | ||||||||||||||||||
| Interest-bearing deposits: |
||||||||||||||||||||||||
| Checking |
229,637 | 1.26 | % | 185,436 | 1.52 | % | 144,558 | 2.02 | % | |||||||||||||||
| Savings |
77,122 | 0.61 | % | 74,081 | 0.73 | % | 74,667 | 0.90 | % | |||||||||||||||
| Money market savings |
99,924 | 1.28 | % | 84,192 | 1.62 | % | 52,321 | 2.40 | % | |||||||||||||||
| Time deposits $100 thousand and over |
162,176 | 2.20 | % | 177,650 | 3.34 | % | 143,115 | 4.46 | % | |||||||||||||||
| Other time deposits |
188,436 | 2.18 | % | 235,097 | 3.23 | % | 242,184 | 3.76 | % | |||||||||||||||
| Total interest-bearing deposits |
757,295 | 1.63 | % | 756,456 | 2.41 | % | 656,845 | 3.10 | % | |||||||||||||||
| Total deposits |
$ | 858,265 | $ | 852,676 | $ | 756,608 | ||||||||||||||||||
The following table presents the maturity schedule of time deposits $100 thousand and over at the date indicated.
Table 19: Maturities of Time Deposits $100 Thousand and Over
| (dollars in thousands) | December 31, 2010 |
|||
| 3 months or less |
$ | 24,297 | ||
| 3 - 6 months |
— | |||
| 6 - 12 months |
63,977 | |||
| Over 12 months |
73,014 | |||
| Total |
$ | 161,288 | ||
Borrowings
The Company’s ability to borrow funds through nondeposit sources provides additional flexibility in meeting the liquidity needs of customers while enhancing its cost of funds structure.
In addition to deposits, the Company utilizes short-term borrowings from the FHLB to fund its day to day operations. Short-term borrowings also include repurchase agreements, which are secured transactions with customers and generally mature the day following the day sold, and overnight unsecured fed funds lines with three correspondent banks. Long-term borrowings consist of advances from the FHLB. All FHLB advances are secured by a blanket floating lien on all of the Company’s qualifying closed-end and revolving open-end loans that are secured by 1-4 family residential properties. For further information concerning the Company’s borrowings, refer to Item 8. “Financial Statements and Supplementary Data,” under the heading “Note 7. Borrowings.”
On September 17, 2003, $10 million of trust preferred securities were placed through EVB Statutory Trust I in a pooled underwriting totaling approximately $650 million. The trust issuer has invested the total proceeds from the sale of the Trust Preferred in Floating Rate Junior Subordinated Deferrable Interest Debentures (the “Junior Subordinated Debentures”) issued by the Parent. The trust preferred securities pay cumulative cash distributions quarterly at a variable rate per annum, reset quarterly, equal to the 3-month LIBOR plus 2.95%. As of December 31, 2010 and 2009, the interest rate was 3.25% and 3.20%, respectively. The dividends paid to holders of the trust preferred securities, which are recorded as interest expense, are deductible for income tax purposes. The trust preferred securities have a mandatory redemption date of September 17, 2033, and became subject to varying call provisions beginning September 17, 2008. The Parent has fully and unconditionally guaranteed the trust preferred securities through the combined operation of the debentures and other related documents. The Parent’s obligation under the guarantee is unsecured and subordinate to senior and subordinated indebtedness of the Parent.
53
Table of Contents
On February 17, 2011, the Company entered into a written agreement with the Federal Reserve and the Bureau. Under the terms of this written agreement, the Company may not make payments on its outstanding Junior Subordinated Debentures relating to the trust preferred securities without prior regulatory approval. For further information concerning the Company’s trust preferred debt, refer to Item 8. “Financial Statements and Supplementary Data,” under the heading “Note 8. Trust Preferred Debt.”
Capital Resources
The assessment of capital adequacy depends on such factors as asset quality, liquidity, earnings performance, and changing competitive conditions and economic forces. The Company regularly reviews the adequacy of the Company’s capital. The Company maintains a structure that it believes will assure an adequate level of capital to support anticipated asset growth and to absorb potential losses.
While the Company will continue to look for opportunities to invest capital in profitable growth, share purchases are another tool that facilitate improving shareholder return, as measured by ROE and earnings per share. However, in connection with the Company’s participation in the Capital Purchase Program and the Company entering into a Written Agreement with its regulators, both as previously described, certain limitations on the Company’s ability to repurchase its common stock have been imposed. For more information on both of these restrictions, see Item 8. “Financial Statements and Supplementary Data,” under the headings “Note 21. Preferred Stock and Warrant” and “Note 24. Common Stock Repurchases.”
The Company’s capital position continues to exceed regulatory minimum requirements. The primary indicators relied on by bank regulators in measuring the capital position are the Tier 1 capital, total risk-based capital, and leverage ratios, as previously described in the “Regulation and Supervision” section of Item 1. The Company’s Tier 1 leverage ratio was 7.38% at December 31, 2010, compared with 9.08% at December 31, 2009. The Tier 1 capital to risk-weighted assets ratio was 10.51% at December 31, 2010, compared with 11.60% at December 31, 2009. The total capital to risk-weighted assets ratio was 11.70% at December 31, 2010, compared with 12.29% at December 31, 2009. These ratios are in excess of the mandated minimum requirements. These ratios include the trust preferred securities issued in September 2003, as well as the $24.0 million of Series A Preferred Stock sold to the Treasury under its Capital Purchase Program in January 2009, in Tier 1 capital for regulatory capital adequacy determination purposes.
Total shareholders’ equity was $91.4 million at December 31, 2010, compared with $105.2 million at December 31, 2009. During 2010, the Company declared common stock dividends of $0.12 per share, compared to $0.31 per share declared in 2009 and $0.64 per share in 2008. The dividend payout ratio, based on net income available to common shareholders, was not meaningful for 2010 and 2009 due to the net loss recorded by the Company, and was 123.0% in 2008.
In December 2010, the Basel Committee on Banking Supervision (the “Basel Committee”) released its final framework for strengthening international capital and liquidity regulation, now officially identified by the Basel Committee as “Basel III”. Basel III, when implemented by the U.S. banking agencies and fully phased-in, will require bank holding companies and their bank subsidiaries to maintain substantially more capital, with a greater emphasis on common equity. As discussed in Item 1. “Business” under the heading “Regulation and Supervision”, Basel III will be initially phased in on January 1, 2013 and fully phased in on January 1, 2019. The U.S. banking agencies have indicated informally that they expect to propose regulations implementing Basel III in mid-2011 with final adoption of implementing regulations in mid-2012.
In addition to Basel III, Dodd-Frank requires or permits the U.S. banking agencies to adopt regulations affecting banking institutions’ capital requirements in a number of respects, including potentially more stringent capital requirements for systemically important financial institutions. Accordingly, the regulations ultimately applicable to the Company may be substantially different from the Basel III final framework as published in December 2010. Requirements to maintain higher levels of capital or to maintain higher levels of liquid assets could adversely impact the Company’s net income and return on equity.
Off-Balance Sheet Arrangements
In the normal course of business, the Company is a party to financial instruments with off-balance sheet risk. These financial instruments include commitments to extend credit and standby letters of credit and involve, to varying degrees, elements of credit and interest rate risk in excess of the amount recognized in the balance sheet. The contract or notional amounts of these instruments reflect the extent of the Company’s involvement in particular classes of financial instruments.
54
Table of Contents
The Company’s exposure to credit loss in the event of nonperformance by the other party to the financial instrument for commitments to extend credit and standby letters of credit is represented by the contractual notional amount of those instruments. The Company uses the same credit policies in making commitments and conditional obligations as it does for on-balance sheet instruments.
Unless otherwise noted, the Company does not require collateral or other security to support financial instruments with credit risk.
Commitments to extend credit are agreements to lend to a customer as long as there is no violation of any condition established in the contract. Commitments generally have fixed expiration dates or other termination clauses and may require payment of a fee. Because many of the commitments are expected to expire without being drawn upon, the total commitment amounts do not necessarily represent future cash requirements. The Company evaluates each customer’s credit worthiness on a case-by-case basis. The amount of collateral obtained, if deemed necessary by the Company upon extension of credit, is based on management’s credit evaluation of the counterparty. Collateral held varies but may include property, plant and equipment and income-producing commercial properties. Our unfunded loan commitments, excluding credit card lines and letters of credit, are used in large part to meet seasonal funding needs which are generally higher from spring through fall than at year end.
Unfunded commitments under commercial lines of credit, revolving credit lines and overdraft protection agreements are commitments for possible future extensions of credit to existing customers. These lines of credit are usually uncollateralized and do not always contain a specified maturity date and may not be drawn upon to the total extent to which we are committed. The total amount of unused loan commitments was $121.2 million at December 31, 2010 and $118.1 million at December 31, 2009.
Standby letters of credit are conditional commitments issued by the Company to guarantee the performance of a customer to a third party. The credit risk involved in issuing letters of credit is essentially the same as that involved in extending loan facilities to customers. The Company has not incurred any losses on its commitments in either 2010 or 2009. The total amount of standby letters of credit was $6.5 million at December 31, 2010 and $5.1 million at December 31, 2009.
Liquidity
Liquidity represents an institution’s ability to meet present and future financial obligations, including through the sale of existing assets or the acquisition of additional funds through short-term borrowings. Our liquidity is provided from cash and due from banks, interest bearing deposits with other banks, federal funds sold, repayments from loans, sales of loans, increases in deposits, lines of credit from the FHLB and three correspondent banks, sales of investments, interest and dividend payments received from investments and maturing investments. As a result of our management of liquid assets and our ability to generate liquidity through liability funding, we believe that we maintain overall liquidity to satisfy our depositors’ requirements and to meet customers’ credit needs. We also take into account any liquidity needs generated by off-balance sheet transactions such as commitments to extend credit, commitments to purchase securities and standby letters of credit.
We monitor and plan our liquidity position for future periods. Liquidity strategies are implemented and monitored by our Asset/Liability Committee (“ALCO”).
Cash, cash equivalents and federal funds sold totaled $22.8 million as of December 31, 2010 compared to $28.7 million as of December 31, 2009. At December 31, 2010, cash, cash equivalents, federal funds sold and unpledged securities available for sale were $168.2 million or 15.03% of total assets, compared to $136.4 million or 12.11% of total assets at December 31, 2009.
As disclosed in the Company’s consolidated statement of cash flows, net cash provided by operating activities was $15.0 million, net cash used in investing activities was $28.3 million and net cash provided by financing activities was $7.4 million for the year ended December 31, 2010. Combined, this contributed to a $5.9 million decrease in liquidity for the year ended December 31, 2010 .
The Company maintains access to short-term funding sources as well, including federal funds lines of credit with three correspondent banks up to $40.0 million and the ability to borrow from the FHLB up to $160.7 million. The Company has no reason to believe these arrangements will not be renewed at maturity. Additional loans and securities are available that can be pledged as collateral for future borrowings from the FHLB above the current lendable collateral value.
55
Table of Contents
Certificates of deposit of $100,000 or more, maturing in one year or less, totaled $88.3 million at December 31, 2010. Certificates of deposit of $100,000 or more, maturing in more than one year, totaled $73.0 million at December 31, 2010.
The following table presents the Company’s contractual obligations and scheduled payment amounts due at various intervals over the next five years and beyond as of December 31, 2010.
Table 20: Contractual Obligations
| Payments Due by Period | ||||||||||||||||||||
| (dollars in thousands) | Total | Less than 1 year |
1-3 years | 3-5 years | Over 5 years | |||||||||||||||
| Operating leases |
$ | 1,314 | $ | 367 | $ | 658 | $ | 247 | $ | 42 | ||||||||||
| Federal funds purchased |
15 | 15 | — | — | — | |||||||||||||||
| Repurchase agreements |
2,449 | 2,449 | — | — | — | |||||||||||||||
| Short-term borrowings |
25,000 | 25,000 | — | — | — | |||||||||||||||
| Long-term borrowings |
117,500 | — | 10,000 | 13,500 | 94,000 | |||||||||||||||
| Trust preferred debt |
10,310 | — | — | — | 10,310 | |||||||||||||||
| Total |
$ | 156,588 | $ | 27,831 | $ | 10,658 | $ | 13,747 | $ | 104,352 | ||||||||||
Subsequent to December 31, 2010, the Company repaid in full the $25.0 million short-term borrowing from the FHLB.
As of December 31, 2010, the Company was not aware of any known trends, events or uncertainties that have or are reasonably likely to have a material impact on our liquidity. As of December 31, 2010, the Company has no material commitments or long-term debt for capital expenditures.
Impact of Inflation and Changing Prices
The Company’s financial statements included herein have been prepared in accordance with accounting principles generally accepted in the United States of America (“U.S. GAAP”). U.S. GAAP presently requires the Company to measure financial position and operating results primarily in terms of historic dollars. Changes in the relative value of money due to inflation or recession are generally not considered. The primary effect of inflation on the operations of the Company is reflected in increased operating costs. In management’s opinion, changes in interest rates affect the financial condition of a financial institution to a far greater degree than changes in the inflation rate because virtually all of the assets and liabilities are monetary in nature. While interest rates are greatly influenced by changes in the inflation rate, they do not necessarily change at the same rate or in the same magnitude as the inflation rate. Interest rates are highly sensitive to many factors that are beyond the control of the Company, including changes in the expected rate of inflation, the influence of general and local economic conditions and the monetary and fiscal policies of the United States government, its agencies and various other governmental regulatory authorities.
In financial institutions, unlike most manufacturing companies, virtually all of the assets and liabilities are monetary in nature. As a result, interest rates have a more significant impact on a bank’s performance than the effects of general levels of inflation. Interest rate movement is not necessarily tied to movements in the same direction or with the same magnitude as the prices of goods and services, since such prices are affected by inflation to a larger extent than interest rates.
Recent Accounting Pronouncements
For information regarding recent accounting pronouncements and their effect on the Company, see Item 8. “Financial Statements and Supplementary Data,” under the heading “Note 1. Summary of Significant Accounting Policies-Recent Significant Accounting Pronouncements.”
| Item 7A. | Quantitative and Qualitative Disclosures About Market Risk |
Market risk is the risk of loss arising from adverse changes in the fair value of financial instruments due to changes in interest
56
Table of Contents
rates, exchange rates and equity prices. The Company’s primary component of market risk is interest rate volatility. Fluctuations in interest rates will impact the amount of interest income and expense the Company receives or pays on a significant portion of its assets and liabilities and the market value of its interest-earning assets and interest-bearing liabilities, excluding those which have a very short-term until maturity. The Company does not subject itself to foreign currency exchange rate risk or commodity price risk due to the current nature of its operations. As of December 31, 2010, the Company does not have any hedging transactions in place such as interest rate swaps or caps. In addition, the Company does not hold or issue financial instruments for trading purposes. The Company does hold in our loan and securities portfolios, investments that adjust or float according to changes in index rates which are not considered speculative, but necessary for good asset/liability management. Management is responsible for reviewing the interest rate sensitivity position of the Company and establishing policies to monitor and limit exposure to interest rate risk. The Board of Directors reviews guidelines for managing the interest rate sensitivity position established by Management.
Asset/Liability Risk Management
The primary goal of asset/liability risk management is to maximize the net interest income and the net value of our future cash flows within the interest rate limits set by our Asset/Liability Committee (“ALCO”). Risks arise when changes in interest rates occur and produce shifts in the Company’s ability to generate earnings (“earnings risk”) and its overall value of equity (“equity risk”). This risk can be measured and monitored by employing management strategies which track the relationship between rate sensitive assets and liabilities so that the net effect of their ability to generate earnings and economic value can be evaluated in a variety of interest rate scenarios.
Interest Rate Risk
Interest rate risk is the risk to earnings or capital as a result of interest rate movement and is monitored through the use of three complementary measures: static gap analysis, earnings simulation modeling and economic value of equity. While each of the interest rate risk measurements has limitations, taken together they represent a reasonably comprehensive view of the magnitude of our interest rate risk, the distribution of risk along the yield curve, the level of risk through time, and the amount of exposure to changes in certain interest rate relationships.
Static Gap Analysis
Interest rate risk is measured and monitored by measuring the rate sensitivity of the balance sheet using static gap analysis. Gap analysis involves analyzing the dollar volume of interest rate sensitive assets and liabilities that will re-price during specific periods of time in the future. The “gap” refers to the difference from the total dollar volume of assets that re-price (or mature, prepay, or amortize) over a given period of time minus the total dollar volume of liabilities that re-price (or mature, prepay or amortize) during the same time period. At December 31, 2010, we are asset sensitive, which means our rate sensitive assets re-price faster than our rate sensitive liabilities, and our cumulative one year gap is 18.02%. An asset-sensitive company generally will be impacted favorably by increasing interest rates while a liability-sensitive company’s net interest margin and net interest income generally will be impacted favorably by declining interest rates.
Earnings Simulation
The earnings simulation model forecasts one-year net income under a variety of scenarios that incorporate changes in interest rates, changes in the shape of the yield curve and changes in interest rate relationships. Management evaluates the effects on income of alternative interest rate scenarios against earnings in a stable interest rate environment. This type of analysis is also most useful in determining the short-run earnings exposures to changes in customer behavior involving loan payments and deposit additions and withdrawals. The following table represents the interest rate sensitivity on net interest income for the Company for the twelve months following each of the years ended December 31, 2010 and December 31, 2009, using different rate scenarios:
57
Table of Contents
| Change in Net Interest Income | ||||||||||||||||
| (dollars in thousands) | 2010 | 2009 | ||||||||||||||
| Change in interest rate |
$ | % | $ | % | ||||||||||||
| + 200 basis points |
$ | 2,239 | 6.11 | % | $ | 17 | 0.04 | % | ||||||||
| + 100 basis points |
1,071 | 2.92 | % | (316 | ) | -0.77 | % | |||||||||
| - 25 basis points |
(126 | ) | -0.34 | % | (174 | ) | -0.42 | % | ||||||||
Internally we also evaluate on a monthly basis the impact of an increase in interest rates by 300 basis points and 400 basis points, as well as a decrease in rates by 100 basis points, 200 basis points and 300 basis points. However with the current fed funds rate at 25 basis points, we consider a rate decrease to a level below zero to be meaningless. This dynamic simulation model includes assumptions about how the balance sheet is likely to evolve through time, in different interest rate environments. Loan and deposit growth rate assumptions are derived from historical analysis and management’s outlook, as are the assumptions used to project yields and rates for new loans and deposits. All maturities, calls and prepayments in the securities portfolio are assumed to be reinvested in like instruments. Mortgage loan prepayment assumptions are developed from industry median estimates of prepayment speeds for portfolios with similar coupon ranges and seasoning. The sensitivities of key assumptions are analyzed at least annually and reviewed by management.
Economic Value of Equity
Economic value simulation is used to calculate the estimated fair value of assets and liabilities in different interest rate environments. Economic values are calculated based on discounted cash flow analysis. The net economic value of equity is the economic value of all assets minus the economic value of all liabilities. Economic value-based methodologies measure the degree to which the economic values of the Company’s positions change under different interest rate scenarios. The economic-value approach focuses on a longer-term time horizon, captures all future cash flows expected from existing assets and liabilities, and is more effective in considering embedded options in a typical institution’s portfolio. The following table reflects the change in economic value of equity for the Company for each of the years ended December 31, 2010 and December 31, 2009, using different rate scenarios:
| Change in Economic Value of Equity | ||||||||||||||||
| (dollars in thousands) | 2010 | 2009 | ||||||||||||||
| Change in interest rate |
$ | % | $ | % | ||||||||||||
| + 200 basis points |
$ | (5,837 | ) | -5.84 | % | $ | (14,540 | ) | -12.81 | % | ||||||
| + 100 basis points |
(3,910 | ) | -3.91 | % | (8,199 | ) | -7.22 | % | ||||||||
| - 25 basis points |
1,778 | 1.78 | % | 1,374 | 1.21 | % | ||||||||||
The Company believes that our current interest rate exposure is manageable and does not indicate any significant exposure to interest rate changes.
| Item 8. | Financial Statements and Supplementary Data |
The following financial statements are filed as a part of this report following item 15:
| • | Report of Independent Registered Public Accounting Firm |
| • | Consolidated Balance Sheets as of December 31, 2010 and 2009 |
| • | Consolidated Statements of Operations for the three years ended December 31, 2010 |
| • | Consolidated Statements of Changes in Shareholders’ Equity for the three years ended December 31, 2010 |
| • | Consolidated Statements of Cash Flows for the three years ended December 31, 2010 |
| • | Notes to Consolidated Financial Statements |
58
Table of Contents
| Item 9. | Changes in and Disagreements with Accountants on Accounting and Financial Disclosure |
None.
| Item 9A. | Controls and Procedures |
Disclosure Controls and Procedures
The Company’s management, with the participation of the Company’s Chief Executive Officer and the Chief Financial Officer, has evaluated the effectiveness of the Company’s disclosure controls and procedures (as defined in Rule 13a-15(e) under the Exchange Act) as of the end of the period covered by this report. Based on that evaluation, the Chief Executive Officer and the Chief Financial Officer have concluded that the Company’s disclosure controls and procedures were effective as of December 31, 2010 to ensure that information required to be disclosed by the Company in reports that it files or submits under the Exchange Act is recorded, processed, summarized and reported within the time periods specified in SEC rules and forms and that such information is accumulated and communicated to the Company’s management, including the Company’s Chief Executive Officer and Chief Financial Officer, as appropriate to allow timely decisions regarding required disclosure. Because of the inherent limitations in all control systems, no evaluation of controls can provide absolute assurance that the Company’s disclosure controls and procedures will detect or uncover every situation involving the failure of persons within the Company or its subsidiary to disclose material information required to be set forth in the Company’s periodic reports.
Management’s Report on Internal Control over Financial Reporting
Management of the Company is also responsible for establishing and maintaining adequate internal control over financial reporting (as defined in Rule 13a-15(f) under the Exchange Act). Because of its inherent limitations, internal control over financial reporting may not prevent or detect misstatements. Therefore, even those systems determined to be effective can provide only reasonable assurance with respect to financial statement preparation and presentation.
Management assessed the effectiveness of the Company’s internal control over financial reporting as of December 31, 2010. In making this assessment, management used the criteria set forth by the Committee of Sponsoring Organizations of the Treadway Commission in Internal Control – Integrated Framework. Based on our assessment, we believe that, as of December 31, 2010, the Company’s internal control over financial reporting was effective based on those criteria.
The effectiveness of the Company’s internal control over financial reporting as of December 31, 2010 has been audited by Yount, Hyde & Barbour, P.C., the independent registered public accounting firm who also audited the Company’s consolidated financial statements included in this Annual Report on Form 10-K. Yount, Hyde & Barbour, P.C.’s attestation report on the Company’s internal control over financial reporting, which states an unqualified opinion on the effectiveness of the Company’s internal control over financial reporting as of December 31, 2010, is incorporated by reference in Item 8 above, under the heading “Report of Independent Registered Public Accounting Firm.”
Changes in Internal Control
There were no changes in the Company’s internal control over financial reporting during the Company’s quarter ended December 31, 2010 that have materially affected, or are reasonably likely to materially affect, the Company’s internal control over financial reporting.
| Item 9B. | Other Information |
None.
PART III
| Item 10. | Directors, Executive Officers and Corporate Governance |
The response to this Item is incorporated by reference to the information under the captions “Proposal One–Election of Directors”, “Corporate Governance and the Board of Directors” and “Section 16(a) Beneficial Ownership Reporting Compliance” in the Company’s Proxy Statement for the 2011 annual meeting of shareholders, and for executive officers is listed in Part I of this Form 10-K.
59
Table of Contents
The Board of Directors has approved a Code of Ethics for all directors, officers and staff of our Company and its subsidiaries. The Code of Ethics is designed to promote honest and ethical conduct, proper disclosure of financial information in our periodic reports, and compliance with applicable laws, rules, and regulations by our senior officers who have financial responsibilities. The Code of Ethics is available on our web page at www.evb.org. The Company intends to provide any required disclosure of any amendment to or waiver from the Code that applies to its principal executive officer, principal financial officer, principal accounting officer or controller, or persons performing similar functions, on www.evb.org promptly following the amendment or waiver. The Company may elect to disclose any such amendment or waiver in a report on Form 8-K filed with the SEC either in addition to or in lieu of the website disclosure. The information contained on or connected to our Internet website is not incorporated by reference into this report and should not be considered part of this or any other report that we file with or furnish to the SEC.
| Item 11. | Executive Compensation |
The response to this Item is incorporated by reference to the information under the captions “Executive Compensation” and “Director Compensation” in the Company’s Proxy Statement for the 2011 annual meeting of shareholders.
| Item 12. | Security Ownership of Certain Beneficial Owners and Management and Related Stockholder Matters |
The response to this Item is incorporated by reference to the information under the captions “Ownership of Stock” and “Executive Compensation-Equity Compensation Plans” in the Company’s Proxy Statement for the 2011 annual meeting of shareholders.
| Item 13. | Certain Relationships and Related Transactions, and Director Independence |
The response to this Item is incorporated by reference to the information under the captions “Corporate Governance and the Board of Directors-Independence of the Directors” and “Certain Relationships and Related Transactions” in the Company’s Proxy Statement for the 2011 annual meeting of shareholders.
| Item 14. | Principal Accountant Fees and Services |
The response to this Item is incorporated by reference to the information under the captions “Fees of Independent Registered Public Accounting Firm” and “Pre-Approved Services” in the Company’s Proxy Statement for the 2011 annual meeting of shareholders.
PART IV
| Item 15. | Exhibits, Financial Statement Schedules |
(a)(1) The response to this portion of Item 15 is included in Item 8 above.
(a)(2) The response to this portion of Item 15 is included in Item 8 above.
(a)(3) Exhibits
The following exhibits are filed as part of this Form 10-K and this list includes the Exhibit Index.
| Exhibit |
||
| 3.1 | Amended and Restated Articles of Incorporation of Eastern Virginia Bankshares, Inc., effective December 29, 2008 (incorporated by reference to Exhibit 3.1 to the Company’s Annual Report on Form 10-K filed March 10, 2009). | |
| 3.2 | Articles of Amendment to the Articles of Incorporation of Eastern Virginia Bankshares, Inc., effective January 6, 2009 (incorporated by reference to Exhibit 3.1 to the Company’s Current Report on Form 8-K filed January 13, 2009). | |
| 3.3 | Bylaws of Eastern Virginia Bankshares, Inc., as amended May 21, 2009 (incorporated by reference to Exhibit 3.3 to the Company’s Annual Report on Form 10-K filed March 11, 2010). | |
| 4.1 | Form of Certificate for Fixed Rate Cumulative Perpetual Preferred Stock, Series A (incorporated by reference to Exhibit 4.1 to the Company’s Current Report on Form 8-K filed January 13, 2009). | |
60
Table of Contents
| 4.2 | Warrant to Purchase Shares of Common Stock, dated January 9, 2009 (incorporated by reference to Exhibit 4.2 to the Company’s Current Report on Form 8-K filed January 13, 2009). | |
| 10.1 | Eastern Virginia Bankshares, Inc. 2003 Stock Incentive Plan (incorporated by reference to Exhibit A to the Company’s 2003 Proxy Statement filed March 24, 2003).* | |
| 10.2 | Eastern Virginia Bankshares, Inc. 2007 Equity Compensation Plan (incorporated by reference to Exhibit A to the Company’s 2007 Proxy Statement filed March 21, 2007.* | |
| 10.3 | Amended and Restated Employment Agreement dated as of January 1, 2008 between Eastern Virginia Bankshares, Inc. and Joe A. Shearin (incorporated by reference to Exhibit 10.3 to the Company’s Annual Report on Form 10-K filed March 10, 2009).* | |
| 10.4 | Amended and Restated Employment Agreement dated as of March 4, 2008 between Eastern Virginia Bankshares, Inc. and Ronald L. Blevins (incorporated by reference to Exhibit 10.4 to the Company’s Annual Report on Form 10-K filed March 10, 2009).* | |
| 10.5 | Amended and Restated Employment Agreement dated as of January 1, 2008 between Eastern Virginia Bankshares, Inc. and Joseph H. James, Jr. (incorporated by reference to Exhibit 10.5 to the Company’s Annual Report on Form 10-K filed March 10, 2009).* | |
| 10.6 | Amended and Restated Employment Agreement dated as of January 10, 2008, between Eastern Virginia Bankshares, Inc. and James S. Thomas (incorporated by reference to Exhibit 10.6 to the Company’s Annual Report on Form 10-K filed March 10, 2009).* | |
| 10.7 | Letter Agreement, dated as of January 9, 2009, by and between Eastern Virginia Bankshares, Inc. and the United States Department of Treasury (incorporated by reference to Exhibit 10.1 to the Company’s Current Report on Form 8-K filed January 13, 2009). | |
| 10.8 | Form of Waiver of the Senior Executive Officers of Eastern Virginia Bankshares, Inc. (incorporated by reference to Exhibit 10.2 to Company’s Current Report on Form 8-K filed January 13, 2009).* | |
| 10.9 | Form of Letter Agreement by and between the Senior Executive Officers of Eastern Virginia Bankshares, Inc. and Eastern Virginia Bankshares, Inc. (incorporated by reference to Exhibit 10.3 to the Company’s Current Report on Form 8-K filed January 13, 2009).* | |
| 10.10 | Form of TARP-compliant Restricted Stock Agreement under Eastern Virginia Bankshares, Inc. Stock Incentive Plan (incorporated by reference to Exhibit 10.10 to the Company’s Current Report on Form 8-K filed November 19, 2010).* | |
| 10.11 | Employment Agreement dated as of September 16, 2010, between Eastern Virginia Bankshares, Inc. and Douglas C. Haskett, II (incorporated by reference to Exhibit 10.11 to the Company’s Current Report on Form 8-K filed December 30, 2010).* | |
| 10.12 | Written Agreement, dated February 17, 2011, by and among Eastern Virginia Bankshares, Inc., EVB, the Federal Reserve Bank of Richmond and the Virginia State Corporation Commission Bureau of Financial Institutions (incorporated by reference to Exhibit 10.12 of the Company’s Current Report on Form 8-K filed February 22, 2011). | |
| 14.1 | Code of Ethics Handbook (incorporated by reference to Exhibit 14 to the Company’s Annual Report on Form 10-K filed March 11, 2004). | |
| 21.1 | Subsidiaries of Eastern Virginia Bankshares, Inc.# | |
| 23.1 | Consent of Yount, Hyde & Barbour, P.C.# | |
| 31.1 | Rule 13a-14(a) Certification of Chief Executive Officer.# | |
| 31.2 | Rule 13a-14(a) Certification of Chief Financial Officer.# | |
| 32.1 | Certification of Chief Executive Officer pursuant to 18 U.S.C. Section 1350.# | |
| 32.2 | Certification of Chief Financial Officer pursuant to 18 U.S.C. Section 1350.# | |
| 99.1 | Certification of Chief Executive Officer pursuant to 31 C.F.R. Section 30.15.# | |
| 99.2 | Certification of Chief Financial Officer pursuant to 31 C.F.R. Section 30.15.# | |
| * | Management contract or compensatory plan or arrangement. |
| # | Filed herewith. |
| (b) | Exhibits – See exhibit index included in Item 15(a)(3) above. |
| (c) | Financial Statement Schedules – See Item 15(a)(2) above. |
61
Table of Contents
Pursuant to the requirements of Section 13 or 15(d) of the Securities Exchange Act of 1934, the registrant has duly caused this report to be signed on its behalf by the undersigned, thereunto duly authorized.
| EASTERN VIRGINIA BANKSHARES, INC. (Registrant) |
||||||||
| By: | /S/ JOE A. SHEARIN | Date: | March 31, 2011 | |||||
| Joe A. Shearin | ||||||||
| President and Chief Executive Officer | ||||||||
| (Principal Executive Officer) | ||||||||
Pursuant to the requirements of the Securities Exchange Act of 1934, this report has been signed below by the following persons on behalf of the registrant and in the capacities indicated on March 31, 2011.
| /S/ W. RAND COOK |
| W. Rand Cook, Chairman, Director |
| /S/ JOE A. SHEARIN |
| Joe A. Shearin |
| President and Chief Executive Officer, Director |
| (Principal Executive Officer) |
| /S/ DOUGLAS C. HASKETT, II |
| Executive Vice President and Chief Financial Officer |
| (Principal Financial and Accounting Officer) |
| /S/ F.L. GARRETT, III |
| F.L. Garrett, III, Vice Chairman, Director |
| /S/ W. GERALD COX |
| W. Gerald Cox, Director |
| /S/ MICHAEL E. FIORE |
| Michael E. Fiore, Director |
| /S/ IRA C. HARRIS |
| Ira C. Harris, Director |
| /S/ F. WARREN HAYNIE, JR. |
| F. Warren Haynie, Jr., Director |
| /S/ ERIC A. JOHNSON |
| Eric A. Johnson, Director |
| /S/ W. LESLIE KILDUFF, JR. |
| W. Leslie Kilduff, Jr., Director |
| /S/ WILLIAM L. LEWIS |
| William L. Lewis, Director |
| /S/ CHARLES R. REVERE |
| Charles R. Revere, Director |
62
Table of Contents
| /S/ HOWARD R. STRAUGHAN |
| Howard R. Straughan, Director |
| /S/ LESLIE E. TAYLOR |
| Leslie E. Taylor, Director |
| /S/ JAY T. THOMPSON |
| Jay T. Thompson, Director |
63
Table of Contents
EXHIBIT INDEX
| Exhibit |
||
| 3.1 | Amended and Restated Articles of Incorporation of Eastern Virginia Bankshares, Inc., effective December 29, 2008 (incorporated by reference to Exhibit 3.1 to the Company’s Annual Report on Form 10-K filed March 10, 2009). | |
| 3.2 | Articles of Amendment to the Articles of Incorporation of Eastern Virginia Bankshares, Inc., effective January 6, 2009 (incorporated by reference to Exhibit 3.1 to the Company’s Current Report on Form 8-K filed January 13, 2009). | |
| 3.3 | Bylaws of Eastern Virginia Bankshares, Inc., as amended May 21, 2009 (incorporated by reference to Exhibit 3.3 to the Company’s Annual Report on Form 10-K filed March 11, 2010). | |
| 4.1 | Form of Certificate for Fixed Rate Cumulative Perpetual Preferred Stock, Series A (incorporated by reference to Exhibit 4.1 to the Company’s Current Report on Form 8-K filed January 13, 2009). | |
| 4.2 | Warrant to Purchase Shares of Common Stock, dated January 9, 2009 (incorporated by reference to Exhibit 4.2 to the Company’s Current Report on Form 8-K filed January 13, 2009). | |
| 10.1 | Eastern Virginia Bankshares, Inc. 2003 Stock Incentive Plan (incorporated by reference to Exhibit A to the Company’s 2003 Proxy Statement filed March 24, 2003).* | |
| 10.2 | Eastern Virginia Bankshares, Inc. 2007 Equity Compensation Plan (incorporated by reference to Exhibit A to the Company’s 2007 Proxy Statement filed March 21, 2007.* | |
| 10.3 | Amended and Restated Employment Agreement dated as of January 1, 2008 between Eastern Virginia Bankshares, Inc. and Joe A. Shearin (incorporated by reference to Exhibit 10.3 to the Company’s Annual Report on Form 10-K filed March 10, 2009).* | |
| 10.4 | Amended and Restated Employment Agreement dated as of March 4, 2008 between Eastern Virginia Bankshares, Inc. and Ronald L. Blevins (incorporated by reference to Exhibit 10.4 to the Company’s Annual Report on Form 10-K filed March 10, 2009).* | |
| 10.5 | Amended and Restated Employment Agreement dated as of January 1, 2008 between Eastern Virginia Bankshares, Inc. and Joseph H. James, Jr. (incorporated by reference to Exhibit 10.5 to the Company’s Annual Report on Form 10-K filed March 10, 2009).* | |
| 10.6 | Amended and Restated Employment Agreement dated as of January 10, 2008, between Eastern Virginia Bankshares, Inc. and James S. Thomas (incorporated by reference to Exhibit 10.6 to the Company’s Annual Report on Form 10-K filed March 10, 2009).* | |
| 10.7 | Letter Agreement, dated as of January 9, 2009, by and between Eastern Virginia Bankshares, Inc. and the United States Department of Treasury (incorporated by reference to Exhibit 10.1 to the Company’s Current Report on Form 8-K filed January 13, 2009). | |
| 10.8 | Form of Waiver of the Senior Executive Officers of Eastern Virginia Bankshares, Inc. (incorporated by reference to Exhibit 10.2 to Company’s Current Report on Form 8-K filed January 13, 2009).* | |
| 10.9 | Form of Letter Agreement by and between the Senior Executive Officers of Eastern Virginia Bankshares, Inc. and Eastern Virginia Bankshares, Inc. (incorporated by reference to Exhibit 10.3 to the Company’s Current Report on Form 8-K filed January 13, 2009).* | |
| 10.10 | Form of TARP-compliant Restricted Stock Agreement under Eastern Virginia Bankshares, Inc. Stock Incentive Plan (incorporated by reference to Exhibit 10.10 to the Company’s Current Report on Form 8-K filed November 19, 2010).* | |
| 10.11 | Employment Agreement dated as of September 16, 2010, between Eastern Virginia Bankshares, Inc. and Douglas C. Haskett, II (incorporated by reference to Exhibit 10.11 to the Company’s Current Report on Form 8-K filed December 30, 2010).* | |
| 10.12 | Written Agreement, dated February 17, 2011, by and among Eastern Virginia Bankshares, Inc., EVB, the Federal Reserve Bank of Richmond and the Virginia State Corporation Commission Bureau of Financial Institutions (incorporated by reference to Exhibit 10.12 of the Company’s Current Report on Form 8-K filed February 22, 2011). | |
| 14.1 | Code of Ethics Handbook (incorporated by reference to Exhibit 14 to the Company’s Annual Report on Form 10-K filed March 11, 2004). | |
| 21.1 | Subsidiaries of Eastern Virginia Bankshares, Inc.# | |
| 23.1 | Consent of Yount, Hyde & Barbour, P.C.# | |
| 31.1 | Rule 13a-14(a) Certification of Chief Executive Officer.# | |
| 31.2 | Rule 13a-14(a) Certification of Chief Financial Officer.# | |
| 32.1 | Certification of Chief Executive Officer pursuant to 18 U.S.C. Section 1350.# | |
| 32.2 | Certification of Chief Financial Officer pursuant to 18 U.S.C. Section 1350.# | |
| 99.1 | Certification of Chief Executive Officer pursuant to 31 C.F.R. Section 30.15.# | |
64
Table of Contents
| 99.2 | Certification of Chief Financial Officer pursuant to 31 C.F.R. Section 30.15.# |
| * | Management contract or compensatory plan or arrangement. |
| # | Filed herewith. |
65
Table of Contents

REPORT OF INDEPENDENT REGISTERED PUBLIC ACCOUNTING FIRM
To the Shareholders and Board of Directors
Eastern Virginia Bankshares, Inc.
Tappahannock, Virginia
We have audited the accompanying consolidated balance sheets of Eastern Virginia Bankshares, Inc. and subsidiaries as of December 31, 2010 and 2009, and the related consolidated statements of operations, changes in shareholders’ equity, and cash flows for the years ended December 31, 2010, 2009 and 2008. These financial statements are the responsibility of the Company’s management. Our responsibility is to express an opinion on these financial statements based on our audits.
We conducted our audits in accordance with the standards of the Public Company Accounting Oversight Board (United States). Those standards require that we plan and perform the audit to obtain reasonable assurance about whether the financial statements are free of material misstatement. An audit includes examining, on a test basis, evidence supporting the amounts and disclosures in the financial statements. An audit also includes assessing the accounting principles used and significant estimates made by management, as well as evaluating the overall financial statement presentation. We believe that our audits provide a reasonable basis for our opinion.
In our opinion, the consolidated financial statements referred to above present fairly, in all material respects, the financial position of Eastern Virginia Bankshares, Inc. and subsidiaries as of December 31, 2010 and 2009, and the results of their operations and their cash flows for the years ended December 31, 2010, 2009 and 2008, in conformity with U.S. generally accepted accounting principles.
We have also audited, in accordance with the standards of the Public Company Accounting Oversight Board (United States), Eastern Virginia Bankshares, Inc. and subsidiaries’ internal control over financial reporting as of December 31, 2010, based on criteria established in Internal Control — Integrated Framework issued by the Committee of Sponsoring Organizations of the Treadway Commission, and our report dated March 31, 2011 expressed an unqualified opinion on the effectiveness of Eastern Virginia Bankshares, Inc. and subsidiaries’ internal control over financial reporting.

Winchester, Virginia
March 31, 2011
Table of Contents
REPORT OF INDEPENDENT REGISTERED PUBLIC ACCOUNTING FIRM
To the Shareholders and Board of Directors
Eastern Virginia Bankshares, Inc.
Tappahannock, Virginia
We have audited Eastern Virginia Bankshares, Inc. and subsidiaries’ internal control over financial reporting as of December 31, 2010, based on criteria established in Internal Control — Integrated Framework issued by the Committee of Sponsoring Organizations of the Treadway Commission. Eastern Virginia Bankshares, Inc. and subsidiaries’ management is responsible for maintaining effective internal control over financial reporting and for its assessment of the effectiveness of internal control over financial reporting included in the accompanying Management’s Report on Internal Control over Financial Reporting. Our responsibility is to express an opinion on the Company’s internal control over financial reporting based on our audit.
We conducted our audit in accordance with the standards of the Public Company Accounting Oversight Board (United States). Those standards require that we plan and perform the audit to obtain reasonable assurance about whether effective internal control over financial reporting was maintained in all material respects. Our audit included obtaining an understanding of internal control over financial reporting, assessing the risk that a material weakness exists, and testing and evaluating the design and operating effectiveness of internal control based on the assessed risk. Our audit also included performing such other procedures as we considered necessary in the circumstances. We believe that our audit provides a reasonable basis for our opinion.
A Company’s internal control over financial reporting is a process designed to provide reasonable assurance regarding the reliability of financial reporting and the preparation of financial statements for external purposes in accordance with generally accepted accounting principles. A Company’s internal control over financial reporting includes those policies and procedures that (a) pertain to the maintenance of records that, in reasonable detail, accurately and fairly reflect the transactions and dispositions of the assets of the Company; (b) provide reasonable assurance that transactions are recorded as necessary to permit preparation of financial statements in accordance with generally accepted accounting principles, and that receipts and expenditures of the Company are being made only in accordance with authorizations of management and directors of the Company; and (c) provide reasonable assurance regarding prevention or timely detection of unauthorized acquisition, use, or disposition of the Company’s assets that could have a material effect on the financial statements.
Because of its inherent limitations, internal control over financial reporting may not prevent or detect misstatements. Also, projections of any evaluation of effectiveness to future periods are subject to the risk that controls may become inadequate because of changes in conditions, or that the degree of compliance with the policies or procedures may deteriorate.
In our opinion, Eastern Virginia Bankshares, Inc. and subsidiaries maintained, in all material respects, effective internal control over financial reporting as of December 31, 2010, based on criteria established in Internal Control — Integrated Framework issued by the Committee of Sponsoring Organizations of the Treadway Commission.
We have also audited, in accordance with the standards of the Public Company Accounting Oversight Board (United States), the consolidated balance sheets as of December 31, 2010 and 2009 and the related consolidated statements of operations, changes in shareholders’ equity and cash flows for the years ended December 31, 2010, 2009, and 2008 of Eastern Virginia Bankshares, Inc. and subsidiaries and our report dated March 31, 2011 expressed an unqualified opinion.
Winchester, Virginia
March 31, 2011
F - 1
Table of Contents
Eastern Virginia Bankshares, Inc. and Subsidiaries
Consolidated Balance Sheets
December 31, 2010 and 2009
(dollars in thousands)
| 2010 | 2009 | |||||||
| Assets: |
||||||||
| Cash and due from banks |
$ | 11,038 | $ | 13,117 | ||||
| Interest bearing deposits with banks |
10,298 | 15,571 | ||||||
| Federal funds sold |
1,495 | — | ||||||
| Securities available for sale, at fair value |
246,120 | 169,442 | ||||||
| Restricted securities, at cost |
10,344 | 8,941 | ||||||
| Loans, net of allowance for loan losses of $25,288 and $12,155, respectively |
749,486 | 840,908 | ||||||
| Deferred income taxes, net |
12,600 | 6,929 | ||||||
| Bank premises and equipment, net |
20,757 | 20,035 | ||||||
| Accrued interest receivable |
4,281 | 3,886 | ||||||
| Other real estate owned, net of valuation allowance of $928 and $0, respectively |
11,617 | 4,136 | ||||||
| Goodwill |
15,970 | 15,970 | ||||||
| Other assets |
25,324 | 27,348 | ||||||
| Total assets |
$ | 1,119,330 | $ | 1,126,283 | ||||
| Liabilities and Shareholders’ Equity: |
||||||||
| Liabilities |
||||||||
| Noninterest-bearing demand accounts |
$ | 97,122 | $ | 93,307 | ||||
| Interest-bearing deposits |
771,024 | 763,333 | ||||||
| Total deposits |
868,146 | 856,640 | ||||||
| Federal funds purchased and repurchase agreements |
2,464 | 24,154 | ||||||
| Short-term borrowings |
25,000 | — | ||||||
| Long-term borrowings |
117,500 | 123,214 | ||||||
| Trust preferred debt |
10,310 | 10,310 | ||||||
| Accrued interest payable |
1,451 | 1,739 | ||||||
| Other liabilities |
3,041 | 5,028 | ||||||
| Total liabilities |
1,027,912 | 1,021,085 | ||||||
| Shareholders’ Equity |
||||||||
| Preferred stock, $2 par value per share, authorized 10,000,000, issued and outstanding: Series A; $1,000 stated value 24,000 shares fixed rate cumulative perpetual preferred |
24,000 | 24,000 | ||||||
| Common stock, $2 par value per share, authorized 50,000,000, issued and outstanding 5,993,577 and 5,966,662 including 16,500 and 28,400 nonvested shares in 2010 and 2009, respectively |
11,954 | 11,877 | ||||||
| Surplus |
19,302 | 18,965 | ||||||
| Retained earnings |
37,884 | 50,850 | ||||||
| Warrant |
1,481 | 1,481 | ||||||
| Discount on preferred stock |
(900 | ) | (1,192 | ) | ||||
| Accumulated other comprehensive (loss), net |
(2,303 | ) | (783 | ) | ||||
| Total shareholders’ equity |
91,418 | 105,198 | ||||||
| Total liabilities and shareholders’ equity |
$ | 1,119,330 | $ | 1,126,283 | ||||
The accompanying notes are an integral part of the consolidated financial statements.
F - 2
Table of Contents
Eastern Virginia Bankshares, Inc. and Subsidiaries
Consolidated Statements of Operations
Years Ended December 31, 2010, 2009 and 2008
(dollars in thousands, except per share amounts)
| 2010 | 2009 | 2008 | ||||||||||
| Interest and Dividend Income |
||||||||||||
| Loans and fees on loans |
$ | 47,687 | $ | 49,702 | $ | 51,371 | ||||||
| Interest on investments: |
||||||||||||
| Taxable interest income |
3,928 | 4,879 | 5,918 | |||||||||
| Tax exempt interest income |
1,643 | 1,901 | 1,658 | |||||||||
| Dividends |
138 | 103 | 355 | |||||||||
| Interest on deposits with banks |
113 | 99 | — | |||||||||
| Interest on federal funds sold |
1 | 43 | 84 | |||||||||
| Total interest and dividend income |
53,510 | 56,727 | 59,386 | |||||||||
| Interest Expense |
||||||||||||
| Deposits |
12,312 | 18,241 | 20,337 | |||||||||
| Federal funds purchased and repurchase agreements |
57 | 18 | 90 | |||||||||
| Short-term borrowings |
9 | — | — | |||||||||
| Long-term borrowings |
5,010 | 5,396 | 5,754 | |||||||||
| Trust preferred debt |
334 | 395 | 628 | |||||||||
| Total interest expense |
17,722 | 24,050 | 26,809 | |||||||||
| Net interest income |
35,788 | 32,677 | 32,577 | |||||||||
| Provision for Loan Losses |
28,930 | 4,200 | 4,025 | |||||||||
| Net interest income after provision for loan losses |
6,858 | 28,477 | 28,552 | |||||||||
| Noninterest Income (Loss) |
||||||||||||
| Service charges and fees on deposit accounts |
3,873 | 3,841 | 3,991 | |||||||||
| Debit/credit card fees |
1,340 | 1,189 | 1,135 | |||||||||
| Gain on sale of available for sale securities, net |
2,455 | 66 | 44 | |||||||||
| Other-than-temporary impairment losses on securities (no additional amounts were recognized in other comprehensive income) |
(77 | ) | (18,919 | ) | (4,933 | ) | ||||||
| Gain on sale of fixed assets |
26 | — | 129 | |||||||||
| Gain (loss) on sale of other real estate owned |
(22 | ) | 357 | — | ||||||||
| Impairment losses on other real estate owned |
(928 | ) | — | (229 | ) | |||||||
| Gain on sale of loans |
1,326 | — | — | |||||||||
| Gain on bank owned life insurance |
604 | — | — | |||||||||
| Actuarial gain on pension curtailment |
— | — | 1,328 | |||||||||
| Other operating income |
1,395 | 977 | 1,505 | |||||||||
| Total noninterest income (loss) |
9,992 | (12,489 | ) | 2,970 | ||||||||
| Noninterest Expenses |
||||||||||||
| Salaries and employee benefits |
16,362 | 15,254 | 14,776 | |||||||||
| Occupancy and equipment expenses |
5,183 | 5,144 | 4,738 | |||||||||
| Telephone |
1,149 | 1,070 | 996 | |||||||||
| FDIC expense |
2,325 | 1,705 | 465 | |||||||||
| Consultant fees |
905 | 751 | 653 | |||||||||
| Collection, repossession and other real estate owned |
2,134 | 569 | 193 | |||||||||
| Marketing and advertising |
1,325 | 737 | 874 | |||||||||
| Other operating expenses |
5,188 | 5,418 | 5,250 | |||||||||
| Total noninterest expenses |
34,571 | 30,648 | 27,945 | |||||||||
| Income (loss) before income taxes |
(17,721 | ) | (14,660 | ) | 3,577 | |||||||
| Income Tax Expense (Benefit) |
(6,962 | ) | (5,856 | ) | 506 | |||||||
| Net income (loss) |
$ | (10,759 | ) | $ | (8,804 | ) | $ | 3,071 | ||||
| Effective dividend on preferred stock |
1,492 | 1,459 | — | |||||||||
| Net income (loss) available to common shareholders |
$ | (12,251 | ) | $ | (10,263 | ) | $ | 3,071 | ||||
| Income (loss) per common share: basic |
$ | (2.05 | ) | $ | (1.73 | ) | $ | 0.52 | ||||
| diluted |
$ | (2.05 | ) | $ | (1.73 | ) | $ | 0.52 | ||||
| Dividends per share, common |
$ | 0.12 | $ | 0.31 | $ | 0.64 | ||||||
The accompanying notes are an integral part of the consolidated financial statements.
F - 3
Table of Contents
Eastern Virginia Bankshares, Inc. and Subsidiaries
Consolidated Statements of Shareholders’ Equity
For the Years Ended December 31, 2010, 2009 and 2008
(dollars in thousands)
| Common Stock |
Preferred Stock |
Surplus | Retained Earnings |
Accumulated Other Comprehensive Income (Loss) |
Comprehensive Income (Loss) |
Total | ||||||||||||||||||||||
| Balance, December 31, 2007 |
$ | 11,865 | $ | — | $ | 18,811 | $ | 63,616 | $ | (3,523 | ) | $ | 90,769 | |||||||||||||||
| Comprehensive (loss): |
||||||||||||||||||||||||||||
| Net income |
3,071 | $ | 3,071 | 3,071 | ||||||||||||||||||||||||
| Other comprehensive (loss): |
||||||||||||||||||||||||||||
| Unrealized securities losses arising during period, (net of tax, $4.8 million) |
(8,885 | ) | ||||||||||||||||||||||||||
| Reclassification adjustment, (net of tax, $15 thousand) |
(29 | ) | ||||||||||||||||||||||||||
| Change in unfunded pension liability, (net of tax, $653 thousand) |
(2,592 | ) | ||||||||||||||||||||||||||
| Other comprehensive (loss) |
(11,506 | ) | (11,506 | ) | (11,506 | ) | ||||||||||||||||||||||
| Total comprehensive (loss) |
$ | (8,435 | ) | |||||||||||||||||||||||||
| Cash dividends - common ($0.64 per share) |
(3,778 | ) | (3,778 | ) | ||||||||||||||||||||||||
| Stock based compensation |
277 | 277 | ||||||||||||||||||||||||||
| Director stock grant |
13 | 91 | 104 | |||||||||||||||||||||||||
| Pension plan date change |
(105 | ) | (105 | ) | ||||||||||||||||||||||||
| Common stock repurchased |
(141 | ) | (1,096 | ) | (1,237 | ) | ||||||||||||||||||||||
| Restricted common stock vested |
3 | (3 | ) | — | ||||||||||||||||||||||||
| Issuance of common stock under dividend reinvestment plan |
58 | — | 376 | — | — | 434 | ||||||||||||||||||||||
| Balance, December 31, 2008 |
$ | 11,798 | $ | — | $ | 18,456 | $ | 62,804 | $ | (15,029 | ) | $ | 78,029 | |||||||||||||||
| Comprehensive income: |
||||||||||||||||||||||||||||
| Net (loss) |
(8,804 | ) | $ | (8,804 | ) | (8,804 | ) | |||||||||||||||||||||
| Other comprehensive income: |
||||||||||||||||||||||||||||
| Unrealized securities gains arising during period, (net of tax, $1.4 million) |
2,549 | |||||||||||||||||||||||||||
| Reclassification adjustment, (net of tax, $5.4 million) |
10,028 | |||||||||||||||||||||||||||
| Change in unfunded pension liability, (net of tax, $967 thousand) |
1,669 | |||||||||||||||||||||||||||
| Other comprehensive income |
14,246 | 14,246 | 14,246 | |||||||||||||||||||||||||
| Total comprehensive income |
$ | 5,442 | ||||||||||||||||||||||||||
| Issuance of preferred stock to U.S. Treasury |
24,000 | 24,000 | ||||||||||||||||||||||||||
| Cash dividends - common ($0.31 per share) |
(1,838 | ) | (1,838 | ) | ||||||||||||||||||||||||
| Cash dividends - preferred |
(1,020 | ) | (1,020 | ) | ||||||||||||||||||||||||
| Preferred stock discount |
289 | (289 | ) | — | ||||||||||||||||||||||||
| Stock based compensation |
248 | 248 | ||||||||||||||||||||||||||
| Director stock grant |
13 | 41 | 54 | |||||||||||||||||||||||||
| Restricted common stock vested |
3 | (3 | ) | — | ||||||||||||||||||||||||
| Issuance of common stock under dividend reinvestment plan |
63 | — | 220 | — | — | 283 | ||||||||||||||||||||||
| Balance, December 31, 2009 |
$ | 11,877 | $ | 24,289 | $ | 18,965 | $ | 50,850 | $ | (783 | ) | $ | 105,198 | |||||||||||||||
| Comprehensive (loss): |
||||||||||||||||||||||||||||
| Net (loss) |
(10,759 | ) | $ | (10,759 | ) | (10,759 | ) | |||||||||||||||||||||
| Other comprehensive (loss): |
||||||||||||||||||||||||||||
| Unrealized securities losses arising during period, (net of tax, $678 thousand) |
(1,287 | ) | ||||||||||||||||||||||||||
| Reclassification adjustment, (net of tax, $835 thousand) |
(1,620 | ) | ||||||||||||||||||||||||||
| Change in unfunded pension liability, (net of tax, $749 thousand) |
1,387 | |||||||||||||||||||||||||||
| Other comprehensive (loss) |
(1,520 | ) | (1,520 | ) | (1,520 | ) | ||||||||||||||||||||||
| Total comprehensive (loss) |
$ | (12,279 | ) | |||||||||||||||||||||||||
| Cash dividends - common ($0.12 per share) |
(715 | ) | (715 | ) | ||||||||||||||||||||||||
| Cash dividends - preferred |
(1,200 | ) | (1,200 | ) | ||||||||||||||||||||||||
| Preferred stock discount |
292 | (292 | ) | — | ||||||||||||||||||||||||
| Stock based compensation |
208 | 208 | ||||||||||||||||||||||||||
| Director stock grant |
13 | 30 | 43 | |||||||||||||||||||||||||
| Restricted common stock vested |
4 | (4 | ) | — | ||||||||||||||||||||||||
| Issuance of common stock under dividend reinvestment plan |
60 | — | 103 | — | — | 163 | ||||||||||||||||||||||
| Balance, December 31, 2010 |
$ | 11,954 | $ | 24,581 | $ | 19,302 | $ | 37,884 | $ | (2,303 | ) | $ | 91,418 | |||||||||||||||
The accompanying notes are an integral part of the consolidated financial statements.
F - 4
Table of Contents
Eastern Virginia Bankshares, Inc. and Subsidiaries
Consolidated Statements of Cash Flows
Years Ended December 31, 2010, 2009 and 2008
(dollars in thousands)
| 2010 | 2009 | 2008 | ||||||||||
| Operating Activities: |
||||||||||||
| Net income (loss) |
$ | (10,759 | ) | $ | (8,804 | ) | $ | 3,071 | ||||
| Adjustments to reconcile net income (loss) to net cash provided by operating activities: |
||||||||||||
| Provision for loan losses |
28,930 | 4,200 | 4,025 | |||||||||
| Depreciation and amortization |
2,206 | 2,290 | 2,215 | |||||||||
| Stock based compensation |
208 | 248 | 277 | |||||||||
| Net amortization of premiums and accretion of discounts on securities available for sale |
728 | 254 | 20 | |||||||||
| (Gain) realized on securities available for sale transactions, net |
(2,455 | ) | (66 | ) | (44 | ) | ||||||
| Impairment charge on securities |
77 | 18,919 | 4,933 | |||||||||
| (Gain) on sale of loans |
(1,326 | ) | — | — | ||||||||
| (Gain) on sale of bank premises and equipment |
(26 | ) | — | (129 | ) | |||||||
| Loss (gain) on sale of other real estate owned |
22 | (357 | ) | — | ||||||||
| Impairment on other real estate owned |
928 | — | 229 | |||||||||
| Loss (gain) on LLC investment |
153 | 346 | (130 | ) | ||||||||
| Actuarial gain - pension curtailment |
— | — | (1,328 | ) | ||||||||
| Deferred income taxes |
(4,906 | ) | (1,736 | ) | (2,096 | ) | ||||||
| Net change in: |
||||||||||||
| Accrued interest receivable |
(395 | ) | 164 | 247 | ||||||||
| Other assets |
1,793 | (14,466 | ) | (1,913 | ) | |||||||
| Accrued interest payable |
(288 | ) | (773 | ) | (1,234 | ) | ||||||
| Other liabilities |
149 | 2,700 | 85 | |||||||||
| Net cash provided by operating activities |
15,039 | 2,919 | 8,228 | |||||||||
| Investing Activities: |
||||||||||||
| Purchase of securities available for sale |
(305,481 | ) | (105,798 | ) | (107,627 | ) | ||||||
| Purchase of restricted securities, net |
(2,037 | ) | (221 | ) | (844 | ) | ||||||
| Purchases of bank premises and equipment |
(2,928 | ) | (1,519 | ) | (4,658 | ) | ||||||
| Acquisition of branches |
— | — | 33,995 | |||||||||
| Improvements to other real estate owned |
(337 | ) | (735 | ) | (123 | ) | ||||||
| Net change in loans |
25,053 | (42,107 | ) | (63,483 | ) | |||||||
| Proceeds from: |
||||||||||||
| Maturities, calls, and paydowns of securities available for sale |
120,887 | 88,266 | 83,178 | |||||||||
| Sales of securities available for sale |
105,223 | 976 | 5,624 | |||||||||
| Sale of restricted securities, net |
634 | 514 | 32 | |||||||||
| Sale of loans |
27,767 | — | — | |||||||||
| Sale of bank premises and equipment |
26 | — | 209 | |||||||||
| Sale of other real estate owned |
2,904 | 3,239 | 950 | |||||||||
| Net cash used in investing activities |
(28,289 | ) | (57,385 | ) | (52,747 | ) | ||||||
| Financing Activities: |
||||||||||||
| Net change in: |
||||||||||||
| Demand, interest-bearing demand and savings deposits |
45,292 | 106,126 | 16,488 | |||||||||
| Time deposits |
(33,786 | ) | (66,797 | ) | 33,272 | |||||||
| Federal funds purchased and repurchase agreements |
(21,690 | ) | 20,561 | (13,506 | ) | |||||||
| Short-term borrowings |
25,000 | — | — | |||||||||
| Long-term borrowings |
(5,714 | ) | (11,429 | ) | 7,572 | |||||||
| Common stock repurchased |
— | — | (1,237 | ) | ||||||||
| Issuance of common stock under dividend reinvestment plan |
163 | 283 | 434 | |||||||||
| Issuance of preferred stock to U. S. Treasury |
— | 24,000 | — | |||||||||
| Director stock grant |
43 | 54 | 104 | |||||||||
| Dividends paid - common |
(715 | ) | (1,838 | ) | (3,778 | ) | ||||||
| Dividends paid - preferred |
(1,200 | ) | (1,020 | ) | — | |||||||
| Net cash provided by financing activities |
7,393 | 69,940 | 39,349 | |||||||||
| Net (decrease) increase in cash and cash equivalents |
(5,857 | ) | 15,474 | (5,170 | ) | |||||||
| Cash and cash equivalents, January 1 |
28,688 | 13,214 | 18,384 | |||||||||
| Cash and cash equivalents, December 31 |
$ | 22,831 | $ | 28,688 | $ | 13,214 | ||||||
| Supplemental disclosure: |
||||||||||||
| Interest paid |
$ | 18,010 | $ | 24,823 | $ | 27,836 | ||||||
| Income taxes (received) paid |
$ | (3,210 | ) | $ | 1,167 | $ | 2,370 | |||||
| Supplemental disclosure of noncash investing and financing activities: |
||||||||||||
| Unrealized (losses) gains on securities available for sale |
$ | (4,420 | ) | $ | 19,348 | $ | (13,714 | ) | ||||
| Loans transferred to other real estate owned |
$ | (10,998 | ) | $ | (5,723 | ) | $ | (559 | ) | |||
| Pension adjustment |
$ | 2,136 | $ | 2,636 | $ | (3,988 | ) | |||||
| Acquisition of branches: |
||||||||||||
| Fair value of assets acquired |
$ | — | $ | — | $ | 49,171 | ||||||
| Fair value of liabilities assumed |
— | — | 93,706 | |||||||||
| Purchase price in excess of net assets acquired |
— | — | 10,265 | |||||||||
| Cash received |
— | — | 34,270 | |||||||||
| Less cash acquired |
— | — | (275 | ) | ||||||||
| Net cash received for acquisition |
$ | — | $ | — | $ | 33,995 | ||||||
The accompanying notes are an integral part of the consolidated financial statements.
F - 5
Table of Contents
Eastern Virginia Bankshares, Inc. and Subsidiaries
Notes to Consolidated Financial Statements
December 31, 2010, 2009 and 2008
Note 1. Summary of Significant Accounting Policies
The accounting and reporting policies of Eastern Virginia Bankshares, Inc. (the “Parent”) and its subsidiaries, EVB Statutory Trust I (the “Trust”), and EVB (the “Bank”) and its subsidiaries, are in accordance with accounting principles generally accepted in the United States of America (“U.S. GAAP”) and conform to accepted practices within the banking industry. A summary of significant accounting policies is briefly described below.
Principles of Consolidation
The accompanying consolidated financial statements include the accounts of the Parent, the Bank and its subsidiaries, collectively referred to as “the Company.” All significant intercompany balances and transactions have been eliminated in consolidation. In addition, the Parent owns the Trust which is an unconsolidated subsidiary. The subordinated debt owed to this trust is reported as a liability of the Parent.
Nature of Operations
Eastern Virginia Bankshares, Inc. is a bank holding company headquartered in Tappahannock, Virginia that was organized and chartered under the laws of the Commonwealth of Virginia on September 5, 1997 and commenced operations on December 29, 1997. We conduct our primary operations through our wholly-owned bank subsidiary, EVB. Two of our three predecessor banks, Bank of Northumberland, Inc. and Southside Bank, were established in 1910. The third bank, Hanover Bank, was established as a de novo bank in 2000. In April 2006, these three banks were merged and the surviving bank was re-branded as EVB. The Bank provides a full range of banking and related financial services to individuals and businesses through its network of retail branches. With twenty-four retail branches, the Bank serves diverse markets that primarily are in the counties of Caroline, Essex, Gloucester, Hanover, Henrico, King and Queen, King William, Lancaster, Middlesex, New Kent, Richmond, Northumberland, Southampton, Surry, Sussex and the City of Colonial Heights. The Bank operates under a state bank charter and as such is subject to regulation by the Virginia State Corporation Commission-Bureau of Financial Institutions (the “SCC”) and the Board of Governors of the Federal Reserve System (the “Federal Reserve”).
The Bank owns EVB Financial Services, Inc., which in turn has a 100% ownership interest in EVB Investments, Inc. and a 50% ownership interest in EVB Mortgage, LLC. EVB Investments, Inc. is a full-service brokerage firm offering a comprehensive range of investment services. EVB Mortgage, LLC was formed to originate and sell residential mortgages. The Bank has a 75% ownership interest in EVB Title, LLC, which primarily sells title insurance to the mortgage loan customers of the Bank and EVB Mortgage, LLC. The Bank has a 2.33% ownership in Virginia Bankers Insurance Center, LLC, which primarily sells insurance products to customers of the Bank, and other financial institutions that have an equity interest in the agency. The Bank also has a 100% ownership interest in Dunston Hall LLC, POS LLC, Tartan Holdings LLC and ECU-RE LLC which were formed to hold the title to real estate acquired by the Bank upon foreclosure on property of real estate secured loans. The financial position and operating results of all of these subsidiaries are not significant to us as a whole and are not considered principal activities of the Company at this time.
Use of Estimates
The preparation of financial statements in conformity with U.S. GAAP requires management to make estimates and assumptions that affect the reported amounts of assets and liabilities and disclosure of contingent assets and liabilities at the date of the financial statements and the reported amounts of revenues and expenses during the reporting period. Actual results could differ from those estimates. Material estimates that are particularly susceptible to significant change in the near term relate to the determination of the allowance for loan losses, impairment of loans, impairment of securities, the valuation of other real estate owned, the projected benefit obligation under the defined benefit pension plan, the valuation of deferred taxes, goodwill impairment and fair value of financial instruments. In the opinion of management, all adjustments, consisting only of normal recurring adjustments, which are necessary for a fair presentation of the results of operations in these financial statements, have been made.
F - 6
Table of Contents
Reclassifications
Certain prior year amounts have been reclassified to conform to the 2010 presentation. These reclassifications have no effect on previously reported net income (loss).
Significant Group Concentrations of Credit Risk
Substantially all of the Company’s lending activities are with customers located in Virginia. At December 31, 2010 and 2009, respectively, 45.67% and 44.98% of the Company’s loan portfolio consisted of real estate loans secured by one to four family residential properties, which includes closed end first and second mortgages as well as home equity lines. In addition, at December 31, 2010, the Company had $29.6 million of loans to the hospitality industry (hotels, motels, inns, etc.). This amount represents 14.9% of the Company’s total commercial real estate loans and 35.5% of the Bank’s total risk-based capital at December 31, 2010. This concentration of loans exceeds established supervisory guidelines of 25% of the Bank’s total risk-based capital. The Company does not have any significant loan concentrations to any one customer. Note 3 discusses the Company’s lending activities.
The Company invests in a variety of securities and does not have any significant securities concentrations in any one industry or to any one issuer. Note 2 discusses the Company’s investment activities.
At December 31, 2010 and 2009, the Company’s cash and due from banks included two commercial bank deposit accounts that were in excess of the Federal Deposit Insurance Corporation insured limit of $250,000 per institution by approximately $4.4 million and $6.4 million, respectively.
Cash and Cash Equivalents
For purposes of the consolidated statements of cash flows, cash and cash equivalents includes cash and due from banks, interest bearing deposits with banks and federal funds sold, which all mature within ninety days.
Restrictions on Cash and Due from Bank Accounts
The Company is required to maintain average reserve balances in cash with the Federal Reserve Bank of Richmond (the “FRB”). Required reserves were $75 thousand for December 31, 2010 and 2009, respectively.
Investment Securities
At the time of purchase, investment securities are classified as available for sale, as management has the intent and ability to hold such securities for an indefinite period of time, but not necessarily to maturity. Any decision to sell investment securities available for sale would be based on various factors, including, but not limited to, asset/liability management strategies, changes in interest rates or prepayment risks, liquidity needs, or regulatory capital considerations. Investment securities available for sale are carried at fair value, with unrealized gains and losses, net of related deferred income taxes, included in shareholders’ equity as a separate component of other comprehensive income. Gains or losses are recognized in earnings on the trade date using the amortized cost of the specific security sold. Premiums and discounts are amortized or accreted into interest income using the interest method over the terms of the securities.
Impairment of securities occurs when the fair value of a security is less than its amortized cost. For debt securities, impairment is considered other-than-temporary and recognized in its entirety in net income if either (i) we intend to sell the security or (ii) it is more likely than not that we will be required to sell the security before recovery of its amortized cost basis. If, however, we do not intend to sell the security and it is not more-than-likely that we will be required to sell the security before recovery, we must determine what portion of the impairment is attributable to a credit loss, which occurs when the amortized cost of the security exceeds the present value of the cash flows expected to be collected from the security. If there is no credit loss, there is no other-than-temporary impairment. If there is a credit loss, other-than-temporary impairment exists, and the credit loss must be recognized in net income and the remaining portion of impairment must be recognized in other comprehensive income.
For equity securities, impairment is considered to be other-than-temporary based on our ability and intent to hold the investment until a recovery of fair value. Other-than-temporary impairment of an equity security results in a write-down that must be included in income. We regularly review each security for other-than-temporary impairment based on criteria that include the extent to which cost exceeds market price, the duration of that market decline, the financial
F - 7
Table of Contents
health of and specific prospects for the issuer, our best estimate of the present value of cash flows expected to be collected from debt securities, our intention with regard to holding the security to maturity and the likelihood that we would be required to sell the security before recovery.
Restricted Securities
As a requirement for membership, the Company invests in the stock of the Federal Home Loan Bank of Atlanta (“FHLB”), Community Bankers Bank (“CBB”), and the FRB. These investments are carried at cost.
Loans
The Company offers an array of lending and credit services to customers including mortgage, commercial and consumer loans. A substantial portion of the loan portfolio is represented by mortgage loans in our market area. The ability of our debtors to honor their contracts is dependent upon the real estate and general economic conditions in our market area. Loans that management has both the intent and ability to hold for the foreseeable future or until maturity or pay-off generally are stated at their outstanding unpaid principal balances adjusted for charge-offs, the allowance for loan losses, and net of any deferred fees or costs on originated loans. Interest income is accrued on the unpaid principal balance. Loan origination fees, net of certain direct origination costs, are deferred and recognized as an adjustment to the yield (interest income) of the related loans. The Company is amortizing these amounts over the contractual life of the related loans.
The past due status of a loan is based on the contractual due date of the most delinquent payment due. Loans, including impaired loans, are generally classified as nonaccrual if they are past due as to maturity or payment of principal or interest for a period of more than 90 days, unless such loans are well-secured and in the process of collection. Loans greater than 90 days past due may remain on an accrual status if management determines it has adequate collateral to cover the principal and interest. If a loan or a portion of a loan is adversely classified, or is partially charged off, the loan is generally classified as nonaccrual. Additionally, whenever management becomes aware of facts or circumstances that may adversely impact the collectability of principal or interest on loans, it is management’s practice to place such loans on a nonaccrual status immediately, rather than delaying such action until the loans become 90 days past due.
When a loan is placed on nonaccrual status, previously accrued and uncollected interest is reversed, and the amortization of related deferred loan fees or costs is suspended. While a loan is classified as nonaccrual and the future collectability of the recorded loan balance is doubtful, collections of interest and principal are generally applied as a reduction to principal outstanding. When the future collectability of the recorded loan balance is expected, interest income may be recognized on a cash basis. In the case where a nonaccrual loan has been partially charged off, recognition of interest on a cash basis is limited to that which would have been recognized on the recorded loan balance at the contractual interest rate. Cash interest receipts in excess of that amount are recorded as recoveries to the allowance for loan losses until prior charge-offs have been fully recovered. These policies are applied consistently across our loan portfolio.
Loans may be returned to accrual status when all principal and interest amounts contractually due (including arrearages) are reasonably assured of repayment within an acceptable period of time, and there is a sustained period of repayment performance by the borrower, in accordance with the contractual terms of interest and principal.
A loan is considered impaired when, based on current information and events, it is probable that we will be unable to collect the scheduled payments of principal or interest when due, according to the contractual terms of the loan agreement. Impaired loans are stated at their outstanding unpaid principal balances adjusted for charge-offs, the allowance for loan losses, and net of any deferred fees or costs on originated loans (recorded investment). Factors considered by management in determining impairment include payment status, collateral value, and the probability of collecting scheduled principal and interest payments when due. Loans that experience insignificant payment shortfalls generally are not classified as impaired. We determine the significance of payment delays and payment shortfalls on a case-by-case basis, taking into consideration all of the circumstances surrounding the loan and the borrower, including the length of the delay, the reasons for the delay, the borrower’s prior payment record, and the amount of the shortfall in relation to the principal and interest owed. Impairment is measured on a loan-by-loan basis for real estate (including multifamily residential, construction, farmland and non-farm, non-residential) and commercial loans, by either the present value of expected cash flows discounted at the loan’s effective interest rate, the loan’s obtainable market price, or the fair value of collateral if the loan is collateral dependent. Large groups of smaller balance homogeneous loans, representing consumer, one to four family residential first and seconds and home equity lines, are
F - 8
Table of Contents
collectively evaluated for impairment. Accordingly, we do not separately identify the individual consumer and one to four family residential loans for impairment disclosures, except for troubled debt restructurings (“TDR”) as noted below.
A loan is accounted for as a TDR if the Company, for economic or legal reasons related to the borrower’s financial condition, grants a concession to the borrower that it would not otherwise consider. TDRs are considered impaired loans. A TDR may involve the receipt of assets from the debtor in partial or full satisfaction of the loan, or a modification of terms such as a reduction of the stated interest rate, the forbearance of principal and interest payments for a specified period, the conversion from an amortizing loan to an interest-only loan for a specified period, or some combination of these concessions. These concessions can be temporary and are done in an attempt to avoid foreclosure and are made with the intent to restore the loan to a performing status once sufficient payment history can be demonstrated. TDRs generally remain on nonaccrual status until a six-month payment history is sustained. As of December 31, 2010 and 2009, the Company had $8.6 million and $6.7 million of loans classified as TDRs.
Allowance for Loan Losses
The allowance for loan losses is a reserve for estimated credit losses on individually evaluated loans determined to be impaired as well as estimated credit losses inherent in the loan portfolio, and is based on periodic evaluations of the collectability and historical loss experience of loans. A provision for loan losses, which is a charge against earnings, is recorded to bring the allowance for loan losses to a level that, in management’s judgment, is appropriate to absorb probable losses in the loan portfolio. Actual credit losses are deducted from the allowance for loan losses for the difference between the carrying value of the loan and the estimated net realizable value or fair value of the collateral, if collateral dependent. The following general guidelines apply:
| • | Management believes that the collectability of the principal is unlikely regardless of delinquency status. |
| • | If unsecured, the loan will be charged-off in full no later than 120 days of its payment due date if a closed-end credit. |
| • | If unsecured, the loan will be charged-off in full no later than 180 days of its payment due date if an open-ended credit. |
| • | If secured, the outstanding principal balance of the loan will be charged-off generally after the collateral has been liquidated and sale proceeds applied to the balance. |
Subsequent recoveries, if any, are credited to the allowance for loan losses.
The allocation methodology applied by the Company, designed to assess the appropriateness of the allowance for loan losses, includes management’s ongoing review and grading of the loan portfolio into criticized loan categories (defined as specific loans warranting either specific allocation, or a classified status of substandard, doubtful or loss). The allocation methodology focuses on evaluation of several factors, including but not limited to: evaluation of facts and issues related to specific loans, management’s ongoing review and grading of the loan portfolio, consideration of historical loan loss experience (rolling five year average with weighting factors applied to more recent experience) and delinquency experience on each portfolio category, trends in past due and nonaccrual loans, the level of classified loans, the risk characteristics of the various classifications of loans, changes in the size and character of the loan portfolio, concentrations of loans to specific borrowers or industries, existing economic conditions, the fair value of underlying collateral, and other qualitative and quantitative factors which could affect potential credit losses. Because each of the criteria used is subject to change, the allocation of the allowance for loan losses is made for analytical purposes and is not necessarily indicative of the trend of future loan losses in any particular loan category. The total allowance is available to absorb losses from any segment of the portfolio. In determining the allowance for loan losses, the Company considers its portfolio segments and loan classes to be the same.
The allowance for loan losses is comprised of a specific allowance for identified problem loans and a general allowance representing estimations done pursuant to either Financial Accounting Standards Board (“FASB”) ASC Topic 450 “Accounting for Contingencies”, or FASB ASC Topic 310 “Accounting by Creditors for Impairment of a Loan.” The specific component relates to loans that are classified as impaired, and is established when the discounted cash flows (or collateral value or observable market price) of the impaired loan is lower than the carrying value of that loan. For collateral dependent loans, an updated appraisal will be ordered if a current one is not on file. Appraisals are performed by independent third-party appraisers with relevant industry experience. Adjustments to the appraised value may be made based on recent sales of like properties or general market conditions when deemed appropriate. The general component covers non-classified or performing loans and those loans classified as substandard that are not impaired. The general component is based on historical loss experience adjusted for qualitative factors, such as
F - 9
Table of Contents
economic conditions, interest rates and unemployment rates. The Company uses a risk grading system for real estate (including multifamily residential, construction, farmland and non-farm, non-residential) and commercial loans. Loans are graded on a scale from 1 to 9. Non-impaired real estate and commercial loans are assigned an allowance factor which increases with the severity of risk grading. A general description of the characteristics of the risk grades is as follows:
Pass Grades
| • | Risk Grade 1 loans have little or no risk and are generally secured by cash or cash equivalents; |
| • | Risk Grade 2 loans have minimal risk to well qualified borrowers and no significant questions as to safety; |
| • | Risk Grade 3 loans are satisfactory loans with strong borrowers and secondary sources of repayment; |
| • | Risk Grade 4 loans are satisfactory loans with borrowers not as strong as risk grade 3 loans but may exhibit a higher degree of financial risk based on the type of business supporting the loan; and |
| • | Risk Grade 5 loans are loans that warrant more than the normal level of supervision and have the possibility of an event occurring that may weaken the borrower’s ability to repay. |
Special Mention
| • | Risk Grade 6 loans have increasing potential weaknesses beyond those at which the loan originally was granted and if not addressed could lead to inadequately protecting the Company’s credit position. |
Classified Grades
| • | Risk Grade 7 loans are substandard loans and are inadequately protected by the current sound worth or paying capacity of the obligor or the collateral pledged. These have well defined weaknesses that jeopardize the liquidation of the debt with the distinct possibility the Company will sustain some loss if the deficiencies are not corrected; |
| • | Risk Grade 8 loans are doubtful of collection and the possibility of loss is high but pending specific borrower plans for recovery, its classification as a loss is deferred until its more exact status is determined; and |
| • | Risk Grade 9 loans are loss loans which are considered uncollectable and of such little value that their continuance as a bank asset is not warranted. |
The Company uses a past due grading system for consumer loans, including one to four family residential first and seconds and home equity lines. The past due status of a loan is based on the contractual due date of the most delinquent payment due. The consumer loans are segregated between performing and nonperforming loans. Performing loans are those that have made timely payments in accordance with the terms of the loan agreement and are not past due 90 days or more. Nonperforming loans are those that do not accrue interest or are greater than 90 days past due and accruing interest. The past due grading of consumer loans is based on the following categories: current, 1-29 days past due, 30-59 days past due, 60-89 days past due and over 90 days past due. Non-impaired consumer loans are assigned an allowance factor which increases with the severity of past due status. This component of the allowance reflects the margin of imprecision inherent in the underlying assumptions used in the methodologies for estimating specific and general losses in the loan portfolio.
Management believes that the level of the allowance for loan losses is appropriate. While management uses available information to recognize losses on loans, future additions to the allowance for loan losses may be necessary based on changes in economic conditions. In addition, various regulatory agencies, as an integral part of their examination process, periodically review the Company’s allowance for loan losses. Such agencies may require the Company to recognize additions to the allowance for loan losses or may require that certain loan balances be charged-off or downgraded into classified loan categories when their credit evaluations differ from those of management based on their judgments about information available to them at the time of their examinations.
Transfers of Financial Assets
Transfers of financial assets are accounted for as sales when control over the assets has been surrendered. Control over financial assets is deemed to be surrendered when: 1) the assets have been isolated from the Company, put presumptively beyond reach of the transferor and its creditors, even in bankruptcy or other receivership; 2) the transferee obtains the right (free of conditions that constrain it from taking advantage of that right) to pledge or exchange the transferred assets; and 3) the Company does not maintain effective control over the transferred assets through an agreement to repurchase them before their maturity or the ability to unilaterally cause the holder to return specific assets.
F - 10
Table of Contents
Off-Balance Sheet Financial Instruments
In the ordinary course of business, the Company has entered into off-balance sheet financial instruments consisting of commitments to extend credit, commercial letters of credit and standby letters of credit. Such financial instruments are recorded in the financial statements when they become payable.
Other Real Estate Owned
Real estate acquired through, or in lieu of, foreclosure is held for sale and is stated at the lower of cost or estimated fair market value of the property, less estimated disposal costs, if any. Cost includes loan principal and accrued interest. Any excess of cost over the estimated fair market value at the time of acquisition is charged to the allowance for loan losses. The estimated fair market value is reviewed periodically by management and any write-downs are charged against current earnings. Development and improvement costs relating to property are capitalized. Net operating income or expenses of such properties are included in collection, repossession and other real estate owned expenses.
Bank Premises and Equipment
Land is carried at cost with no depreciation. Premises and equipment are stated at cost, less accumulated depreciation. Depreciation is computed generally by the straight-line method for financial reporting purposes. Depreciation for tax purposes is computed based on accelerated methods. It is the Company’s policy for maintenance and repairs to be charged to expense as incurred and to capitalize major additions and improvements and depreciate the cost thereof over the estimated useful lives.
Upon sale or retirement of depreciable properties, the cost and related accumulated depreciation are netted against proceeds and any resulting gain or loss is reflected in income.
Goodwill and Intangible Assets
The excess of the cost of an acquisition over the fair value of the net assets acquired consists primarily of goodwill, core deposit intangibles, and other identifiable intangibles. Acquired intangible assets (such as core deposit intangibles) are separately recognized if the benefit of the asset can be sold, transferred, licensed, rented or exchanged, and are amortized over their useful life. Goodwill is not amortized but is subject to impairment tests on at least an annual basis or earlier whenever an event occurs indicating that goodwill may be impaired. In assessing the recoverability of the Company’s goodwill, all of which was recognized in connection with the acquisition of branches in 2003 and 2008, the Company must make assumptions in order to determine the fair value of the respective assets. Any impairment of goodwill will be recognized as an expense in the period of impairment and such impairment could be material. The Company completes the annual goodwill impairment test during the fourth quarter of each year. Based on annual testing, there were no impairment charges in 2010, 2009 or 2008.
Core deposit intangible assets have estimated finite lives and are being amortized on a straight-line basis over the expected benefit period, which ranges from 2.39 to 7.0 years. Core deposit intangibles, net of amortization, amounted to $0 thousand and $215 thousand at December 31, 2010 and 2009, respectively. Core deposit intangible assets are included in other assets in the consolidated balance sheets.
During the third quarter of 2010, the Company sold certain 1-4 residential mortgage loans and retained the right to service the loans sold. Upon sale, a mortgage servicing rights asset was capitalized in the amount of $214 thousand, which represents the then current fair value of future net cash flows expected to be realized for performing servicing activities. Mortgage servicing rights are amortized in proportion to and over the period of estimated net servicing income, which is 4 years. Mortgage servicing rights, net of accumulated amortization, amounted to $201 thousand at December 31, 2010 and are included in other assets in the consolidated balance sheets. The Company earns fees for servicing these residential mortgage loans. These fees are generally calculated on the outstanding principal balance of the loans serviced and are recorded as income when earned. Loan servicing income amounted to $20 thousand, $0 thousand and $0 thousand for the years ended December 31, 2010, 2009 and 2008, respectively and is included in other operating income in the consolidated statements of operations.
Income Taxes
F - 11
Table of Contents
The Company determines deferred income tax assets and liabilities using the liability (or balance sheet) method. Under this method, the net deferred tax asset or liability is determined annually for differences between the financial statement and tax bases of assets and liabilities that will result in taxable or deductible amounts in the future based on enacted tax laws and rates applicable to the periods in which the differences are expected to affect taxable income. Income tax expense is the tax payable or refundable for the period plus or minus the change during the period in deferred tax assets and liabilities.
When tax returns are filed, it is highly certain that some positions taken would be sustained upon examination by the taxing authorities, while others are subject to uncertainty about the merits of the position taken or the amount of the position that would be ultimately sustained. The benefit of a tax position is recognized in the financial statements in the period during which, based on all available evidence, management believes it is more likely than not that the position will be sustained upon examination, including the resolution of appeals or litigation processes, if any. Tax positions taken are not offset or aggregated with other positions. Tax positions that meet the more-likely-than-not recognition threshold are measured as the largest amount of tax benefit that is more than 50 percent likely of being realized upon settlement with the applicable taxing authority. The portion of the benefits associated with tax positions taken that exceeds the amount measured as described above is reflected as a liability for unrecognized tax benefits in the consolidated balance sheets along with any associated interest and penalties that would be payable to the taxing authorities upon examination. Interest and penalties associated with unrecognized tax benefits are classified as additional income taxes in the consolidated statements of operations.
Retirement Plan
The Company has a defined benefit pension plan. Effective January 28, 2008, the Company took action to freeze the plan with no additional contributions for a majority of participants. Employees age 55 or greater or with 10 years of credited service were grandfathered in the plan. No additional participants have been added to the plan. Effective February 28, 2011, the Company took action to again freeze the plan with no additional contributions for grandfathered participants. Benefits for all participants will remain frozen in the plan until such time as further action occurs. See Note 9 – Employee Benefit Plans.
Stock Compensation Plans
At December 31, 2010, the Company had two stock based compensation plans. The Company accounts for these plans under the provisions of FASB ASC Topic 718 “Compensation – Stock Compensation.” Compensation expense for grants of restricted shares is accounted for using the fair market value of the Company’s common stock on the date the restricted shares are awarded. Compensation expense for grants of stock options is accounted for using the Black-Scholes option-pricing model. Compensation expense for restricted shares and stock options is charged to income ratably over the vesting period. Compensation expense recognized is included in salaries and employee benefits expense in the consolidated statements of operations. See Note 13 – Stock Based Compensation Plans.
Fair Value Measurements
The Company follows the provisions of FASB ASC Topic 820 “Fair Value Measurements and Disclosures”, for financial assets and financial liabilities. FASB ASC Topic 820 defines fair value, establishes a framework for measuring fair value in generally accepted accounting principles, and expands disclosures about fair value measurements. See Note 19 - Fair Value Measurements.
Segment Reporting
Public business enterprises are required to report information about operating segments in annual financial statements and selected information about operating segments in financial reports issued to shareholders. Operating segments are components of an enterprise about which separate financial information is available that is evaluated regularly by management in deciding how to allocate resources and in assessing their performance. Generally, financial information is required to be reported on the basis that is used internally for evaluating segment performance and deciding how to allocate resources to segments. The Company has determined that it has one significant operating segment, the providing of general commercial financial services to customers located in the geographic areas of our retail branch network.
Earnings (Loss) Per Share
F - 12
Table of Contents
Basic earnings (loss) per share represents income (loss) available to common shareholders divided by the weighted-average number of common shares outstanding during the period. Diluted earnings (loss) per share reflects additional common shares that would have been outstanding if dilutive potential common shares had been issued, as well as any adjustment to income (loss) that would result from the assumed issuance. Potential common shares that may be issued by the Company relate to outstanding stock options and restricted stock awards, and are determined using the treasury method. Earnings (loss) per share calculations are presented in Note 11.
Advertising Costs
The Company practices the policy of charging advertising costs to expense as incurred. Advertising expense totaled $944 thousand, $500 thousand, and $559 thousand for the three years ended December 31, 2010, 2009 and 2008, respectively.
Comprehensive Income
FASB ASC Topic 220 “Comprehensive Income” establishes standards for the reporting and presentation of comprehensive income and its components (revenues, expenses, gains and losses) within the Company’s consolidated financial statements. Although certain changes in assets and liabilities, such as unrealized gains and losses on available for sale securities, and pension liability adjustments, are reported as a separate component of the equity section of the balance sheet, such items, along with net income (loss), are components of comprehensive income (loss).
Recent Significant Accounting Pronouncements:
Adoption of New Accounting Standards:
In June 2009, the FASB issued new guidance relating to the accounting for transfers of financial assets. The new guidance, which was issued as SFAS No. 166, “Accounting for Transfers of Financial Assets, an amendment to SFAS No. 140”, was adopted into Codification in December 2009 through the issuance of Accounting Standards Update (“ASU”) 2009-16. The new standard provides guidance to improve the relevance, representational faithfulness, and comparability of the information that an entity provides in its financial statements about a transfer of financial assets; the effects of a transfer on its financial position, financial performance, and cash flows; and a transferor’s continuing involvement, if any, in transferred financial assets. The adoption of the new guidance did not have a material impact on the Company’s consolidated financial statements.
In June 2009, the FASB issued new guidance relating to variable interest entities. The new guidance, which was issued as SFAS No. 167, “Amendments to FASB Interpretation No. 46(R),” was adopted into Codification in December 2009. The objective of the guidance is to improve financial reporting by enterprises involved with variable interest entities and to provide more relevant and reliable information to users of financial statements. SFAS No. 167 was effective as of January 1, 2010. The adoption of the new guidance did not have a material impact on the Company’s consolidated financial statements.
In January 2010, the FASB issued Accounting Standards Update No. 2010-06, “Fair Value Measurements and Disclosures (Topic 820): Improving Disclosures about Fair Value Measurements.” ASU 2010-06 amends Subtopic 820-10 to clarify existing disclosures, require new disclosures, and includes conforming amendments to guidance on employers’ disclosures about postretirement benefit plan assets. ASU 2010-06 is effective for interim and annual periods beginning after December 15, 2009, except for disclosures about purchases, sales, issuances, and settlements in the roll forward of activity in Level 3 fair value measurements. Those disclosures are effective for fiscal years beginning after December 15, 2010 and for interim periods within those fiscal years. The adoption of the new guidance did not have a material impact on the Company’s consolidated financial statements.
In February 2010, the FASB issued Accounting Standards Update No. 2010-09, “Subsequent Events (Topic 855): Amendments to Certain Recognition and Disclosure Requirements.” ASU 2010-09 addresses both the interaction of the requirements of Topic 855 with the SEC’s reporting requirements and the intended breadth of the reissuance disclosures provisions related to subsequent events. An entity that is a Securities and Exchange Commission (“SEC”) filer is not required to disclose the date through which subsequent events have been evaluated. ASU 2010-09 was effective immediately. The adoption of the new guidance did not have a material impact on the Company’s consolidated financial statements.
F - 13
Table of Contents
In July 2010, the FASB issued ASU 2010-20, “Disclosures about the Credit Quality of Financing Receivables and the Allowance for Credit Losses.” The new disclosure guidance will significantly expand the existing requirements and will lead to greater transparency into a company’s exposure to credit losses from lending arrangements. The extensive new disclosures of information as of the end of a reporting period will become effective for both interim and annual reporting periods ending after December 15, 2010. Specific items regarding activity that occurred before the issuance of the ASU, such as the allowance roll forward and modification disclosures will be required for periods beginning after December 15, 2010. See Note 3 for additional disclosures required under this accounting standard.
On September 17, 2010, the SEC issued Release No. 33-9144, “Commission Guidance on Presentation of Liquidity and Capital Resources Disclosures in Management’s Discussion and Analysis.” This interpretive release is intended to improve discussion of liquidity and capital resources in Management’s Discussion and Analysis of Financial Condition and Results of Operations in order to facilitate understanding by investors of the liquidity and funding risks facing the registrant. This release was issued in conjunction with a proposed rule, “Short-Term Borrowings Disclosure,” that would require public companies to disclose additional information to investors about their short-term borrowing arrangements. Release No. 33-9144 was effective on September 28, 2010.
New Accounting Standards Not Yet Adopted:
In January 2011, the FASB issued ASU 2011-01, “Deferral of the Effective Date of Disclosures about Troubled Debt Restructurings in Update No. 2010-20.” The amendments in this ASU temporarily delay the effective date of the disclosures about troubled debt restructurings in ASU 2010-20 for public entities. The delay is intended to allow the FASB time to complete its deliberations on what constitutes a troubled debt restructuring. The effective date of the new disclosures about troubled debt restructurings for public entities and the guidance for determining what constitutes a troubled debt restructuring will then be coordinated. Currently, that guidance is anticipated to be effective for interim and annual periods ending after June 15, 2011.
In December 2010, the FASB issued ASU 2010-28, “When to Perform Step 2 of the Goodwill Impairment Test for Reporting Units with Zero or Negative Carrying Amounts.” The amendments in this ASU modify Step 1 of the goodwill impairment test for reporting units with zero or negative carrying amounts. For those reporting units, an entity is required to perform Step 2 of the goodwill impairment test if it is more likely than not that a goodwill impairment exists. For public entities, the amendments in this Update are effective for fiscal years, and interim periods within those years, beginning after December 15, 2010. Early adoption is not permitted. The adoption of the new guidance is not expected to have a material impact on the Company’s consolidated financial statements.
The SEC has issued Final Rule No. 33-9002, “Interactive Data to Improve Financial Reporting,” which requires companies to submit financial statements in XBRL (extensible business reporting language) format with their SEC filings on a phased-in schedule. Large accelerated filers and foreign large accelerated filers using U.S. GAAP were required to provide interactive data reports starting with their first quarterly report for fiscal periods ending on or after June 15, 2010. All remaining filers are required to provide interactive data reports starting with their first quarterly report for fiscal periods ending on or after June 15, 2011.
Note 2. Investment Securities
The amortized cost and estimated fair value, with gross unrealized gains and losses, of securities at December 31, 2010 and 2009 were as follows:
F - 14
Table of Contents
| (dollars in thousands) | December 31, 2010 | |||||||||||||||
| Amortized Cost |
Gross Unrealized Gains |
Gross Unrealized Losses |
Estimated Fair Value |
|||||||||||||
| Available for Sale: |
||||||||||||||||
| Obligations of U.S. Government agencies |
$ | 23,982 | $ | — | $ | 153 | $ | 23,829 | ||||||||
| SBA Pool securities |
62,685 | 39 | 834 | 61,890 | ||||||||||||
| Agency mortgage-backed securities |
46,780 | 32 | 528 | 46,284 | ||||||||||||
| Agency CMO securities |
41,855 | 26 | 404 | 41,477 | ||||||||||||
| Non agency CMO securities |
12,093 | 62 | 113 | 12,042 | ||||||||||||
| State and political subdivisions |
58,780 | 224 | 1,658 | 57,346 | ||||||||||||
| Pooled trust preferred securities |
545 | 26 | — | 571 | ||||||||||||
| FNMA and FHLMC preferred stock |
77 | 16 | 4 | 89 | ||||||||||||
| Corporate securities |
2,597 | 30 | 35 | 2,592 | ||||||||||||
| Total |
$ | 249,394 | $ | 455 | $ | 3,729 | $ | 246,120 | ||||||||
| (dollars in thousands) | December 31, 2009 | |||||||||||||||
| Amortized Cost |
Gross Unrealized Gains |
Gross Unrealized Losses |
Estimated Fair Value |
|||||||||||||
| Available for Sale: |
||||||||||||||||
| Obligations of U.S. Government agencies |
$ | 34,180 | $ | 393 | $ | 51 | $ | 34,522 | ||||||||
| Agency mortgage-backed securities |
39,774 | 1,712 | 5 | 41,481 | ||||||||||||
| Agency CMO securities |
29,727 | 479 | 214 | 29,992 | ||||||||||||
| Non agency CMO securities |
5,149 | 36 | 40 | 5,145 | ||||||||||||
| State and political subdivisions |
47,938 | 775 | 641 | 48,072 | ||||||||||||
| Pooled trust preferred securities |
632 | 56 | — | 688 | ||||||||||||
| FNMA and FHLMC preferred stock |
77 | 49 | — | 126 | ||||||||||||
| Corporate securities |
10,819 | 145 | 1,548 | 9,416 | ||||||||||||
| Total |
$ | 168,296 | $ | 3,645 | $ | 2,499 | $ | 169,442 | ||||||||
There are no securities classified as “Held to Maturity” or “Trading.” Our mortgage-backed securities consist entirely of residential mortgage-backed securities. We do not hold any commercial mortgage-backed securities. Our mortgage-backed securities are all agency backed and AAA-rated with no subprime issues.
Our pooled trust preferred securities include one senior issue of Preferred Term Securities XXVII which is current on all payments and on which we took an impairment charge in the third quarter of 2009 to reduce our book value to the market value at September 30, 2009. As of December 31, 2010, that security has an estimated fair value that is $26 thousand greater than its amortized cost after impairment. During the second quarter of 2010 we recognized an impairment charge in the amount of $77 thousand on our investment in Preferred Term Securities XXIII mezzanine tranche, thus reducing the book value to $0. The decision to recognize the other-than-temporary impairment was based upon an analysis of the market value of the discounted cash flow for the security as provided by Moody’s at June 30, 2010, which indicated that the Company was unlikely to recover any of its remaining investment in these securities.
The amortized cost and estimated fair values of securities at December 31, 2010, by the earlier of contractual maturity or expected maturity, are shown below. Expected maturities may differ from contractual maturities because issuers may have the right to call or prepay obligations without penalties.
F - 15
Table of Contents
| December 31, 2010 | ||||||||
| (dollars in thousands) | Amortized Cost |
Estimated Fair Value |
||||||
| Due in one year or less |
$ | 23,675 | $ | 23,677 | ||||
| Due after one year through five years |
72,573 | 71,889 | ||||||
| Due after five years through ten years |
128,151 | 126,114 | ||||||
| Due after ten years |
24,995 | 24,440 | ||||||
| Total |
$ | 249,394 | $ | 246,120 | ||||
Proceeds from the sales of securities available for sale for the years ended December 31, 2010, 2009 and 2008 were $105.2 million, $976 thousand and $5.6 million, respectively. Net realized gains on the sales of securities available for sale for the years ended December 31, 2010, 2009 and 2008 were $2.5 million, $66 thousand and $44 thousand, respectively.
The Company pledges securities to secure public deposits, balances with the Federal Reserve Bank and repurchase agreements. Securities with an aggregate book value of $102.1 million and an aggregate fair value of $100.7 million were pledged at December 31, 2010. Securities with an aggregate book value of $60.8 million and an aggregate fair value of $61.7 million were pledged at December 31, 2009.
Securities in an unrealized loss position at December 31, 2010, by duration of the period of the unrealized loss, are shown below.
| December 31, 2010 | ||||||||||||||||||||||||
| (dollars in thousands) | Less than 12 months | 12 months or more | Total | |||||||||||||||||||||
| Description of Securities |
Fair Value | Unrealized Loss |
Fair Value |
Unrealized Loss |
Fair Value | Unrealized Loss |
||||||||||||||||||
| Obligations of U.S. Government agencies |
$ | 23,829 | $ | 153 | $ | — | $ | — | $ | 23,829 | $ | 153 | ||||||||||||
| SBA Pool securities |
51,306 | 834 | — | — | 51,306 | 834 | ||||||||||||||||||
| Agency mortgage-backed securities |
34,422 | 528 | — | — | 34,422 | 528 | ||||||||||||||||||
| Agency CMO securities |
31,373 | 404 | — | — | 31,373 | 404 | ||||||||||||||||||
| Non agency CMO securities |
8,604 | 95 | 505 | 18 | 9,109 | 113 | ||||||||||||||||||
| State and political subdivisions |
38,525 | 1,317 | 1,658 | 341 | 40,183 | 1,658 | ||||||||||||||||||
| FNMA and FHLMC preferred stock |
22 | 4 | — | — | 22 | 4 | ||||||||||||||||||
| Corporate securities |
965 | 35 | — | — | 965 | 35 | ||||||||||||||||||
| Total |
$ | 189,046 | $ | 3,370 | $ | 2,163 | $ | 359 | $ | 191,209 | $ | 3,729 | ||||||||||||
The Company reviews the investment securities portfolio on a quarterly basis to monitor its exposure to other-than-temporary impairment that may result due to the current adverse economic conditions and associated credit deterioration. A determination as to whether a security’s decline in market value is other-than-temporary takes into consideration numerous factors and the relative significance of any single factor can vary by security. Some factors the Company may consider in the other-than-temporary impairment analysis include, the length of time the security has been in an unrealized loss position, changes in security ratings, financial condition of the issuer, as well as security and industry specific economic conditions. In addition, with regards to its securities, the Company may also evaluate payment structure, whether there are defaulted payments or expected defaults, prepayment speeds, and the value of any underlying collateral. For certain securities in unrealized loss positions, the Company will enlist independent third-party firms to prepare cash flow analyses to compare the present value of cash flows expected to be collected from the security with the amortized cost basis of the security.
Based on the Company’s evaluation, management does not believe any remaining unrealized loss at December 31, 2010, represents an other-than-temporary impairment as these unrealized losses are primarily attributable to changes in interest rates and the current volatile market conditions, and not credit deterioration. At December 31, 2010, there are 104 debt securities with fair values totaling $191.2 million considered temporarily impaired. Of these debt securities, 100 with fair values totaling $189.0 million were in an unrealized loss position of less than 12 months and 4 with fair values totaling $2.2 million were in an unrealized loss position of 12 months or more. Because the Company intends to hold these investments in debt securities to maturity and it is more likely than not that the Company will not
F - 16
Table of Contents
be required to sell these investments before a recovery of unrealized losses, the Company does not consider these investments to be other-than-temporarily impaired at December 31, 2010 and no impairment has been recognized. At December 31, 2010, there is 1 equity security with a fair value of $22 thousand in an unrealized loss position of less than 12 months. The Company has the intent and ability to hold this equity security until a recovery of the unrealized loss and therefore does not consider this investment to be other-than-temporarily impaired at December 31, 2010.
Securities in an unrealized loss position at December 31, 2009, by duration of the period of the unrealized loss, are shown below.
| December 31, 2009 | ||||||||||||||||||||||||
| (dollars in thousands) | Less than 12 months | 12 months or more | Total | |||||||||||||||||||||
| Description of Securities |
Fair Value |
Unrealized Loss |
Fair Value |
Unrealized Loss |
Fair Value |
Unrealized Loss |
||||||||||||||||||
| Obligations of U.S. Government agencies |
$ | 26,966 | $ | 51 | $ | — | $ | — | $ | 26,966 | $ | 51 | ||||||||||||
| Agency mortgage-backed securities |
898 | 3 | 217 | 2 | 1,115 | 5 | ||||||||||||||||||
| Agency CMO securities |
13,174 | 214 | — | — | 13,174 | 214 | ||||||||||||||||||
| Non agency CMO securities |
— | — | 760 | 40 | 760 | 40 | ||||||||||||||||||
| State and political subdivisions |
6,440 | 127 | 4,511 | 514 | 10,951 | 641 | ||||||||||||||||||
| Corporate securities |
860 | 140 | 5,914 | 1,408 | 6,774 | 1,548 | ||||||||||||||||||
| Total |
$ | 48,338 | $ | 535 | $ | 11,402 | $ | 1,964 | $ | 59,740 | $ | 2,499 | ||||||||||||
As of December 31, 2010, there were no corporate securities in an unrealized loss position for 12 months or more. Corporate securities in an unrealized loss position for 12 months or more as of December 31, 2009, is shown below.
| December 31, 2009 (dollars in thousands) Issuer |
Amortized Cost Basis |
Fair Value |
Unrealized Loss |
Maturity | Current Market Yield |
Moody/S&P Credit Rating |
Excess Subordination |
Security Priority |
||||||||||||||||||||||||
| HSBC CPI Floating CPI + 255 basis points |
$ | 599 | $ | 532 | $ | (67 | ) | 2013 | 5.21 | % | A3/A | none | senior | |||||||||||||||||||
| SLM Corp Floating 1 Month CPI + 212.5 basis points |
1,000 | 769 | (231 | ) | 2013 | 7.49 | % | Ba1/BBB- | none | senior | ||||||||||||||||||||||
| SLM Corp Floating 1 Month CPI + 200 basis points |
1,000 | 712 | (288 | ) | 2014 | 8.72 | % | Ba1/BBB- | none | senior | ||||||||||||||||||||||
| SLM Corp Floating 1 Month CPI + 162 basis points |
1,000 | 709 | (291 | ) | 2014 | 8.54 | % | Ba1/BBB- | none | senior | ||||||||||||||||||||||
| Bear Stearns/J P Morgan Floating CPI + 145 basis points |
1,000 | 987 | (13 | ) | 2014 | 1.59 | % | Aa3/A+ | none | senior | ||||||||||||||||||||||
| GMAC 6.25% Fixed Rate |
500 | 411 | (89 | ) | 2013 | 12.62 | % | CCC | none | senior | ||||||||||||||||||||||
| GMAC 6.15% Fixed Rate |
1,500 | 1,091 | (409 | ) | 2016 | 12.61 | % | CCC | none | senior | ||||||||||||||||||||||
| GMAC 6.875% Fixed Rate |
723 | 703 | (20 | ) | 2018 | 12.57 | % | CCC | none | senior | ||||||||||||||||||||||
| Total |
$ | 7,322 | $ | 5,914 | $ | (1,408 | ) | |||||||||||||||||||||||||
In 2009, the Company recognized an $18.9 million other-than-temporary impairment charge related to its investments in pooled trust preferred securities. The impairment in these securities was determined to be the result of a lack of an orderly market for nonperforming pooled trust preferred securities due to credit issues in this class of securities. The model used by the independent securities appraisal firm to develop the fair market value considered performing collateral ratios, the level of subordination to senior tranches of the securities, credit ratings of and projected credit defaults in the underlying collateral and the discounted present value of projected future cash flows.
The table below presents a roll forward of the credit loss component recognized in earnings (referred to as “credit-impaired debt securities”) on debt securities held by the Company for which a portion of an other-than-temporary impairment was recognized in other comprehensive income during 2009. Changes in the credit loss component of credit-impaired debt securities were:
F - 17
Table of Contents
| (dollars in thousands) |
Year Ended December 31, 2010 |
|||
| Balance, beginning of period |
$ | 18,919 | ||
| Adjustment for debt securities that were totally written off in 2009 |
(15,626 | ) | ||
| Adjustment for 2009 impairment |
(17 | ) | ||
| Balance, beginning of period as restated |
3,276 | |||
| Additions |
||||
| Initial credit impairments |
— | |||
| Subsequent credit impairments |
77 | |||
| Reductions |
||||
| Subsequent chargeoff of previously impaired credits |
(3,014 | ) | ||
| Balance, end of period |
$ | 339 | ||
The Company’s investment in FHLB stock totaled $8.3 million and $7.5 million at December 31, 2010 and 2009, respectively. FHLB stock is generally viewed as a long-term investment and as a restricted investment security, which is carried at cost, because there is no market for the stock other than the FHLBs or member institutions. Therefore, when evaluating FHLB stock for impairment, its value is based on the ultimate recoverability of the par value rather than by recognizing temporary declines in value. Despite the FHLB’s temporary suspension of repurchases of excess capital stock for parts of 2009 and 2010, the Company does not consider this investment to be other-than-temporarily impaired at December 31, 2010 and no impairment has been recognized. FHLB stock is included in a separate line item on the consolidated balance sheets (Restricted securities, at cost) and is not part of the Company’s securities available for sale portfolio.
Note 3. Loan Portfolio
The following table sets forth the composition of the Company’s loan portfolio in dollar amounts and as a percentage of the Company’s total gross loans at the dates indicated:
| December 31, 2010 | December 31, 2009 | |||||||||||||||
| (dollars in thousands) |
Amount | Percent | Amount | Percent | ||||||||||||
| Commercial, industrial and agricultural |
$ | 72,790 | 9.39 | % | $ | 82,563 | 9.68 | % | ||||||||
| Real estate - one to four family residential: |
||||||||||||||||
| Closed end first and seconds |
260,442 | 33.62 | % | 297,675 | 34.89 | % | ||||||||||
| Home equity lines |
93,387 | 12.05 | % | 86,084 | 10.09 | % | ||||||||||
| Total real estate - one to four family residential |
353,829 | 45.67 | % | 383,759 | 44.98 | % | ||||||||||
| Real estate - multifamily residential |
11,682 | 1.51 | % | 8,141 | 0.95 | % | ||||||||||
| Real estate - construction: |
||||||||||||||||
| One to four family residential |
25,454 | 3.29 | % | 36,930 | 4.33 | % | ||||||||||
| Other construction, land development and other land |
50,841 | 6.56 | % | 50,852 | 5.96 | % | ||||||||||
| Total real estate - construction |
76,295 | 9.85 | % | 87,782 | 10.29 | % | ||||||||||
| Real estate - farmland |
8,304 | 1.07 | % | 8,946 | 1.06 | % | ||||||||||
| Real estate - non-farm, non-residential: |
||||||||||||||||
| Owner occupied |
134,186 | 17.32 | % | 150,119 | 17.60 | % | ||||||||||
| Non-owner occupied |
78,396 | 10.12 | % | 84,557 | 9.91 | % | ||||||||||
| Total real estate - non-farm, non-residential |
212,582 | 27.44 | % | 234,676 | 27.51 | % | ||||||||||
| Consumer |
36,000 | 4.65 | % | 42,416 | 4.97 | % | ||||||||||
| Other |
3,294 | 0.42 | % | 4,786 | 0.56 | % | ||||||||||
| Total loans |
774,776 | 100.00 | % | 853,069 | 100.00 | % | ||||||||||
| Less unearned income |
(2 | ) | (6 | ) | ||||||||||||
| Less allowance for loan losses |
(25,288 | ) | (12,155 | ) | ||||||||||||
| Loans, net |
$ | 749,486 | $ | 840,908 | ||||||||||||
F - 18
Table of Contents
The following table presents the aging of the recorded investment in past due loans as of December 31, 2010 by class of loans:
| (dollars in thousands) |
30-59 Days Past Due |
60-89 Days Past Due |
Over 90 Days Past Due |
Total Past Due | Total Current* |
Total Loans |
||||||||||||||||||
| Commercial, industrial and agricultural |
$ | 978 | $ | 423 | $ | 474 | $ | 1,875 | $ | 70,915 | $ | 72,790 | ||||||||||||
| Real estate - one to four family residential: |
||||||||||||||||||||||||
| Closed end first and seconds |
6,262 | 3,182 | 6,319 | 15,763 | 244,679 | 260,442 | ||||||||||||||||||
| Home equity lines |
629 | 80 | 854 | 1,563 | 91,824 | 93,387 | ||||||||||||||||||
| Total real estate - one to four family residential |
6,891 | 3,262 | 7,173 | 17,326 | 336,503 | 353,829 | ||||||||||||||||||
| Real estate - multifamily residential |
— | — | — | — | 11,682 | 11,682 | ||||||||||||||||||
| Real estate - construction: |
||||||||||||||||||||||||
| One to four family residential |
1,182 | 202 | 921 | 2,305 | 23,149 | 25,454 | ||||||||||||||||||
| Other construction, land development and other land |
638 | — | 3,435 | 4,073 | 46,768 | 50,841 | ||||||||||||||||||
| Total real estate - construction |
1,820 | 202 | 4,356 | 6,378 | 69,917 | 76,295 | ||||||||||||||||||
| Real estate - farmland |
— | 188 | — | 188 | 8,116 | 8,304 | ||||||||||||||||||
| Real estate - non-farm, non-residential: |
||||||||||||||||||||||||
| Owner occupied |
1,054 | 549 | 810 | 2,413 | 131,773 | 134,186 | ||||||||||||||||||
| Non-owner occupied |
— | 128 | 3,903 | 4,031 | 74,365 | 78,396 | ||||||||||||||||||
| Total real estate - non-farm, non-residential |
1,054 | 677 | 4,713 | 6,444 | 206,138 | 212,582 | ||||||||||||||||||
| Consumer |
1,073 | 91 | 412 | 1,576 | 34,424 | 36,000 | ||||||||||||||||||
| Other |
2 | — | — | 2 | 3,292 | 3,294 | ||||||||||||||||||
| Total loans |
$ | 11,818 | $ | 4,843 | $ | 17,128 | $ | 33,789 | $ | 740,987 | $ | 774,776 | ||||||||||||
| * | For purposes of this table only, the “Total Current” column includes loans that are 1-29 days past due. |
The following table presents nonaccrual loans, loans past due 90 days and accruing interest, and restructured loans at December 31:
| (dollars in thousands) |
2010 | 2009 | ||||||
| Nonaccrual loans |
$ | 25,858 | $ | 19,321 | ||||
| Loans past due 90 days and accruing interest |
1,836 | 3,090 | ||||||
| Restructured loans (accruing) |
2,411 | 6,003 | ||||||
At December 31, 2010 and 2009, there were approximately $6.2 million and $696 thousand, respectively, in restructured loans (TDRs) included in nonaccrual loans.
The following table presents the recorded investment in nonaccrual loans and loans past due 90 days and accruing interest by class at December 31, 2010 and 2009.
F - 19
Table of Contents
| Over 90 Days Past | ||||||||||||||||
| Nonaccrual | Due and Accruing | |||||||||||||||
| (dollars in thousands) |
2010 | 2009 | 2010 | 2009 | ||||||||||||
| Commercial, industrial and agricultural |
$ | 446 | $ | 4,505 | $ | — | $ | — | ||||||||
| Real estate - one to four family residential: |
||||||||||||||||
| Closed end first and seconds |
8,337 | 4,194 | 997 | 2,104 | ||||||||||||
| Home equity lines |
664 | 340 | 190 | 80 | ||||||||||||
| Total real estate - one to four family residential |
9,001 | 4,534 | 1,187 | 2,184 | ||||||||||||
| Real estate - construction: |
||||||||||||||||
| One to four family residential |
564 | 420 | 437 | 404 | ||||||||||||
| Other construction, land development and other land |
7,437 | 3,900 | 148 | 427 | ||||||||||||
| Total real estate - construction |
8,001 | 4,320 | 585 | 831 | ||||||||||||
| Real estate - non-farm, non-residential: |
||||||||||||||||
| Owner occupied |
3,981 | 4,163 | — | — | ||||||||||||
| Non-owner occupied |
4,030 | 1,694 | — | — | ||||||||||||
| Total real estate - non-farm, non-residential |
8,011 | 5,857 | — | — | ||||||||||||
| Consumer |
399 | 105 | 64 | 75 | ||||||||||||
| Total loans |
$ | 25,858 | $ | 19,321 | $ | 1,836 | $ | 3,090 | ||||||||
If interest income had been recognized on nonaccrual loans at their stated rates during years 2010, 2009 and 2008, interest income would have increased by approximately $1.6 million, $893 thousand and $571 thousand, respectively.
The following table presents commercial loans by credit quality indicator at December 31, 2010.
| (dollars in thousands) |
Pass | Special Mention |
Substandard | Doubtful | Impaired | Total | ||||||||||||||||||
| Commercial, industrial and agricultural |
$ | 58,812 | $ | 8,187 | $ | 5,228 | $ | 114 | $ | 449 | $ | 72,790 | ||||||||||||
| Real estate - multifamily residential |
10,591 | 1,091 | — | — | — | 11,682 | ||||||||||||||||||
| Real estate - construction: |
||||||||||||||||||||||||
| One to four family residential |
22,642 | 613 | 1,434 | 231 | 534 | 25,454 | ||||||||||||||||||
| Other construction, land development and other land |
17,361 | 4,485 | 10,561 | 156 | 18,278 | 50,841 | ||||||||||||||||||
| Total real estate - construction |
40,003 | 5,098 | 11,995 | 387 | 18,812 | 76,295 | ||||||||||||||||||
| Real estate - farmland |
6,915 | 608 | 781 | — | — | 8,304 | ||||||||||||||||||
| Real estate - non-farm, non-residential: |
||||||||||||||||||||||||
| Owner occupied |
79,335 | 35,989 | 10,185 | 267 | 8,410 | 134,186 | ||||||||||||||||||
| Non-owner occupied |
48,271 | 12,570 | 5,232 | — | 12,323 | 78,396 | ||||||||||||||||||
| Total real estate - non-farm, non-residential |
127,606 | 48,559 | 15,417 | 267 | 20,733 | 212,582 | ||||||||||||||||||
| Total commercial loans |
$ | 243,927 | $ | 63,543 | $ | 33,421 | $ | 768 | $ | 39,994 | $ | 381,653 | ||||||||||||
At December 31, 2010, the Company does not have any loans classified as Loss.
The following table presents consumer loans, including one to four family residential first and seconds and home equity lines by payment activity at December 31, 2010.
| (dollars in thousands) |
Performing | Nonperforming | Total | |||||||||
| Real estate - one to four family residential: |
||||||||||||
| Closed end first and seconds |
$ | 248,210 | $ | 12,232 | $ | 260,442 | ||||||
| Home equity lines |
92,533 | 854 | 93,387 | |||||||||
| Total real estate - one to four family residential |
340,743 | 13,086 | 353,829 | |||||||||
| Consumer |
35,588 | 412 | 36,000 | |||||||||
| Other |
3,294 | — | 3,294 | |||||||||
| Total consumer loans |
$ | 379,625 | $ | 13,498 | $ | 393,123 | ||||||
A summary of the changes in the allowance for loan losses for the years indicated is as follows:
F - 20
Table of Contents
| December 31, | ||||||||||||
| (dollars in thousands) |
2010 | 2009 | 2008 | |||||||||
| Balance at beginning of year |
$ | 12,155 | $ | 10,542 | $ | 7,888 | ||||||
| Reserve on acquired loans |
— | — | 488 | |||||||||
| Provision charged against income |
28,930 | 4,200 | 4,025 | |||||||||
| Recoveries of loans charged off |
313 | 407 | 554 | |||||||||
| Loans charged off |
(16,110 | ) | (2,994 | ) | (2,413 | ) | ||||||
| Balance at end of year |
$ | 25,288 | $ | 12,155 | $ | 10,542 | ||||||
The following table presents the balance in the allowance for loan losses and the recorded investment in loans by portfolio class based on impairment method as of December 31, 2010.
| Allowance allocated to loans: | Total Loans: | |||||||||||||||||||||||
| (dollars in thousands) |
Individually evaluated for impairment |
Collectively evaluated for impairment |
Total | Individually evaluated for impairment |
Collectively evaluated for impairment |
Total | ||||||||||||||||||
| Commercial, industrial and agricultural |
$ | 343 | $ | 5,638 | $ | 5,981 | $ | 449 | $ | 72,341 | $ | 72,790 | ||||||||||||
| Real estate - one to four family residential: |
||||||||||||||||||||||||
| Closed end first and seconds |
1,247 | 2,093 | 3,340 | 9,463 | 250,979 | 260,442 | ||||||||||||||||||
| Home equity lines |
— | 587 | 587 | — | 93,387 | 93,387 | ||||||||||||||||||
| Total real estate - one to four family residential |
1,247 | 2,680 | 3,927 | 9,463 | 344,366 | 353,829 | ||||||||||||||||||
| Real estate - multifamily residential |
— | 23 | 23 | — | 11,682 | 11,682 | ||||||||||||||||||
| Real estate - construction: |
||||||||||||||||||||||||
| One to four family residential |
— | 344 | 344 | 534 | 24,920 | 25,454 | ||||||||||||||||||
| Other construction, land development and other land |
2,032 | 5,805 | 7,837 | 18,278 | 32,563 | 50,841 | ||||||||||||||||||
| Total real estate - construction |
2,032 | 6,149 | 8,181 | 18,812 | 57,483 | 76,295 | ||||||||||||||||||
| Real estate - farmland |
— | 17 | 17 | — | 8,304 | 8,304 | ||||||||||||||||||
| Real estate - non-farm, non-residential: |
||||||||||||||||||||||||
| Owner occupied |
1,013 | 1,533 | 2,546 | 8,410 | 125,776 | 134,186 | ||||||||||||||||||
| Non-owner occupied |
2,264 | 808 | 3,072 | 12,323 | 66,073 | 78,396 | ||||||||||||||||||
| Total real estate - non-farm, non-residential |
3,277 | 2,341 | 5,618 | 20,733 | 191,849 | 212,582 | ||||||||||||||||||
| Consumer |
— | 905 | 905 | — | 36,000 | 36,000 | ||||||||||||||||||
| Other |
— | 280 | 280 | — | 3,294 | 3,294 | ||||||||||||||||||
| Unallocated |
— | 356 | 356 | — | — | — | ||||||||||||||||||
| Total |
$ | 6,899 | $ | 18,389 | $ | 25,288 | $ | 49,457 | $ | 725,319 | $ | 774,776 | ||||||||||||
The following is a summary of information pertaining to impaired loans as of the dates and for the years indicated:
| December 31, | ||||||||||||
| (dollars in thousands) |
2010 | 2009 | 2008 | |||||||||
| Impaired loans without a specific reserve |
$ | 21,872 | $ | 9,491 | $ | 9,264 | ||||||
| Impaired loans with a specific reserve |
27,585 | 19,880 | 14,977 | |||||||||
| Allowance related to impaired loans |
$ | 6,899 | $ | 5,768 | $ | 2,881 | ||||||
| Average balance of impaired loans |
$ | 33,558 | $ | 21,794 | $ | 8,564 | ||||||
| Interest income recognized and collected on impaired loans |
$ | 2,033 | $ | 699 | $ | 583 | ||||||
F - 21
Table of Contents
The following table presents loans individually evaluated for impairment by class of loans as of December 31, 2010.
| (dollars in thousands) |
Recorded Investment |
Unpaid Principal Balance |
Recorded Investment With No Allowance |
Recorded Investment With Allowance |
Related Allowance |
Average Recorded Investment |
Interest Income Recognized |
|||||||||||||||||||||
| Commercial, industrial and agricultural |
$ | 449 | $ | 2,639 | $ | 96 | $ | 353 | $ | 343 | $ | 2,868 | $ | 7 | ||||||||||||||
| Real estate - one to four family residential: |
||||||||||||||||||||||||||||
| Closed end first and seconds |
9,463 | 9,837 | 2,763 | 6,700 | 1,247 | 9,241 | 304 | |||||||||||||||||||||
| Real estate - construction: |
||||||||||||||||||||||||||||
| One to four family residential |
534 | 534 | 534 | — | — | 604 | 21 | |||||||||||||||||||||
| Other construction, land development and other land |
18,278 | 20,579 | 14,110 | 4,168 | 2,032 | 11,002 | 696 | |||||||||||||||||||||
| Total real estate - construction |
18,812 | 21,113 | 14,644 | 4,168 | 2,032 | 11,606 | 717 | |||||||||||||||||||||
| Real estate - non-farm, non-residential: |
||||||||||||||||||||||||||||
| Owner occupied |
8,410 | 8,901 | 2,444 | 5,966 | 1,013 | 6,351 | 432 | |||||||||||||||||||||
| Non-owner occupied |
12,323 | 12,553 | 1,925 | 10,398 | 2,264 | 3,492 | 573 | |||||||||||||||||||||
| Total real estate - non-farm, non-residential |
20,733 | 21,454 | 4,369 | 16,364 | 3,277 | 9,843 | 1,005 | |||||||||||||||||||||
| Total loans |
$ | 49,457 | $ | 55,043 | $ | 21,872 | $ | 27,585 | $ | 6,899 | $ | 33,558 | $ | 2,033 | ||||||||||||||
Note 4. Bank Premises and Equipment
Bank premises and equipment are summarized as follows:
| December 31, | ||||||||
| (dollars in thousands) | 2010 | 2009 | ||||||
| Land and improvements |
$ | 5,176 | $ | 5,171 | ||||
| Buildings and leasehold improvements |
19,458 | 18,364 | ||||||
| Furniture, fixtures and equipment |
16,060 | 15,340 | ||||||
| Construction in progress |
2,257 | 1,252 | ||||||
| 42,951 | 40,127 | |||||||
| Less accumulated depreciation |
(22,194 | ) | (20,092 | ) | ||||
| Net balance |
$ | 20,757 | $ | 20,035 | ||||
Depreciation and amortization of bank premises and equipment for the years ended December 31, 2010, 2009 and 2008 amounted to $2.2 million, $2.3 million and $2.2 million, respectively.
Note 5. Other Real Estate Owned (OREO)
At December 31, 2010 and 2009, OREO was $11.6 million and $4.1 million, respectively. OREO is primarily comprised of residential properties, residential lots, raw land and non-residential properties associated with commercial relationships, and is located primarily in the Commonwealth of Virginia. Changes in the balance for OREO are as follows:
F - 22
Table of Contents
| December 31, | ||||||||
| (dollars in thousands) | 2010 | 2009 | ||||||
| Balance at the beginning of year, gross |
$ | 4,136 | $ | 560 | ||||
| Transfers from loans |
10,998 | 5,723 | ||||||
| Capitalized costs |
337 | 735 | ||||||
| Sales proceeds |
(2,904 | ) | (3,239 | ) | ||||
| Gain (loss) on disposition |
(22 | ) | 357 | |||||
| Balance at the end of year, gross |
12,545 | 4,136 | ||||||
| Less valuation allowance |
(928 | ) | — | |||||
| Balance at the end of year, net |
$ | 11,617 | $ | 4,136 | ||||
Changes in the valuation allowance for OREO are as follows:
| December 31, | ||||||||||||
| (dollars in thousands) | 2010 | 2009 | 2008 | |||||||||
| Balance at the beginning of year |
$ | — | $ | 229 | $ | — | ||||||
| Valuation allowance |
928 | — | 229 | |||||||||
| Charge-offs |
— | (229 | ) | — | ||||||||
| Recoveries |
— | — | — | |||||||||
| Balance at the end of year |
$ | 928 | $ | — | $ | 229 | ||||||
Expenses applicable to OREO, other than the valuation allowance, were $373 thousand, $227 thousand and $80 thousand for the years ended December 31, 2010, 2009 and 2008, respectively.
Note 6. Deposits
Interest-bearing deposits consist of the following:
| December 31, | ||||||||
| (dollars in thousands) | 2010 | 2009 | ||||||
| Demand deposits |
$ | 240,330 | $ | 221,571 | ||||
| Money market deposits |
120,322 | 98,573 | ||||||
| Savings deposits |
77,176 | 76,207 | ||||||
| Time deposits: |
||||||||
| Time deposits $100,000 and over |
161,288 | 172,745 | ||||||
| Other time deposits |
171,908 | 194,237 | ||||||
| Total interest-bearing deposits |
$ | 771,024 | $ | 763,333 | ||||
A summary of interest expense by deposit category for the years ended December 31, 2010, 2009 and 2008 is as follows:
F - 23
Table of Contents
| December 31, | ||||||||||||
| (dollars in thousands) | 2010 | 2009 | 2008 | |||||||||
| Demand deposits |
$ | 2,885 | $ | 2,815 | $ | 2,925 | ||||||
| Money market deposits |
1,276 | 1,367 | 1,256 | |||||||||
| Savings deposits |
472 | 540 | 671 | |||||||||
| Time deposits |
7,679 | 13,519 | 15,485 | |||||||||
| Total |
$ | 12,312 | $ | 18,241 | $ | 20,337 | ||||||
At December 31, 2010, the scheduled maturities of time deposits are as follows:
| (dollars in thousands) | ||||
| 2011 |
$ | 188,689 | ||
| 2012 |
69,626 | |||
| 2013 |
34,234 | |||
| 2014 |
20,815 | |||
| 2015 |
19,832 | |||
| $ | 333,196 | |||
Overdrawn demand deposit accounts totaling $374 thousand at December 31, 2010 and $348 thousand at December 31, 2009 were reclassified from deposits to loans.
Note 7. Borrowings
Federal funds purchased and repurchase agreements. The Company has unsecured lines of credit with SunTrust Bank, Community Bankers Bank and Pacific Coast Bankers Bank for the purchase of federal funds in the amount of $20.0 million, $15.0 million and $5.0 million, respectively. These lines of credit have a variable rate based on the lending bank’s daily federal funds sold and are due on demand. Repurchase agreements are secured transactions and generally mature the day following the day sold. Customer repurchases are standard transactions that involve a Bank customer instead of a wholesale bank or broker. The Company offers this product as an accommodation to larger retail and commercial customers that request safety for their funds beyond the FDIC deposit insurance limits. The Company does not use or have any open repurchase agreements with broker-dealers.
The tables below present selected information on federal funds purchased and repurchase agreements:
| Federal funds purchased | December 31, | December 31, | ||||||
| (dollars in thousands) |
2010 | 2009 | ||||||
| Balance outstanding at year end |
$ | 15 | $ | 22,340 | ||||
| Maximum balance at any month end during the year |
$ | 6,850 | $ | 22,340 | ||||
| Average balance for the year |
$ | 2,038 | $ | 933 | ||||
| Weighted average rate for the year |
0.76 | % | 0.90 | % | ||||
| Weighted average rate at year end |
1.02 | % | 0.83 | % | ||||
| Repurchase agreements | December 31, | December 31, | ||||||
| (dollars in thousands) |
2010 | 2009 | ||||||
| Balance outstanding at year end |
$ | 2,449 | $ | 1,814 | ||||
| Maximum balance at any month end during the year |
$ | 4,245 | $ | 2,016 | ||||
| Average balance for the year |
$ | 2,921 | $ | 792 | ||||
| Weighted average rate for the year |
1.33 | % | 1.26 | % | ||||
| Weighted average rate at year end |
1.34 | % | 1.31 | % | ||||
F - 24
Table of Contents
Short-term borrowings. Short-term borrowings consist of advances from the FHLB using a daily rate credit and due on demand. These advances are secured by a blanket floating lien on all qualifying closed-end and revolving open-end loans that are secured by 1-4 family residential properties.
The table below presents selected information on short-term borrowings:
| Short-term borrowings | December 31, | December 31, | ||||||
| (dollars in thousands) |
2010 | 2009 | ||||||
| Balance outstanding at year end |
$ | 25,000 | $ | — | ||||
| Maximum balance at any month end during the year |
$ | 25,000 | $ | — | ||||
| Average balance for the year |
$ | 1,767 | $ | — | ||||
| Weighted average rate for the year |
0.51 | % | 0.00 | % | ||||
| Weighted average rate at year end |
0.47 | % | 0.00 | % | ||||
Long-term borrowings. Long-term borrowings consist of advances from the FHLB, which are secured by a blanket floating lien on all qualifying closed-end and revolving open-end loans that are secured by 1-4 family residential properties. Long-term advances from the FHLB at December 31, 2010 consist of $107.5 million in convertible advances and a $10.0 million fixed rate hybrid advance. Long-term advances from the FHLB at December 31, 2009 consisted of $117.5 million in convertible advances and $5.7 million in amortizing advances. The convertible advances have fixed rates of interest unless the FHLB exercises its option to convert the interest on these advances from fixed rate to variable rate.
The table below shows the year of maturity and potential call dates of long-term FHLB advances. All of the convertible advances have a call provision.
| (dollars in thousands) |
Maturity Amount |
Average Rate |
Callable Amount |
Average Rate |
||||||||||||
| 2011 |
$ | — | — | $ | 94,000 | 4.18 | % | |||||||||
| 2013 |
10,000 | 2.42 | % | — | ||||||||||||
| 2015 |
13,500 | 3.87 | % | — | — | |||||||||||
| 2016 |
10,000 | 4.85 | % | — | — | |||||||||||
| 2017 |
75,000 | 4.30 | % | — | — | |||||||||||
| 2018 |
9,000 | 2.44 | % | — | — | |||||||||||
| $ | 117,500 | 4.00 | % | $ | 94,000 | 4.18 | % | |||||||||
Our line of credit with the FHLB can equal up to 25% of our assets or approximately $278.4 million at December 31, 2010. This line of credit totaled $160.7 million with approximately $16.4 million available at December 31, 2010. As of December 31, 2010 and 2009, loans with a carrying value of $353.8 million and $382.5 million, respectively, are pledged to the FHLB as collateral for borrowings. Additional loans are available that can be pledged as collateral for future borrowings from the FHLB above the current lendable collateral value. Combined short-term and long-term borrowings outstanding under the FHLB line of credit was $142.5 million and $123.2 million as of December 31, 2010 and 2009, respectively.
Note 8. Trust Preferred Debt
On September 17, 2003, $10 million of trust preferred securities were placed through EVB Statutory Trust I in a pooled underwriting totaling approximately $650 million. The trust issuer has invested the total proceeds from the sale of the Trust Preferred in Floating Rate Junior Subordinated Deferrable Interest Debentures (the “Junior Subordinated Debentures”) issued by the Parent. The trust preferred securities pay cumulative cash distributions quarterly at a variable rate per annum, reset quarterly, equal to the 3-month LIBOR plus 2.95%. As of December 31, 2010 and 2009, the interest rate was 3.25% and 3.20%, respectively. The dividends paid to holders of the trust preferred securities, which are recorded as interest expense, are deductible for income tax purposes. The trust preferred securities have a mandatory redemption date of September 17, 2033, and became subject to varying call
F - 25
Table of Contents
provisions beginning September 17, 2008. The Parent has fully and unconditionally guaranteed the trust preferred securities through the combined operation of the debentures and other related documents. The Parent’s obligation under the guarantee is unsecured and subordinate to senior and subordinated indebtedness of the Parent.
The trust preferred securities may be included in Tier 1 capital for regulatory capital adequacy determination purposes up to 25% of Tier 1 capital after its inclusion. The portion of the securities not considered as Tier 1 capital will be included in Tier 2 capital. At December 31, 2010 and 2009, all of the trust preferred securities qualified as Tier 1 capital.
Subject to certain exceptions and limitations, the Company may elect from time to time to defer regularly scheduled interest payments on its outstanding Junior Subordinated Debentures relating to its trust preferred securities. If the Company defers interest payments on the Junior Subordinated Debentures for more than 20 consecutive quarters, the Company would be in default under the governing agreements for such notes and the amount due under such agreements would be immediately due and payable.
On February 17, 2011, the Company entered into a written agreement with the FRB and SCC. Under the terms of this written agreement, the Company may not make payments on its outstanding Junior Subordinated Debentures relating to the trust preferred securities without prior regulatory approval. See Note 27 – Subsequent Events.
Note 9. Employee Benefit Plans
Pension Plan
The Company has historically maintained a defined benefit pension plan covering substantially all of our employees. Benefits are based on years of service and the employee’s compensation during the last five years of employment. Our funding policy has been to contribute annually the maximum amount that can be deducted for federal income tax purposes. Contributions are intended to provide not only for benefits attributable to service to date but also for those expected to be earned in the future.
The plan was amended January 28, 2008 to freeze the plan with no additional contributions for a majority of participants. Employees age 55 or greater or with 10 years of credited service were grandfathered in the plan. No additional participants have been added to the plan. The plan was again amended February 28, 2011 to freeze the plan with no additional contributions for grandfathered participants. Benefits for all participants will remain frozen in the plan until such time as further action occurs.
In 2008, the Company adopted a change in accounting for defined benefit pension and other postretirement plans (FASB ASC Topic 715-20). This guidance requires that defined benefit plan assets and obligations are to be measured as of the date of the employer’s fiscal year-end. As a result of this adoption, the Company was required to change the measurement date for the pension plan assets and benefit obligations from September 30 to December 31 beginning in 2007. To reflect this change, the Company recorded a $105 thousand (after tax) adjustment to the 2008 beginning balance of retained earnings.
Information pertaining to the activity in the plan, using a measurement date of December 31, is as follows:
| (dollars in thousands) | 2010 | 2009 | 2008 | |||||||||
| Change in benefit obligation |
||||||||||||
| Benefit obligation at beginning of year |
$ | 13,111 | $ | 12,828 | $ | 13,994 | ||||||
| Service cost |
585 | 662 | 1,146 | |||||||||
| Interest cost |
779 | 762 | 961 | |||||||||
| Actuarial (gain) |
(46 | ) | (420 | ) | (909 | ) | ||||||
| Benefits paid |
(2,051 | ) | (721 | ) | (217 | ) | ||||||
| Decrease in obligation due to curtailment |
(1,300 | ) | — | (2,147 | ) | |||||||
| Settlement loss |
49 | — | — | |||||||||
| Benefit obligation at end of year |
$ | 11,127 | $ | 13,111 | $ | 12,828 | ||||||
F - 26
Table of Contents
| Change in plan assets |
||||||||||||
| Fair value of plan assets at beginning of year |
$ | 11,996 | $ | 9,076 | $ | 13,062 | ||||||
| Actual return on plan assets |
1,361 | 2,701 | (4,411 | ) | ||||||||
| Employer contributions |
— | 940 | 642 | |||||||||
| Benefits paid |
(2,051 | ) | (721 | ) | (217 | ) | ||||||
| Fair value of plan assets at end of year |
$ | 11,306 | $ | 11,996 | $ | 9,076 | ||||||
| Funded status at the end of year |
$ | 179 | $ | (1,115 | ) | $ | (3,751 | ) | ||||
| Amounts recognized in the consolidated balance sheets at December 31, |
||||||||||||
| Other asset (liability) | $ | 179 | $ | (1,115 | ) | $ | (3,751 | ) | ||||
| Amounts recognized in accumulated other comprehensive (income) loss |
||||||||||||
| Net loss |
$ | 204 | $ | 2,244 | $ | 4,802 | ||||||
| Prior service cost |
— | 95 | 117 | |||||||||
| Deferred income tax benefit |
(62 | ) | (811 | ) | (1,722 | ) | ||||||
| Amount recognized |
$ | 142 | $ | 1,528 | $ | 3,197 | ||||||
| Components of net periodic benefit cost |
||||||||||||
| Service cost |
$ | 585 | $ | 662 | $ | 916 | ||||||
| Interest cost |
779 | 762 | 769 | |||||||||
| Expected return on plan assets |
(950 | ) | (716 | ) | (1,068 | ) | ||||||
| Amortization of prior service cost due to curtailment |
95 | 22 | 22 | |||||||||
| Amortization of net obligation at transition |
— | — | 3 | |||||||||
| Recognized net (gain) loss due to settlement |
276 | — | (1,328 | ) | ||||||||
| Recognized net actuarial loss |
57 | 211 | — | |||||||||
| Net periodic benefit cost |
$ | 842 | $ | 941 | $ | (686 | ) | |||||
| Adjustment to retained earnings due to change in measurement date |
||||||||||||
| Service cost |
$ | — | $ | — | $ | 229 | ||||||
| Interest cost |
— | — | 192 | |||||||||
| Expected return on plan assets |
— | — | (266 | ) | ||||||||
| Amortization of prior service cost |
— | — | 5 | |||||||||
| Deferred income tax |
— | — | (55 | ) | ||||||||
| Net periodic benefit cost |
$ | — | $ | — | $ | 105 | ||||||
| Other changes in plan assets and benefit obligations recognized in other comprehensive (income) loss |
||||||||||||
| Net (gain) loss |
$ | (2,041 | ) | $ | (2,614 | ) | $ | 4,018 | ||||
| Amortization of prior service cost |
(95 | ) | (22 | ) | (27 | ) | ||||||
| Amortization of net obligation at transition |
— | — | (3 | ) | ||||||||
| Total recognized in other comprehensive (income) loss |
$ | (2,136 | ) | $ | (2,636 | ) | $ | 3,988 | ||||
| Total recognized in net periodic benefit cost and other comprehensive income |
$ | (1,294 | ) | $ | (1,695 | ) | $ | 3,302 | ||||
F - 27
Table of Contents
| Weighted average assumptions for benefit obligation at end of year |
||||||||||||
| Discount rate |
5.50 | % | 6.00 | % | 6.00 | % | ||||||
| Rate of compensation increase |
4.00 | % | 4.00 | % | 4.00 | % | ||||||
| Weighted average assumptions for net periodic pension cost at end of year |
||||||||||||
| Discount rate |
6.00 | % | 6.00 | % | 6.25 | % | ||||||
| Expected return on plan assets |
8.00 | % | 8.00 | % | 8.50 | % | ||||||
| Rate of compensation increase |
4.00 | % | 4.00 | % | 4.00 | % | ||||||
| Accumulated Benefit Obligation |
$ | 11,127 | $ | 11,034 | $ | 10,419 | ||||||
Expected Long-Term Rate of Return on Assets
In consultation with its investment advisors and actuary, the Company’s plan sponsor selects the expected long-term rate of return on assets assumption. This rate is intended to reflect the average rate of earnings expected to be earned on the funds invested or to be invested to provide plan benefits. Historical performance is reviewed, especially with respect to real rates of return (net of inflation), for the major asset classes held or anticipated to be held by the trust, and for the trust itself. Undue weight is not given to recent experience that may not continue over the measurement period, with higher significance placed on current forecasts of future long-term economic conditions. The discount rate used to calculate funding requirements and benefit expense was 6.00%, 6.00% and 6.25% in 2010, 2009 and 2008, respectively.
Because assets are held in a qualified trust, anticipated returns are not reduced for taxes. Further, solely for this purpose, the plan is assumed to continue in force and not terminate during the period during which the assets are invested. However, consideration is given to the potential impact of current and future investment policy, cash flow into and out of the trust, and expenses (both investment and non-investment) typically paid from plan assets (to the extent such expenses are not explicitly estimated with periodic cost). The Company made no contributions to the pension plan during 2010, compared to $940 thousand in 2009 and $642 thousand in 2008. The Company has not determined at this time how much, if any, contributions to the plan will be for the year ended December 31, 2011.
Fair value is discussed in detail in Note 19. The fair value of the Company’s pension plan assets at December 31, 2010 and 2009, by asset category are as follows:
| Assets Measured at Fair Value at December 31, 2010 Using |
||||||||||||||||
| Quoted Prices in Active Markets for Identical Assets (Level 1) |
Significant Other Observable Inputs (Level 2) |
Significant Unobservable Inputs (Level 3) |
Balance at December 31, 2010 |
|||||||||||||
| (dollars in thousands) | ||||||||||||||||
| Assets |
||||||||||||||||
| Cash and due from broker |
$ | 13 | $ | — | $ | — | $ | 13 | ||||||||
| Equity mutual funds (2) |
8,897 | — | — | 8,897 | ||||||||||||
| Fixed income mutual funds (3) |
2,396 | — | — | 2,396 | ||||||||||||
| Total assets at fair value |
$ | 11,306 | $ | — | $ | — | $ | 11,306 | ||||||||
F - 28
Table of Contents
| Assets Measured at Fair Value at December 31, 2009 Using |
||||||||||||||||
| Quoted Prices in Active Markets for Identical Assets (Level 1) |
Significant Other Observable Inputs (Level 2) |
Significant Unobservable Inputs (Level 3) |
Balance at December 31, 2009 |
|||||||||||||
| (dollars in thousands) | ||||||||||||||||
| Assets |
||||||||||||||||
| Cash and due from broker |
$ | 11 | $ | — | $ | — | $ | 11 | ||||||||
| Short-term mutual funds (1) |
53 | — | — | 53 | ||||||||||||
| Equity mutual funds (2) |
9,299 | — | — | 9,299 | ||||||||||||
| Fixed income mutual funds (3) |
2,633 | — | — | 2,633 | ||||||||||||
| Total assets at fair value |
$ | 11,996 | $ | — | $ | — | $ | 11,996 | ||||||||
| (1) | This category comprises cash and short-term cash equivalent funds. The funds are valued at cost which approximates fair value. |
| (2) | This category includes investments in mutual funds focused on equity securities with a diversified portfolio and includes investments in large cap and small cap funds, growth funds, international focused funds and value funds. The funds are valued using the net asset value method in which an average of the market prices for the underlying investments is used to value the funds. |
| (3) | This category includes investments in mutual funds focused on fixed income securities with both short-term and long-term investments. The funds are valued using the net asset value method in which an average of the market prices for the underlying investments is used to value the funds. |
The pension plan’s weighted-average asset allocations as of December 31, 2010 and 2009, by asset category are as follows:
| Plan Assets as of December 31, | ||||||||
| 2010 | 2009 | |||||||
| Asset Category |
||||||||
| Mutual Funds - Fixed Income |
21 | % | 22 | % | ||||
| Mutual Funds - Equity |
79 | % | 78 | % | ||||
| Total |
100 | % | 100 | % | ||||
The trust fund is sufficiently diversified to maintain a reasonable level of risk without imprudently sacrificing return, with a targeted asset allocation of 25% fixed income and 75% equities. The Investment Manager selects investment fund managers with demonstrated experience and expertise, and funds with demonstrated historical performance, for the implementation of the Plan’s investment strategy. The Investment Manager will consider both actively and passively managed investment strategies and will allocate funds across the asset classes to develop an efficient investment structure.
It is the responsibility of our Trustee to administer the investments of the Trust within reasonable costs, being careful to avoid sacrificing quality. These costs include, but are not limited to, management and custodial fees, consulting fees, transaction costs and other administrative costs chargeable to the Trust. There is no Company common stock included in the Plan assets.
F - 29
Table of Contents
Estimated future benefit payments, which reflect expected future service, as appropriate, are as follows:
| (dollars in thousands) | ||||
| 2011 |
$ | 242 | ||
| 2012 |
337 | |||
| 2013 |
375 | |||
| 2014 |
482 | |||
| 2015 |
532 | |||
| Years 2016 - 2020 |
3,460 | |||
| Total |
$ | 5,428 | ||
401(k) Plan
The Company maintains a defined contribution 401(k) profit sharing plan (the “401(k) Plan”). The 401(k) Plan allows for a maximum voluntary salary deferral up to the statutory limitations. All employees who have completed three calendar months of employment with the Company are eligible to participate on the first day of the fourth month following hire, after meeting eligibility requirements. The 401(k) Plan provides for a matching contribution, which equals 100% of the first 3% of the employee’s contributions and 50% of the next 3% of the employee’s contributions.
At the option of the Compensation Committee, the Company may make an additional discretionary contribution after the end of each year to employees not previously grandfathered in the Pension Plan in an amount equal to 3% of the employee’s compensation (as described in plan documents). For matching and discretionary employer contributions, an employee is 100% vested after two years of service. The amounts charged to expense under the 401(k) Plan were $448 thousand, $629 thousand and $642 thousand for the years ended December 31, 2010, 2009 and 2008, respectively. The Company does not offer its stock as an investment option under the 401(k) Plan.
Deferred Compensation Plan
The Company has a Supplemental Executive Retirement Plan which is unfunded and maintained primarily for the purpose of providing deferred compensation for a select group of management or highly compensated employees. As of December 31, 2010, the Company has entered into a deferred supplemental compensation agreement with only its Chief Executive Officer. Full vesting of benefits under the supplemental agreement occurs only at age 67, with partial vesting of approximately 5% for each year of service after age 52. Under the supplemental agreement, benefits are to be paid in equal monthly installments over a 15 year period. There is no pre-retirement benefit, but a beneficiary can be named to receive the remaining payments for the 15 year period after benefits have commenced. The deferred compensation expense for 2010, 2009 and 2008, based on the present value of the retirement benefits, was $158 thousand, $0 and $0, respectively.
Note 10. Income Taxes
The current and deferred components of income tax expense (benefit) are as follows:
| December 31, | ||||||||||||
| (dollars in thousands) | 2010 | 2009 | 2008 | |||||||||
| Current |
$ | (2,056 | ) | $ | (4,120 | ) | $ | 2,602 | ||||
| Deferred |
(4,906 | ) | (1,736 | ) | (2,096 | ) | ||||||
| Provision for (benefit from) income taxes |
$ | (6,962 | ) | $ | (5,856 | ) | $ | 506 | ||||
A reconciliation between the provision for (benefit from) income taxes and the amount computed by multiplying income by the current statutory federal income tax rate, for the years ended December 31, 2010, 2009 and 2008, respectively, is as follows:
F - 30
Table of Contents
| December 31, | ||||||||||||
| (dollars in thousands) | 2010 | 2009 | 2008 | |||||||||
| Income tax expense (benefit) at statutory rates |
$ | (6,025 | ) | $ | (4,984 | ) | $ | 1,216 | ||||
| Decrease due to: |
||||||||||||
| Tax exempt income |
(890 | ) | (738 | ) | (705 | ) | ||||||
| Other |
(47 | ) | (134 | ) | (5 | ) | ||||||
| Provision for (benefit from) income taxes |
$ | (6,962 | ) | $ | (5,856 | ) | $ | 506 | ||||
Deferred income taxes result from timing differences between taxable income and the income for financial reporting purposes. The most significant timing difference relates to the provision for loan losses.
Cumulative net deferred tax assets consist of the following components at December 31, 2010 and 2009:
| December 31, | ||||||||
| 2010 | 2009 | |||||||
| Deferred tax assets: |
||||||||
| Allowance for loan losses |
$ | 8,598 | $ | 4,254 | ||||
| Impairment on securities |
1,798 | 2,879 | ||||||
| Interest on nonaccrual loans |
538 | 313 | ||||||
| Accrued benefit cost |
62 | 811 | ||||||
| Net unrealized loss on securities available for sale |
1,113 | — | ||||||
| Depreciation and amortization |
243 | 24 | ||||||
| Home equity line closing cost |
121 | 126 | ||||||
| Defined benefit plan |
286 | — | ||||||
| Accrued compensated absences |
57 | — | ||||||
| Other real estate owned |
1,015 | 130 | ||||||
| Other |
272 | — | ||||||
| Total deferred tax assets |
14,103 | 8,537 | ||||||
| Deferred tax liabilities: |
||||||||
| FHLB dividend |
(8 | ) | (8 | ) | ||||
| Goodwill and other intangible assets |
(1,384 | ) | (1,097 | ) | ||||
| Net unrealized gain on securities available for sale |
— | (401 | ) | |||||
| Other |
(111 | ) | (102 | ) | ||||
| Total deferred tax liabilities |
(1,503 | ) | (1,608 | ) | ||||
| Net deferred tax asset |
$ | 12,600 | $ | 6,929 | ||||
The realization of deferred income tax assets is assessed and a valuation allowance is recorded if it is “more likely than not” that all or a portion of the deferred tax asset will not be realized. “More likely than not” is defined as greater than a 50% chance. Management considers all available evidence, both positive and negative, to determine whether, based on the weight of that evidence, a valuation allowance is needed. Management’s assessment is primarily dependent on historical taxable income and projections of future taxable income, which are directly related to the Company’s core earnings capacity and its prospects to generate core earnings in the future. Projections of core earnings and taxable income are inherently subject to uncertainty and estimates that may change given the uncertain economic outlook, banking industry conditions and other factors. Based upon an analysis of available evidence, management has determined that it is “more likely than not” that the Company’s deferred income tax assets as of December 31, 2010 and 2009 will be fully realized and therefore no valuation allowance to the Company’s deferred income tax assets was recorded. However, the Company can give no assurance that in the future its deferred income tax assets will not be impaired because such determination is based on projections of future earnings and the possible effect of certain transactions, which are subject to uncertainty and based on estimates that may change due to changing
F - 31
Table of Contents
economic conditions and other factors. Due to the uncertainty of estimates and projections, it is possible that the Company will be required to record adjustments to the valuation allowance in future reporting periods.
Due to the net operating loss incurred in the years ended December 31, 2010 and 2009, the Company has recorded income taxes receivable, which have been carried back to prior years, of approximately $4.1 million and $5.3 million, respectively, which are included in other assets on the accompanying consolidated balance sheets.
The Company files income tax returns in the U.S. federal jurisdiction and the Commonwealth of Virginia. With few exceptions, the Company is no longer subject to U.S. federal, state and local income tax examinations by tax authorities for years prior to 2007.
Note 11. Earnings (Loss) Per Share
The following table shows the weighted average number of common shares used in computing earnings (loss) per share and the effect on the weighted average number of shares of potential dilutive common stock. Potential dilutive common stock had no effect on earnings (loss) per share otherwise available to common shareholders for the years ended December 31, 2010, 2009 and 2008.
| Years Ended December 31, | ||||||||||||||||||||||||
| 2010 | 2009 | 2008 | ||||||||||||||||||||||
| Per Share | Per Share | Per Share | ||||||||||||||||||||||
| Shares | Amount | Shares | Amount | Shares | Amount | |||||||||||||||||||
| Basic earnings (loss) per common share |
5,977,641 | $ | (2.05 | ) | 5,941,242 | $ | (1.73 | ) | 5,903,618 | $ | 0.52 | |||||||||||||
| Effect of dilutive securities, stock options |
— | — | — | — | 919 | — | ||||||||||||||||||
| Diluted earnings (loss) per common share |
5,977,641 | $ | (2.05 | ) | 5,941,242 | $ | (1.73 | ) | 5,904,537 | $ | 0.52 | |||||||||||||
Options to acquire 251,317, 276,967 and 304,112 shares of common stock were not included in computing diluted earnings (loss) per share for the twelve months ended December 31, 2010, 2009 and 2008, respectively, because their effects were anti-dilutive.
Note 12. Related Party Transactions
During the year, officers, directors, principal stockholders, and their affiliates (related parties) were customers of and had transactions with the Company in the ordinary course of business. In management’s opinion, these transactions were made on substantially the same terms as those prevailing for other customers for comparable transactions and did not involve more than normal risks of collectability.
Loan activity to related parties is as follows:
| (dollars in thousands) |
2010 | 2009 | ||||||
| Balance at beginning of year |
$ | 10,242 | $ | 11,306 | ||||
| Additional borrowings |
4,552 | 6,283 | ||||||
| Curtailments |
(3,562 | ) | (7,347 | ) | ||||
| Balance at end of year |
$ | 11,232 | $ | 10,242 | ||||
At December 31, 2010 and 2009, there was approximately $2.6 million and $3.2 million, respectively, in available credit that the related parties could draw upon.
Deposits from related parties held by the Company at December 31, 2010 and 2009 amounted to $4.9 million and $4.1 million, respectively.
Note 13. Stock Based Compensation Plans
On September 21, 2000, we adopted the Eastern Virginia Bankshares, Inc. 2000 Stock Option Plan (the “2000 Plan”) to provide a means for selected key employees and directors to increase their personal financial interest in our Company, thereby stimulating their efforts and strengthening their desire to remain with us. Under the 2000 Plan, up
F - 32
Table of Contents
to 400,000 shares of Company common stock could be granted in the form of stock options. On April 17, 2003, the shareholders approved the Eastern Virginia Bankshares, Inc. 2003 Stock Incentive Plan, amending and restating the 2000 Plan (the “2003 Plan”) still authorizing the issuance of up to 400,000 shares of common stock under the plan, but expanding the award types available under the plan to include stock options, stock appreciation rights, common stock, restricted stock and phantom stock. There are 69,218 shares still available to be granted as awards under the 2003 Plan.
On April 19, 2007, our shareholders approved the Eastern Virginia Bankshares, Inc. 2007 Equity Compensation Plan (the “2007 Plan”) to enhance our ability to recruit and retain officers, directors, employees, consultants and advisors with ability and initiative and to encourage such persons to have a greater financial interest in the Company. The 2007 Plan authorizes the Company to issue up to 400,000 additional shares of common stock pursuant to grants of stock options, stock appreciation rights, common stock, restricted stock, performance shares, incentive awards and stock units. No awards have been issued under the 2007 Plan.
Accounting standards require companies to recognize the cost of employee services received in exchange for awards of equity instruments, such as stock options, based on the fair value of those awards at the date of grant.
Accounting standards also require that new awards to employees eligible for retirement prior to the awards becoming fully vested be recognized as compensation cost over the period through the date that the employee first becomes eligible to retire and is no longer required to provide service to earn the award. Our stock options granted to eligible participants are being recognized, as required, as compensation cost over the vesting period except in the instance where a participant reaches normal retirement age of 65 prior to the normal vesting date. For the years ended December 31, 2010, 2009 and 2008, stock option compensation expense was $163 thousand, $216 thousand and $248 thousand, respectively, and was included in salaries and employee benefits expense in the consolidated statements of operations.
Stock option compensation expense is the estimated fair value of options granted, amortized on a straight-line basis over the requisite service period for each stock option award. There were no stock options granted in 2010 and 2009. During 2008, there were 49,000 stock options granted which had a weighted average estimated fair value of $3.62.
The fair value of each option grant is estimated on the date of the grant using the Black-Scholes option-pricing model with the following assumptions for 2008:
| 2008 | ||||
| Dividend rate |
2.82 | % | ||
| Price volatility |
33.25 | % | ||
| Risk-free interest rate |
3.56 | % | ||
| Expected life |
7 years | |||
The dividend rate is calculated as the average quarterly dividend yield on our stock for the past seven years by dividing the quarterly dividend by the average daily closing price of the stock for the period. Volatility is a measure of the standard deviation of the daily closing stock price plus dividend yield for the same period. The risk-free interest rate is the 7 year Treasury strip rate on the date of the grant. The expected life of options granted in 2008 was calculated using the simplified method whereby the vesting period and contractual period are averaged.
Option valuation models require the input of highly subjective assumptions. Because the Company’s employee stock options have characteristics significantly different from those of traded options, and because changes in the subjective input assumptions can materially affect the fair value estimate, in management’s opinion, the existing models do not necessarily provide a representative single measure of the fair value at which transactions may occur.
A summary of the Company’s stock option activity and related information is as follows:
F - 33
Table of Contents
| Options Outstanding |
Weighted Average Exercise Price |
Remaining Contractual Life (in years) |
Aggregate Intrinsic Value (in thousands) |
|||||||||||||
| Stock options outstanding at January 1, 2008 |
259,762 | $ | 21.19 | |||||||||||||
| Granted |
49,000 | 12.36 | ||||||||||||||
| Forfeited |
(4,450 | ) | 22.02 | |||||||||||||
| Stock options outstanding at December 31, 2008 |
304,312 | 20.87 | ||||||||||||||
| Forfeited |
(27,345 | ) | 19.79 | |||||||||||||
| Stock options outstanding at December 31, 2009 |
276,967 | 19.45 | ||||||||||||||
| Forfeited |
(25,830 | ) | 17.52 | |||||||||||||
| Stock options outstanding at December 31, 2010 |
251,137 | $ | 19.68 | 4.61 | $ | — | ||||||||||
| Stock options exercisable at December 31, 2010 |
176,887 | $ | 21.26 | 3.55 | $ | — | ||||||||||
| * | Intrinsic value is the amount by which the fair value of the underlying common stock exceeds the exercise price of a stock option on exercise date. |
As of December 31, 2010, there was $118 thousand of unrecognized compensation expense related to stock options that will be recognized over the remaining requisite average service period of approximately 15 months. There were no stock options exercised in 2010, 2009 and 2008.
The table below summarizes information concerning stock options outstanding and exercisable at December 31, 2010.
| Stock Options Outstanding | Stock Options Exercisable | |||||||||||||||||
| Exercise |
Number Outstanding |
Weighted Average Remaining Term |
Exercise Price |
Number Exercisable |
||||||||||||||
| $ | 16.10 | 18,375 | 1.25 years | $ | 16.10 | 18,375 | ||||||||||||
| $ | 28.60 | 24,525 | 2.75 years | $ | 28.60 | 24,525 | ||||||||||||
| $ | 19.92 | 35,050 | 3.50 years | $ | 19.92 | 35,050 | ||||||||||||
| $ | 20.57 | 47,312 | 4.50 years | $ | 20.57 | 47,312 | ||||||||||||
| $ | 21.16 | 51,625 | 5.75 years | $ | 21.16 | 51,625 | ||||||||||||
| $ | 19.25 | 38,500 | 6.75 years | $ | — | — | ||||||||||||
| $ | 12.36 | 35,750 | 7.75 years | $ | — | — | ||||||||||||
| $ | 19.68 | 251,137 | 4.61 years | $ | 21.26 | 176,887 | ||||||||||||
On December 16, 2010, the Company cancelled 8,000 shares of restricted stock previously awarded to its Chief Executive Officer on July 1, 2009 as the award did not contain the terms necessary to comply with the TARP executive compensation limits and therefore prevented the employee from accruing or vesting in any portion of the award to date. In conjunction with this cancellation, the Company granted a TARP compliant restricted stock award to its Chief Executive Officer in an equal amount of shares and in substantially the same form as previously awarded. On July 1, 2009, the Company awarded 18,000 shares of restricted stock to employees. One half of these shares are subject to time vesting at 20% per year over a five year period. The other half of these restricted stock awards is performance based and will vest on June 30, 2012 if, and only if, the year ended December 31, 2011 financial achievements of the Company meet pre-specified targets for earnings per share or return on equity compared to a board compensation committee defined peer group. Performance based vesting is based on a sliding scale at various levels for performance at or above the 50th percentile of the peer group performance. The Company issued no restricted stock in 2008.
For the years ended December 31, 2010, 2009 and 2008, restricted stock compensation expense was $45 thousand, $32 thousand and $29 thousand, respectively, and was included in salaries and employee benefits expense in the
F - 34
Table of Contents
consolidated statements of operations. Restricted stock compensation expense is accounted for using the fair market value of our common stock on the date the restricted shares were awarded, which was $3.75 per share for the 2010 award and $8.31 per share for the 2009 awards.
A summary of the status of the our nonvested shares in relation to our restricted stock awards as of December 31, 2010, 2009 and 2008, and changes during the years ended December 31, 2010, 2009 and 2008, is presented below; the weighted average price is the weighted average fair value at the date of grant:
| Shares | Weighted-Average Price |
|||||||
| Nonvested as of January 1, 2008 |
15,000 | $ | 17.25 | |||||
| Vested |
(1,500 | ) | 17.25 | |||||
| Nonvested as of December 31, 2008 |
13,500 | 17.25 | ||||||
| Granted |
18,000 | 8.31 | ||||||
| Vested |
(1,300 | ) | 17.25 | |||||
| Forfeited |
(1,800 | ) | 17.25 | |||||
| Nonvested as of December 31, 2009 |
28,400 | 13.47 | ||||||
| Granted |
8,000 | 3.75 | ||||||
| Vested |
(2,100 | ) | 12.99 | |||||
| Forfeited |
(17,800 | ) | 11.88 | |||||
| Nonvested as of December 31, 2010 |
16,500 | $ | 7.29 | |||||
At December 31, 2010, there was $31 thousand of total unrecognized compensation expense related to restricted stock awards. This unearned compensation is being amortized over the remaining vesting period for the time based shares, and over the remaining vesting period for 1/3rd of the 2009 performance based shares. The Company assumes that only 1/3rd of the 2009 performance based awards will vest. The total fair value of restricted stock awards vested during 2010, 2009 and 2008 was $11 thousand, $9 thousand and $14 thousand, respectively.
Note 14. Branch Acquisitions
On March 14, 2008, we purchased two branches from Millennium Bank, N. A. The purchase price of $8.5 million represented a 9.25% premium on the deposits assumed at the date of consummation.
The acquisition included the assumption of certain deposit accounts and purchase of selected loans and fixed assets as follows:
| Assets purchased (at fair value): |
||||
| Cash |
$ | 275 | ||
| Loans |
48,896 | |||
| Furniture, fixtures and equipment |
102 | |||
| Other assets |
173 | |||
| Goodwill |
10,245 | |||
| Core deposit intangibles |
20 | |||
| Total assets acquired |
$ | 59,711 | ||
| Liabilities acquired (at fair value): |
||||
| Deposit accounts |
$ | 93,499 | ||
| Other liabilities |
207 | |||
| Total liabilities assumed |
$ | 93,706 | ||
| Net liabilities assumed |
$ | (33,995 | ) | |
F - 35
Table of Contents
Of the acquired intangible assets, $20 thousand was assigned to core deposit intangibles to be amortized over a period of 28.5 months. The unamortized balance of accumulated core deposit intangibles, including previous branch acquisitions, was $0 and $215 thousand at December 31, 2010 and 2009, respectively.
In addition, $1.6 million was assigned as a discount on the certificates of deposit assumed, while $438 thousand was assigned as a premium on the loans purchased. Weighted average lives for the certificates of deposit and loans receivable were 1.05 years and 7.0 years, respectively. The CD discount was fully amortized as of December 31, 2009. The unamortized balance of the loan premium was $266 thousand and $329 thousand at December 31, 2010 and 2009, respectively. The estimated aggregate loan premium amortization on a monthly basis for the remaining 51 month amortization period is $5 thousand.
Note 15. Commitments and Contingent Liabilities
In the normal course of business there are various outstanding commitments and contingent liabilities, which are not reflected in the accompanying financial statements. The Company does not anticipate any material losses as a result of these transactions. See Note 20 – Financial Instruments with Off-Balance Sheet Risk.
Note 16. Dividend Limitations
Dividends may be paid to the Parent by the Bank under formulas established by the appropriate regulatory authorities. Generally, the amount of dividends the Bank may pay to the Parent at any time, without prior approval, is limited to current year to date earnings as of the dividend date plus earnings retained for the two preceding years.
On February 17, 2011, the Company entered into a written agreement with the FRB and SCC. Under the terms of this written agreement, the Parent and the Bank are subject to additional limitations and regulatory restrictions and may not declare or pay dividends to its shareholders (including payments by the Parent related to trust preferred securities) without prior regulatory approval. See Note 27 – Subsequent Events.
Note 17. Regulatory Matters
The Company and the Bank are subject to various regulatory capital requirements administered by the federal banking agencies. Failure to meet minimum capital requirements can initiate certain mandatory and possibly additional discretionary actions by regulators that, if undertaken, could have a direct material effect on the Company’s and the Bank’s financial statements. Under capital adequacy guidelines and the regulatory framework for prompt corrective action, the Company and the Bank must meet specific capital guidelines that involve quantitative measures of their assets, liabilities, and certain off-balance sheet items as calculated under regulatory accounting practices. The capital amounts and classification are also subject to qualitative judgments by the regulators about components, risk weightings and other factors. Prompt corrective action provisions are not applicable to bank holding companies.
Quantitative measures established by regulation to ensure capital adequacy require the Company and the Bank to maintain minimum amounts and ratios (set forth in the following table) of total and Tier 1 Capital (as defined in the regulations) to risk-weighted assets (as defined) and of Tier 1 capital (as defined) to average assets (as defined). For the Company, Tier 1 Capital consists of shareholders’ equity and qualifying trust preferred securities, excluding any net unrealized gain (loss) on securities available for sale, disallowed deferred tax assets, goodwill and intangible assets. For the Bank, Tier 1 Capital consists of shareholders’ equity excluding any net unrealized gain (loss) on securities available for sale, disallowed deferred tax assets, goodwill and intangible assets. For the Company, total capital consists of Tier 1 Capital and the allowable portion of the allowance for loan losses, excluding any investments in unconsolidated subsidiaries. For the Bank, total capital consists of Tier 1 Capital, qualifying subordinated debt and the allowable portion of the allowance for loan losses, excluding any investments in unconsolidated subsidiaries. Risk-weighted assets for the Company and the Bank were $759.2 million and $758.5 million, respectively at December 31, 2010 and $847.5 million and $847.4 million, respectively at December 31, 2009. Management believes, as of December 31, 2010 and 2009, that the Company and the Bank met all capital adequacy requirements to which they are subject.
On February 17, 2011, the Company entered into a written agreement with the FRB and SCC. Under the terms of this written agreement, the Parent and the Bank are subject to additional limitations and regulatory restrictions and may not declare or pay dividends to its shareholders (including payments by the Parent on its trust preferred securities) and may not purchase or redeem shares of its stock without prior regulatory approval. See Note 27 – Subsequent Events.
F - 36
Table of Contents
As of December 31, 2010, the most recent notification from the FRB categorized the Bank as well capitalized under the regulatory framework for prompt corrective action. To be categorized as well capitalized, an institution must maintain minimum total risk-based, Tier 1 risk-based, and Tier 1 leverage ratios as set forth in the following tables. There are no conditions or events since the notification that management believes have changed the Bank’s category. The Company’s and the Bank’s actual capital amounts and ratios as of December 31, 2010 and 2009 are also presented in the table.
| Actual | Minimum Capital Requirement |
Minimum To Be Well Capitalized Under Prompt Corrective Action Provisions |
||||||||||||||||||||||
| Amount | Ratio | Amount | Ratio | Amount | Ratio | |||||||||||||||||||
| (dollars in thousands) | ||||||||||||||||||||||||
| As of December 31, 2010: |
||||||||||||||||||||||||
| Total capital to risk weighted assets: |
||||||||||||||||||||||||
| Company |
$ | 88,814 | 11.70 | % | $ | 60,737 | 8.00 | % | N/A | N/A | ||||||||||||||
| Bank |
83,355 | 10.99 | % | 60,677 | 8.00 | % | $ | 75,847 | 10.00 | % | ||||||||||||||
| Tier 1 capital to risk weighted assets: |
||||||||||||||||||||||||
| Company |
$ | 79,827 | 10.51 | % | $ | 30,368 | 4.00 | % | N/A | N/A | ||||||||||||||
| Bank |
63,377 | 8.36 | % | 30,339 | 4.00 | % | $ | 45,508 | 6.00 | % | ||||||||||||||
| Tier 1 capital to average assets: |
||||||||||||||||||||||||
| Company |
$ | 79,827 | 7.38 | % | $ | 43,241 | 4.00 | % | N/A | N/A | ||||||||||||||
| Bank |
63,377 | 5.86 | % | 43,259 | 4.00 | % | $ | 54,073 | 5.00 | % | ||||||||||||||
| (dollars in thousands) | ||||||||||||||||||||||||
| As of December 31, 2009: |
||||||||||||||||||||||||
| Total capital to risk weighted assets: |
||||||||||||||||||||||||
| Company |
$ | 104,154 | 12.29 | % | $ | 67,797 | 8.00 | % | N/A | N/A | ||||||||||||||
| Bank |
98,231 | 11.59 | % | 67,791 | 8.00 | % | $ | 84,739 | 10.00 | % | ||||||||||||||
| Tier 1 capital to risk weighted assets: |
||||||||||||||||||||||||
| Company |
$ | 98,269 | 11.60 | % | $ | 33,898 | 4.00 | % | N/A | N/A | ||||||||||||||
| Bank |
81,855 | 9.66 | % | 33,896 | 4.00 | % | $ | 50,844 | 6.00 | % | ||||||||||||||
| Tier 1 capital to average assets: |
||||||||||||||||||||||||
| Company |
$ | 98,269 | 9.08 | % | $ | 43,312 | 4.00 | % | N/A | N/A | ||||||||||||||
| Bank |
81,855 | 7.57 | % | 43,242 | 4.00 | % | $ | 54,052 | 5.00 | % | ||||||||||||||
Note 18. Dividend Reinvestment and Stock Purchase Plan
The Company has a Dividend Reinvestment and Stock Purchase Plan (the “DRIP”), which provides for the automatic conversion of dividends into common stock for enrolled shareholders. This conversion is based on the average closing price of the Company’s common stock for the three trading days prior to each dividend record date. The DRIP also permits participants to make optional cash payments of up to $5 thousand per shareholder per calendar quarter for the purchase of additional shares of the Company’s common stock. The shares are issued at market value without incurring brokerage commissions.
Note 19. Fair Value Measurements
Fair value is defined as the exchange price that would be received for an asset or paid to transfer a liability (an exit price) in the principal or most advantageous market for the asset or liability in an orderly transaction between market participants on the measurement date. U.S. GAAP requires that valuation techniques maximize the use of observable
F - 37
Table of Contents
inputs and minimize the use of unobservable inputs. U.S. GAAP also establishes a fair value hierarchy which prioritizes the valuation inputs into three broad levels. Based on the underlying inputs, each fair value measurement in its entirety is reported in one of the three levels. These levels are:
| • | Level 1 – Valuation is based upon quoted prices (unadjusted) for identical instruments traded in active markets. |
| • | Level 2 – Valuation is based upon quoted prices for similar instruments in active markets, quoted prices for identical or similar instruments in markets that are not active, and model based valuation techniques for which all significant assumptions are observable in the market or can be corroborated by observable market data for substantially the full term of the assets or liabilities. |
| • | Level 3 – Valuation is determined using model-based techniques with significant assumptions not observable in the market. |
U.S. GAAP allows an entity the irrevocable option to elect fair value (the fair value option) for the initial and subsequent measurement for certain financial assets and liabilities on a contract-by-contract basis. The Company has not made any fair value option elections as of December 31, 2010.
Following is a description of the valuation methodologies used for instruments measured at fair value, as well as the general classification of such instruments pursuant to the valuation hierarchy.
Assets Measured at Fair Value on a Recurring Basis
Securities Available For Sale. Securities available for sale are recorded at fair value on a recurring basis. Fair value measurement is based upon quoted market prices, when available (Level 1). If quoted market prices are not available, fair values are measured utilizing independent valuation techniques of identical or similar securities for which significant assumptions are derived primarily from or corroborated by observable market data. Third party vendors compile prices from various sources and may determine the fair value of identical or similar securities by using pricing models that considers observable market data (Level 2). The Company obtains a single quote for all securities. Quotes for most securities are provided by our securities accounting and safekeeping correspondent bank which uses Reuters for securities other than municipals for which they use a pricing matrix. The correspondent also uses securities trader quotations for a small number of securities. Securities pricing for a single pooled trust preferred senior security is provided through another correspondent by Moody’s Analytics. The Company does not adjust any quotes or prices provided by these third party sources. The Company performs a review of pricing data by comparing prices received from third party vendors to the previous month’s quote for the same security and evaluate any substantial changes.
The following table summarizes financial assets measured at fair value on a recurring basis as of December 31, 2010 and 2009, segregated by the level of the valuation inputs within the fair value hierarchy utilized to measure fair value:
F - 38
Table of Contents
| Assets Measured at Fair Value on a Recurring Basis at December 31, 2010 Using |
||||||||||||||||
| Quoted Prices in Active Markets for Identical Assets (Level 1) |
Significant Other Observable Inputs (Level 2) |
Significant Unobservable Inputs (Level 3) |
Balance at December 31, 2010 |
|||||||||||||
| (dollars in thousands) | ||||||||||||||||
| Assets |
||||||||||||||||
| Securities available for sale |
||||||||||||||||
| Obligations of U.S. Government agencies |
$ | — | $ | 23,829 | $ | — | $ | 23,829 | ||||||||
| SBA Pool securities |
— | 61,890 | — | 61,890 | ||||||||||||
| Agency mortgage-backed securities |
— | 46,284 | — | 46,284 | ||||||||||||
| Agency CMO securities |
— | 41,477 | — | 41,477 | ||||||||||||
| Non agency CMO securities |
— | 12,042 | — | 12,042 | ||||||||||||
| State and political subdivisions |
— | 57,346 | — | 57,346 | ||||||||||||
| Pooled trust preferred securities |
— | 571 | — | 571 | ||||||||||||
| FNMA and FHLMC preferred stock |
— | 89 | — | 89 | ||||||||||||
| Corporate securities |
— | 2,592 | — | 2,592 | ||||||||||||
| Total securities available for sale |
$ | — | $ | 246,120 | $ | — | $ | 246,120 | ||||||||
| Assets Measured at Fair Value on a Recurring Basis at December 31, 2009 Using |
||||||||||||||||
| Quoted Prices in Active Markets for Identical Assets (Level 1) |
Significant Other Observable Inputs (Level 2) |
Significant Unobservable Inputs (Level 3) |
Balance at December 31, 2009 |
|||||||||||||
| (dollars in thousands) | ||||||||||||||||
| Assets |
||||||||||||||||
| Securities available for sale |
||||||||||||||||
| Obligations of U.S. Government agencies |
$ | — | $ | 34,522 | $ | — | $ | 34,522 | ||||||||
| Agency mortgage-backed securities |
— | 41,481 | — | 41,481 | ||||||||||||
| Agency CMO securities |
— | 29,992 | — | 29,992 | ||||||||||||
| Non agency CMO securities |
— | 5,145 | — | 5,145 | ||||||||||||
| State and political subdivisions |
— | 48,072 | — | 48,072 | ||||||||||||
| Pooled trust preferred securities |
— | 688 | — | 688 | ||||||||||||
| FNMA and FHLMC preferred stock |
— | 126 | — | 126 | ||||||||||||
| Corporate securities |
— | 9,416 | — | 9,416 | ||||||||||||
| Total securities available for sale |
$ | — | $ | 169,442 | $ | — | $ | 169,442 | ||||||||
Assets Measured at Fair Value on a Non-Recurring Basis
Certain assets are measured at fair value on a non-recurring basis; that is, the instruments are not measured at fair value on an ongoing basis but are subject to fair value adjustments in certain circumstances (for example, when there is evidence of impairment of a financial asset).
Impaired Loans. Loans are designated as impaired when, in the judgment of management based on current information and events, it is probable that some portion of the amounts due according to the contractual terms of the loan agreement will not be collected. The measurement of loss associated with impaired loans can be based on either
F - 39
Table of Contents
the observable market price of the loan or the fair value of the collateral. Fair value is measured based on the value of the collateral securing the loans. Collateral may be in the form of real estate or business assets including equipment, inventory and accounts receivable. The vast majority of the collateral is real estate. The value of real estate collateral is determined utilizing an income or market valuation approach based on an appraisal conducted by an independent, licensed external appraiser using observable market data (Level 2). However, if the collateral is a house or building in the process of construction or if an appraisal of the real estate property is over two years old, then the fair value is considered Level 3. If a real estate loan becomes a nonperforming loan, and the valuation is over one year old, either an evaluation by an officer of the bank or an outside vendor or an appraisal is performed to determine current market value. The Company considers the value of a partially completed project for our loan analysis. For nonperforming construction loans, the Company obtains a valuation of each partially completed project “as is” from a third party appraiser. The Company uses this third party valuation to determine if any charge-offs are necessary.
The value of business equipment is based upon an outside appraisal if deemed significant, or the net book value on the applicable business’s financial statements if not considered significant using observable market data. Likewise, values for inventory and accounts receivable collateral are based on financial statement balances or aging reports (Level 3). Impaired loans allocated to the allowance for loan losses are measured at fair value on a non-recurring basis. Any fair value adjustments are recorded in the period incurred as provision for loan losses on the consolidated statements of operations.
Other Real Estate Owned. Certain assets such as other real estate owned (“OREO”) are measured at fair value less cost to sell. The fair value of other real estate owned is determined utilizing an income or market valuation approach based on an appraisal conducted by an independent, licensed external appraiser using observable market data (Level 2). However, if the other real estate is a house or building in the process of construction or if an appraisal of the real estate property is over two years old, then the fair value is considered Level 3. The Company believes that the fair value component in our valuation of OREO follows the provisions of accounting standards.
The following table summarizes assets measured at fair value on a non-recurring basis as of December 31, 2010 and 2009, segregated by the level of the valuation inputs within the fair value hierarchy utilized to measure fair value:
| Assets Measured at Fair Value on a Non-Recurring Basis at December 31, 2010 Using |
||||||||||||||||
| Quoted Prices in Active Markets for Identical Assets (Level 1) |
Significant Other Observable Inputs (Level 2) |
Significant Unobservable Inputs (Level 3) |
Balance at December 31, 2010 |
|||||||||||||
| (dollars in thousands) | ||||||||||||||||
| Assets |
||||||||||||||||
| Impaired loans |
$ | — | $ | 18,550 | $ | 2,136 | $ | 20,686 | ||||||||
| Other real estate owned |
$ | — | $ | 7,360 | $ | 4,257 | $ | 11,617 | ||||||||
| Assets Measured at Fair Value on a Non-Recurring Basis at December 31, 2009 Using |
||||||||||||||||
| Quoted Prices in Active Markets for Identical Assets (Level 1) |
Significant Other Observable Inputs (Level 2) |
Significant Unobservable Inputs (Level 3) |
Balance at December 31, 2009 |
|||||||||||||
| (dollars in thousands) | ||||||||||||||||
| Assets |
||||||||||||||||
| Impaired loans |
$ | — | $ | 8,686 | $ | 5,426 | $ | 14,112 | ||||||||
| Other real estate owned |
$ | — | $ | — | $ | 4,136 | $ | 4,136 | ||||||||
F - 40
Table of Contents
Fair Value of Financial Instruments
U.S. GAAP requires disclosure of the fair value of financial assets and financial liabilities, including those financial assets and financial liabilities that are not measured and reported at fair value on a recurring basis or non-recurring basis. The methodologies and assumptions for estimating the fair value of financial assets and financial liabilities that are measured at fair value on a recurring or non-recurring basis are discussed above. The methodologies and assumptions for other financial assets and financial liabilities are discussed below:
Cash and Short-Term Investments. For those short-term instruments, the carrying amount is a reasonable estimate of fair value.
Investment Securities. For securities and marketable equity securities held for investment purposes, fair values are based on quoted market prices or dealer quotes. For other securities held as investments, fair value equals quoted market price, if available. If a quoted market price is not available, fair value is estimated using quoted prices for similar securities. All securities prices are provided by independent third party vendors.
Restricted Securities. The carrying amount approximates fair value.
Loans. For variable rate loans that reprice frequently and with no significant change in credit risk, fair values are based on carrying values. The fair values for other loans were estimated using discounted cash flow analyses, using interest rates currently being offered.
Deposits. The fair value of demand deposits, savings accounts, and certain money market deposits is the amount payable on demand at the reporting date. The fair value of fixed maturity certificates of deposit is estimated using market rates for deposits of similar remaining maturities.
Short-Term Borrowings. The carrying amounts of federal funds purchased and other short-term borrowings maturing within 90 days approximate their fair values. Fair values of other short-term borrowings are estimated using discounted cash flow analyses based on the current incremental borrowing rates for similar types of borrowing arrangements.
Long-Term Borrowings. The fair values of our long-term borrowings are estimated using discounted cash flow analyses based on our current incremental borrowing rates for similar types of borrowing arrangements.
Accrued Interest Receivable and Accrued Interest Payable. The carrying amounts of accrued interest approximate fair value.
Off-Balance Sheet Financial Instruments. The fair value of commitments to extend credit is estimated using the fees currently charged to enter similar agreements, taking into account the remaining terms of the agreements and the present credit worthiness of the counterparties. For fixed-rate loan commitments, fair value also considers the difference between current levels of interest rates and the committed rates.
The fair value of standby letters of credit is based on fees currently charged for similar agreements or on the estimated cost to terminate them or otherwise settle the obligations with the counterparties at the reporting date. At December 31, 2010 and 2009, the fair value of loan commitments and standby letters of credit are not significant to fair value and are not included in the table below.
The estimated fair value and the carrying value of the Company’s recorded financial instruments are as follows:
F - 41
Table of Contents
| December 31, 2010 | December 31, 2009 | |||||||||||||||
| (dollars in thousands) | Carrying Amount |
Estimated Fair Value |
Carrying Amount |
Estimated Fair Value |
||||||||||||
| Financial Assets: |
||||||||||||||||
| Cash and short-term investments |
$ | 12,533 | $ | 12,533 | $ | 13,117 | $ | 13,117 | ||||||||
| Interest bearing deposits with banks |
10,298 | 10,298 | 15,571 | 15,571 | ||||||||||||
| Securities available for sale |
246,120 | 246,120 | 169,442 | 169,442 | ||||||||||||
| Restricted securities |
10,344 | 10,344 | 8,941 | 8,941 | ||||||||||||
| Loans, net |
749,486 | 769,510 | 840,908 | 854,424 | ||||||||||||
| Accrued interest receivable |
4,281 | 4,281 | 3,886 | 3,886 | ||||||||||||
| Financial Liabilities: |
||||||||||||||||
| Noninterest-bearing demand deposits |
$ | 97,122 | $ | 97,122 | $ | 93,307 | $ | 93,307 | ||||||||
| Interest-bearing deposits |
771,024 | 762,844 | 763,333 | 755,391 | ||||||||||||
| Short-term borrowings |
27,464 | 27,464 | 24,154 | 24,154 | ||||||||||||
| Long-term borrowings |
117,500 | 132,498 | 123,214 | 134,143 | ||||||||||||
| Trust preferred debt |
10,310 | 10,310 | 10,310 | 10,310 | ||||||||||||
| Accrued interest payable |
1,451 | 1,451 | 1,739 | 1,739 | ||||||||||||
The Company assumes interest rate risk (the risk that general interest rate levels will change) as a result of our normal operations. As a result, the fair values of our financial instruments will change when interest rate levels change and that change may be either favorable or unfavorable to us. The Company attempts to match maturities of assets and liabilities to the extent believed necessary to minimize interest rate risk. However, borrowers with fixed rate obligations are less likely to prepay in a rising rate environment. Conversely, depositors who are receiving fixed rates are more likely to withdraw funds before maturity in a rising rate environment and less likely to do so in a falling rate environment. The Company monitors rates and maturities of assets and liabilities and attempt to minimize interest rate risk by adjusting terms of new loans and deposits and by investing in securities with terms that mitigate our overall interest rate risk.
Note 20. Financial Instruments with Off-Balance Sheet Risk
In the normal course of business, the Company is a party to financial instruments with off-balance sheet risk. These financial instruments include commitments to extend credit and standby letters of credit and involve, to varying degrees, elements of credit and interest rate risk in excess of the amount recognized in the balance sheet. The contract or notional amounts of these instruments reflect the extent of the Company’s involvement in particular classes of financial instruments.
The Company’s exposure to credit loss in the event of nonperformance by the other party to the financial instrument for commitments to extend credit and standby letters of credit is represented by the contractual notional amount of those instruments. The Company uses the same credit policies in making commitments and conditional obligations as it does for on-balance sheet instruments.
Unless otherwise noted, the Company does not require collateral or other security to support financial instruments with credit risk.
Commitments to extend credit are agreements to lend to a customer as long as there is no violation of any condition established in the contract. Commitments generally have fixed expiration dates or other termination clauses and may require payment of a fee. Since many of the commitments are expected to expire without being drawn upon, the total commitment amounts do not necessarily represent future cash requirements. The Company evaluates each customer’s credit worthiness on a case-by-case basis. The amount of collateral obtained, if deemed necessary by the Company upon extension of credit, is based on management’s credit evaluation of the counterparty. Collateral held varies but may include property, plant and equipment and income-producing commercial properties.
F - 42
Table of Contents
Unfunded commitments under commercial lines of credit, revolving credit lines and overdraft protection agreements are commitments for possible future extensions of credit to existing customers. These lines of credit are usually uncollateralized and do not always contain a specified maturity date and may not be drawn upon to the total extent to which we are committed.
Standby letters of credit are conditional commitments issued by the Company to guarantee the performance of a customer to a third party. The credit risk involved in issuing letters of credit is essentially the same as that involved in extending loan facilities to customers. The Company has not incurred any losses on it commitments in either 2010 or 2009.
The amounts of loan commitments and standby letters of credit are set out in the following table as of December 31, 2010 and 2009.
| December 31, | ||||||||
| (dollars in thousands) | 2010 | 2009 | ||||||
| Loan commitments |
$ | 121,167 | $ | 118,070 | ||||
| Standby letters of credit |
$ | 6,543 | $ | 5,102 | ||||
Note 21. Preferred Stock and Warrant
On January 9, 2009, the Company signed a definitive agreement with the U.S. Department of the Treasury (the “Treasury”) under the Emergency Economic Stabilization Act of 2008 to participate in the Treasury’s Capital Purchase Program. Pursuant to this agreement, the Company sold 24,000 shares of its Series A Fixed Rate Cumulative Perpetual Preferred Stock to the Treasury for an aggregate purchase price of $24 million. This preferred stock pays a cumulative dividend at a rate of 5% for the first five years, and if not redeemed, pays a rate of 9% starting at the beginning of the sixth year. As part of its purchase of the preferred stock, the Treasury was also issued a warrant to purchase up to 373,832 shares of the Company’s common stock at an initial exercise price of $9.63 per share. If not exercised, the warrant terminates at the expiration of ten years. Under the agreement with the Treasury, the Company is subject to restrictions on its ability to increase the dividend rate on its common stock and to repurchase its common stock without Treasury consent.
Accounting for the issuance of preferred stock included entries to the equity portion of our consolidated balance sheet to recognize preferred stock at the full amount of the issuance, the warrant and discount on preferred stock at values calculated by discounting the future cash flows by a prevailing interest rate that a similar security would receive in the current market environment. At the time of issuance that discount rate was determined to be 12%. The fair value of the warrant of $950 thousand was calculated using the Black-Scholes model with inputs of 7 year volatility, average rate of quarterly dividends, 7 year Treasury strip rate and the exercise price of $9.63 per share exercisable for up to 10 years. The present value of the preferred stock using a 12% discount rate was $14.4 million. The preferred stock discount determined by the allocation of discount to the warrant is being accreted quarterly over a 5 year period on a constant effective yield method at a rate of approximately 6.4%. Allocation of the preferred stock discount and the warrant as of January 9, 2009 is provided in the tables below:
| 2009 | ||||
| Warrant Value |
||||
| Preferred |
$ | 24,000,000 | ||
| Price |
$ | 9.63 | ||
| Warrant - shares |
373,832 | |||
| Value per warrant |
$ | 2.54 | ||
| Fair value of warrant |
$ | 949,533 | ||
F - 43
Table of Contents
NPV of Preferred Stock
@ 12% discount rate
| (dollars in thousands) | ||||||||||||
| Fair Value |
Relative Value % |
Relative Value |
||||||||||
| $24 million 1/09/2009 |
||||||||||||
| NPV of preferred stock (12% discount rate) |
$ | 14,446 | 93.8 | % | $ | 22,519 | ||||||
| Fair value of warrant |
950 | 6.2 | % | 1,481 | ||||||||
| $ | 15,396 | 100.0 | % | $ | 24,000 | |||||||
On February 17, 2011, the Company entered into a written agreement with the FRB and SCC. Under the terms of this written agreement, the Parent and the Bank are subject to additional limitations and regulatory restrictions and may not declare or pay dividends to its shareholders (including payments by the Parent related to trust preferred securities) without prior regulatory approval. See Note 27 – Subsequent Events.
Note 22. Related Party Leases
The Bank has entered into a long-term land lease with a related party to provide for space for one branch located in Hartfield, Virginia. This lease has been classified as an operating lease for financial reporting purposes. The term of the lease runs through May 31, 2013. Future minimum lease payments required over the remaining term of this non-cancelable operating lease total $18 thousand. Under the terms of the lease, the Bank has the option to extend the term for additional periods of ten years each. Total lease expense was $8 thousand for each of the years 2010, 2009 and 2008, respectively.
Until April 30, 2010, the Bank was under a long-term lease with a related party to provide for space for one branch located in Mechanicsville, Virginia. This lease was classified as an operating lease for financial reporting purposes. Total lease expense was $26 thousand, $45 thousand and $44 thousand for the years 2010, 2009 and 2008, respectively.
Note 23. Lease Commitments
The Company currently has long-term leases for six of its retail branches. Five of the leases are for the retail branch buildings and one lease is for the land on which the Company owned retail branch is located. The leases provide for options to renew for various periods. Pursuant to the terms of these leases, the following is a schedule, by year, of future minimum lease payments required under the long-term non-cancelable lease agreements.
| (dollars in thousands) | Lease Payments | |||
| 2011 |
$ | 367 | ||
| 2012 |
343 | |||
| 2013 |
315 | |||
| 2014 |
157 | |||
| 2015 |
90 | |||
| Thereafter |
42 | |||
| $ | 1,314 | |||
Rent expense for the years ended December 31, 2010, 2009 and 2008 was $486 thousand, $484 thousand and $441 thousand, respectively, and was included in occupancy and equipment expenses.
Note 24. Common Stock Repurchases
In January 2001, the Company announced a stock repurchase program by which management was authorized to repurchase up to 300,000 shares of the Company’s common stock. This plan was amended in 2003 and the number of shares which management is authorized to repurchase is up to 5% of the outstanding shares of the Company’s common stock on January 1 of each year. There is no stated expiration date for the program. During 2010 and 2009,
F - 44
Table of Contents
the Company did not repurchase any of its common stock. During 2008, the Company repurchased 70,545 shares of its common stock at an average price of $17.53 per share.
In connection with the Company’s participation in the Treasury’s Capital Purchase Program, as previously described, certain limitations on the Company’s ability to repurchase its common stock have been imposed. See Note 21 – Preferred Stock and Warrant.
On February 17, 2011, the Company entered into a written agreement with the FRB and SCC. Under the terms of this written agreement, the Parent and the Bank are subject to additional limitations and regulatory restrictions and may not declare or pay dividends to its shareholders (including payments by the Parent on its trust preferred securities) and may not purchase or redeem shares of its stock without prior regulatory approval. See Note 27 – Subsequent Events.
Note 25. Condensed Parent Company Only Financial Information
The condensed financial position as of December 31, 2010 and 2009 and the condensed results of operations and cash flows for each of the years in the three-year period ended December 31, 2010, of Eastern Virginia Bankshares, Inc., parent company only, are presented below.
Condensed Balance Sheets
December 31, 2010 and 2009
(dollars in thousands)
| 2010 | 2009 | |||||||
| Assets |
||||||||
| Cash on deposit with subsidiary |
$ | 4,045 | $ | 3,381 | ||||
| Subordinated debt in subsidiary |
11,000 | 13,000 | ||||||
| Investment in subsidiaries |
85,358 | 99,093 | ||||||
| Deferred income taxes, net |
61 | 811 | ||||||
| Prepaid benefit cost |
1,021 | — | ||||||
| Other assets |
423 | 401 | ||||||
| Total assets |
$ | 101,908 | $ | 116,686 | ||||
| Liabilities and Shareholders’ Equity |
||||||||
| Trust preferred debt |
$ | 10,310 | $ | 10,310 | ||||
| Accrued benefit cost |
— | 1,115 | ||||||
| Other liabilities |
180 | 63 | ||||||
| Total shareholders’ equity |
91,418 | 105,198 | ||||||
| Total liabilities and shareholders’ equity |
$ | 101,908 | $ | 116,686 | ||||
F - 45
Table of Contents
Condensed Statements of Operations
Years Ended December 31, 2010, 2009 and 2008
(dollars in thousands)
| 2010 | 2009 | 2008 | ||||||||||
| Income: |
||||||||||||
| Interest on deposit with subsidiary |
$ | 36 | $ | 106 | $ | 279 | ||||||
| Interest on subordinated debt |
770 | 1,376 | 432 | |||||||||
| Actuarial gain on pension curtailment |
— | — | 1,328 | |||||||||
| Other |
12 | — | — | |||||||||
| Total income |
818 | 1,482 | 2,039 | |||||||||
| Expenses: |
||||||||||||
| Interest on trust preferred debt |
334 | 395 | 628 | |||||||||
| Professional fees |
197 | 592 | 174 | |||||||||
| Marketing and advertising |
— | 79 | — | |||||||||
| Other |
181 | 253 | 172 | |||||||||
| Total expenses |
712 | 1,319 | 974 | |||||||||
| Income before income tax expense and equity in undistributed net income (loss) of subsidiary |
106 | 163 | 1,065 | |||||||||
| Income tax expense |
36 | 55 | 362 | |||||||||
| Income before equity in undistributed net income (loss) of subsidiary |
70 | 108 | 703 | |||||||||
| Equity in undistributed net income (loss) of subsidiary |
(10,829 | ) | (8,912 | ) | 2,368 | |||||||
| Net income (loss) |
$ | (10,759 | ) | $ | (8,804 | ) | $ | 3,071 | ||||
F - 46
Table of Contents
Condensed Statements of Cash Flows
Years Ended December 31, 2010, 2009 and 2008
(dollars in thousands)
| 2010 | 2009 | 2008 | ||||||||||
| Operating activities: |
||||||||||||
| Net (loss) income |
$ | (10,759 | ) | $ | (8,804 | ) | $ | 3,071 | ||||
| Adjustments to reconcile net (loss) income to net cash provided by (used in) operating activities: |
||||||||||||
| Equity in undistributed net loss (income) of subsidiary |
10,829 | 8,912 | (2,368 | ) | ||||||||
| Stock based compensation |
208 | 248 | 277 | |||||||||
| Net change in: |
||||||||||||
| Other assets |
(22 | ) | 876 | (13,695 | ) | |||||||
| Other liabilities |
117 | (12 | ) | 1,583 | ||||||||
| Net cash provided by (used in) operating activities |
373 | 1,220 | (11,132 | ) | ||||||||
| Investing activities: |
||||||||||||
| Subordinated debt to subsidiary |
2,000 | — | (11,000 | ) | ||||||||
| Increase in investment in subsidiary |
— | (20,000 | ) | — | ||||||||
| Net cash provided by (used in) investing activities |
2,000 | (20,000 | ) | (11,000 | ) | |||||||
| Financing activities: |
||||||||||||
| Common stock repurchased |
— | — | (1,237 | ) | ||||||||
| Issuance of common stock under dividend reinvestment plan |
163 | 283 | 434 | |||||||||
| Issuance of preferred stock to U.S. Treasury |
— | 24,000 | — | |||||||||
| Director stock grant |
43 | 54 | 104 | |||||||||
| Dividends paid - common |
(715 | ) | (1,838 | ) | (3,778 | ) | ||||||
| Dividends paid - preferred |
(1,200 | ) | (1,020 | ) | — | |||||||
| Net cash (used in) provided by financing activities |
(1,709 | ) | 21,479 | (4,477 | ) | |||||||
| Net increase (decrease) in cash on deposit with subsidiary |
664 | 2,699 | (26,609 | ) | ||||||||
| Cash on deposit with subsidiary, January 1 |
3,381 | 682 | 27,291 | |||||||||
| Cash on deposit with subsidiary, December 31 |
$ | 4,045 | $ | 3,381 | $ | 682 | ||||||
Note 26. Quarterly Financial Data (unaudited)
Summarized unaudited quarterly financial data for the years ended December 31, 2010 and 2009 is as follows:
F - 47
Table of Contents
| 2010 | ||||||||||||||||
| (dollars in thousands, except per share data) | Fourth | Third | Second | First | ||||||||||||
| Interest and dividend income |
$ | 12,888 | $ | 13,568 | $ | 13,394 | $ | 13,660 | ||||||||
| Interest expense |
4,197 | 4,428 | 4,447 | 4,650 | ||||||||||||
| Net interest income |
8,691 | 9,140 | 8,947 | 9,010 | ||||||||||||
| Provision for loan losses |
12,905 | 1,550 | 12,625 | 1,850 | ||||||||||||
| Noninterest income |
1,225 | 3,527 | 3,116 | 2,124 | ||||||||||||
| Noninterest expenses |
8,916 | 8,999 | 8,771 | 7,885 | ||||||||||||
| Income (loss) before income taxes |
(11,905 | ) | 2,118 | (9,333 | ) | 1,399 | ||||||||||
| Income tax expense (benefit) |
(4,193 | ) | 532 | (3,366 | ) | 65 | ||||||||||
| Net income (loss) |
$ | (7,712 | ) | $ | 1,586 | $ | (5,967 | ) | $ | 1,334 | ||||||
| Less: Effective dividend on preferred stock |
373 | 373 | 373 | 373 | ||||||||||||
| Net income (loss) available to common shareholders |
$ | (8,085 | ) | $ | 1,213 | $ | (6,340 | ) | $ | 961 | ||||||
| Income (loss) per common share: basic |
$ | (1.35 | ) | $ | 0.20 | $ | (1.06 | ) | $ | 0.16 | ||||||
| diluted |
$ | (1.35 | ) | $ | 0.20 | $ | (1.06 | ) | $ | 0.16 | ||||||
| Dividends per share, common |
$ | 0.01 | $ | 0.01 | $ | 0.05 | $ | 0.05 | ||||||||
| 2009 | ||||||||||||||||
| (dollars in thousands, except per share data) | Fourth | Third | Second | First | ||||||||||||
| Interest and dividend income |
$ | 14,091 | $ | 14,047 | $ | 14,656 | $ | 13,933 | ||||||||
| Interest expense |
5,227 | 5,990 | 6,464 | 6,369 | ||||||||||||
| Net interest income |
8,864 | 8,057 | 8,192 | 7,564 | ||||||||||||
| Provision for loan losses |
1,700 | 850 | 750 | 900 | ||||||||||||
| Noninterest income (loss) |
1,423 | (13,200 | ) | (2,269 | ) | 1,557 | ||||||||||
| Noninterest expenses |
7,903 | 7,330 | 8,036 | 7,379 | ||||||||||||
| Income (loss) before income taxes |
684 | (13,323 | ) | (2,863 | ) | 842 | ||||||||||
| Income tax expense (benefit) |
(78 | ) | (4,805 | ) | (1,092 | ) | 119 | |||||||||
| Net income (loss) |
$ | 762 | $ | (8,518 | ) | $ | (1,771 | ) | $ | 723 | ||||||
| Less: Effective dividend on preferred stock |
373 | 372 | 372 | 342 | ||||||||||||
| Net income (loss) available to common shareholders |
$ | 389 | $ | (8,890 | ) | $ | (2,143 | ) | $ | 381 | ||||||
| Income (loss) per common share: basic |
$ | 0.07 | $ | (1.50 | ) | $ | (0.36 | ) | $ | 0.06 | ||||||
| diluted |
$ | 0.07 | $ | (1.50 | ) | $ | (0.36 | ) | $ | 0.06 | ||||||
| Dividends per share, common |
$ | 0.05 | $ | 0.05 | $ | 0.05 | $ | 0.16 | ||||||||
Note 27. Subsequent Events
Effective February 17, 2011, the Company and the Bank entered into a Written Agreement (the “Written Agreement”) with the FRB and the SCC.
Under the terms of the Written Agreement, the Bank has agreed to develop and submit for approval within the time periods specified therein written plans to: (a) strengthen board oversight of management and the Bank’s operation; (b) strengthen credit risk management practices; (c) enhance lending and credit administration; (d) enhance the grading of the Bank’s loan portfolio; (e) improve the Bank’s position with respect to loans, relationships, or other assets in excess of $900 thousand which are now or in the future become past due more than 90 days, which are on the Bank’s problem loan list, or which are adversely classified in any report of examination of the Bank; (f) review and revise the Bank’s methodology for determining the allowance for loan and lease losses (“ALLL”) and maintain an adequate ALLL; (g) enhance the Bank’s written internal audit program; (h) enhance management of the Bank’s
F - 48
Table of Contents
liquidity position and funds management practices; (i) establish a revised contingency funding plan; (j) establish a revised investment policy; and (k) strengthen information technology.
In addition, the Bank has agreed that it will: (a) not extend, renew, or restructure any credit that has been criticized by the FRB or the SCC absent prior board of directors approval in accordance with the restrictions in the Written Agreement; and (b) eliminate all assets or portions of assets classified as “loss” and thereafter charge off all assets classified as “loss” in a federal or state report of examination, unless otherwise approved by the Reserve Bank.
Under the terms of the Written Agreement, both the Company and the Bank have agreed to submit capital plans to maintain sufficient capital at the Company, on a consolidated basis, and the Bank, on a stand-alone basis, and to refrain from declaring or paying dividends without prior regulatory approval. The Company has agreed that it will not take any other form of payment representing a reduction in the Bank’s capital or make any distributions of interest, principal, or other sums on subordinated debentures or trust preferred securities without prior regulatory approval. The Company may not incur, increase or guarantee any debt without prior regulatory approval and has agreed not to purchase or redeem any shares of its stock without prior regulatory approval.
F - 49