Attached files
| file | filename |
|---|---|
| 8-K - FORM 8-K - HANCOCK WHITNEY CORP | d573318d8k.htm |
Exhibit 99.1

For Immediate Release
July 25, 2013
For More Information
Trisha Voltz Carlson
SVP, Investor Relations Manager
504.299.5208
trisha.carlson@hancockbank.com
Hancock reports second quarter 2013 financial results
GULFPORT, Miss. (July 25, 2013) — Hancock Holding Company (Nasdaq: HBHC) today announced its financial results for the second quarter of 2013. Net income was $46.9 million, or $.55 per diluted common share, compared to $48.6 million, or $.56, in the first quarter of 2013. Net income was $39.3 million, or $.46 per diluted common share, in the second quarter of 2012, which included pre-tax merger-related costs of $11.9 million.
Highlights of the Company’s second quarter of 2013 results:
| • | Approximately $245 million linked-quarter net loan growth, or 9% annualized, and $760 million, or 7%, year-over-year loan growth (each excluding the FDIC-covered portfolio). |
| • | Core net interest income (TE) and net interest margin (NIM) relatively stable, growth in fee income, led to improved core revenue. |
| • | Continued improvement in overall asset quality metrics. |
| • | Initiated 5% common stock buyback in May through an accelerated share repurchase (ASR) program, receiving 2.8 million shares to-date. |
(The company defines its core results as reported results less the impact of net purchase accounting adjustments.)
“The second quarter’s performance reflected an improvement in our core results, a trend we expect to build on in the future,” said Hancock’s President and Chief Executive Officer Carl J. Chaney. “Coupled with the ongoing implementation of the expense and efficiency initiative announced last quarter, we believe our Company is becoming better positioned to operate in both today’s economic environment as well as an eventual sustained, positive turn in the overall economy.”
Return on average assets (ROA) was 0.99% for the second quarter of 2013, slightly down from 1.03% in the first quarter of 2013. ROA was 1.00% in the second quarter a year ago on an operating basis, which excludes tax-effected merger-related expenses in that period.
Total assets were $18.9 billion at June 30, 2013, a decrease of less than 1% from $19.1 billion at March 31, 2013.
- 1 -
Hancock reports second quarter 2013 financial results
July 25, 2013
Loans
Total loans at June 30, 2013 were $11.7 billion, up $199 million from March 31, 2013. Excluding the FDIC-covered portfolio, which declined $46 million during the second quarter of 2013, total loans increased $245 million, or 2.2% linked-quarter. The largest component of net growth during the quarter was in the commercial and industrial (C&I) portfolio which was up $228 million linked-quarter. Residential mortgage loans increased approximately $30 million, while construction and land development (C&D) loans continued to decline during the quarter. New loan activity in all markets across the Company’s footprint contributed to the solid loan growth this quarter.
For the second quarter of 2013, average total loans were $11.6 billion, up $93 million from the first quarter of 2013.
Excluding the FDIC-covered portfolio, total loans were up $760 million, or 7%, from a year earlier.
Deposits
Total deposits at June 30, 2013 were $15.2 billion, down $97 million, or less than 1%, from March 31, 2013. Average deposits for the second quarter of 2013 were $15.2 billion, down $101 million, or less than 1%, from the first quarter of 2013.
Noninterest-bearing demand deposits (DDAs) totaled $5.3 billion at June 30, 2013, down $78 million, or 1%, compared to March 31, 2013. The decline mainly reflects the movement from DDAs to sweep time deposit products for a few commercial customers. DDAs comprised 35% of total period-end deposits at June 30, 2013.
Time deposits (CDs) totaled $2.4 billion at June 30, 2013, up $151 million, or 7%, from March 31, 2013. Excluding the impact from the $253 million increase in sweep time deposit product balances, CDs were down $102 million, or 5%, reflecting mainly the impact of the low rate environment for reinvestment opportunities on renewals.
Interest-bearing public fund deposits totaled $1.4 billion at June 30, 2013, down $118 million, or 8%, linked-quarter. As noted previously, public fund deposits typically reflect higher balances at year-end with subsequent reductions beginning in the first quarter and continuing into the second quarter.
Interest-bearing transaction and savings deposits totaled $6.0 billion at June 30, 2013, down $52 million, or less than 1%, compared to March 31, 2013.
Asset Quality
Non-performing assets (NPAs) totaled $216 million at June 30, 2013, down $13 million from $229 million at March 31, 2013. Non-performing assets as a percent of total loans, foreclosed and surplus real estate (ORE) and other foreclosed assets was 1.84% at June 30, 2013, compared to 1.98% at March 31, 2013. The decrease in overall NPAs during the second quarter reflects a net reduction of $7.4 million in ORE properties and a $5.4 million reduction in non-performing loans.
- 2 -
Hancock reports second quarter 2013 financial results
July 25, 2013
Future levels of ORE may be volatile in the near term due to ongoing activity related to the covered portfolio and the anticipated closings of certain bank locations in connection with the efficiency initiative.
The Company’s total allowance for loan losses was $138.0 million at June 30, 2013, compared to $137.8 million at March 31, 2013. The ratio of the allowance to period-end loans was 1.18% at June 30, 2013, down slightly from 1.20% at March 31, 2013. The allowance maintained on the originated portion of the loan portfolio totaled $76.4 million, or 0.93% of related loans, at June 30, 2013, up from $75.5 million, or 1.02%, at March 31, 2013.
Net charge-offs from the non-covered loan portfolio were $7.0 million, or 0.24% of average total loans on an annualized basis in the second quarter of 2013 compared to $6.6 million, or 0.23% of average total loans in the first quarter of 2013.
During the second quarter of 2013, Hancock recorded a total provision for loan losses of $8.3 million, down from $9.6 million in the first quarter of 2013. The provision for non-covered loans was $7.9 million in the second quarter of 2013, compared to $3.0 million in the first quarter of 2013. The increase was related in part to the increased volume of new loans originated during the second quarter.
The Company recorded $1.4 million of impairment on certain pools of covered loans during the second quarter of 2013, with a related increase of $1.0 million in the Company’s FDIC loss share receivable. The net provision from the covered portfolio was $.4 million in the second quarter of 2013 compared to $6.6 million for the first quarter of 2013. As a reminder, the first quarter provision for covered loans included approximately $6.5 million of impairment related to changes in the estimated timing of cash flows which does not result in an offsetting impact on the loss share receivable.
Net Interest Income
Net interest income (TE) for the second quarter of 2013 was $171.8 million, down $4.9 million from the first quarter of 2013. Average earning assets were $16.5 billion in the second quarter of 2013, virtually unchanged from the first quarter of 2013.
Approximately $4.4 million of the decline was related to a lower level of total purchase-accounting loan accretion on acquired loans in the second quarter, mainly related to the volatility from excess cash recoveries. The slide presentation referenced below includes detailed information on expected loan accretion and excess cash recoveries. Approximately $7.5 million ($.06 per diluted common share) of excess cash recoveries were included in the first quarter’s results, while approximately $3.1 million ($.02 per diluted common share) was included in the second quarter’s results. Excess cash recoveries include cash collected on certain zero carrying value acquired loan pools.
- 3 -
Hancock reports second quarter 2013 financial results
July 25, 2013
The net interest margin (TE) was 4.17% for the second quarter of 2013, down 15 basis points (bps) from 4.32% in the first quarter of 2013. The core margin of 3.38% (reported net interest income (TE) excluding total net purchase accounting adjustments, annualized, as a percent of average earning assets) compressed approximately 3 bps during the second quarter of 2013, mainly related to the continued decline in the core loan yield. The margin was favorably impacted from the investment of excess liquidity discussed last quarter and a 3 bps reduction in the total cost of funds.
The slide presentation referenced below includes additional information on historical and expected future levels of purchase accounting adjustments.
Noninterest Income
Noninterest income totaled $63.9 million for the second quarter of 2013, up $3.7 million, or 6%, from the first quarter of 2013.
Service charges on deposits totaled $19.9 million for the second quarter of 2013, up $.8 million, or 4%, from the first quarter of 2013. The linked-quarter increase partly reflects the impact of two additional business days in the second quarter.
Trust, investment and annuity fees, and insurance fees totaled $19.8 million, up $2.6 million, or 15%, from the first quarter of 2013. The linked-quarter increase reflects some seasonality in these lines of business, in addition to the impact of higher stock market values.
Bankcard fees and ATM fees totaled $11.4 million, up $.3 million, or 3%, from the first quarter of 2013, reflecting additional activity during the second quarter.
Fees from secondary mortgage operations totaled $4.1 million for the second quarter of 2013, down $.2 million, or 6%, linked-quarter.
Noninterest Expense & Taxes
Noninterest expense for the second quarter of 2013 totaled $162.3 million, up $2.6 million, or 2%, from the first quarter of 2013. The overall increase is mainly related to a $2.6 million increase in other real estate (ORE) expense. ORE expense, included in other operating expense, totaled $3.4 million in the second quarter of 2013, compared to $.7 million in the first quarter of 2013.
Total personnel expense, the largest component of the Company’s expense base, was $87.6 million in the second quarter of 2013, down slightly from $87.9 million in the first quarter of 2013.
Despite the increase in overall expenses, the Company remains on track to achieve its efficiency and expense reduction target for the first quarter of 2014. In May of 2013, the Company announced the planned closing of approximately 40 branch locations across its 5-state footprint as part of the expense reduction initiative. As discussed below, the Company announced earlier this week the sale of 10 of these 40 branch locations. A significant portion of the cost
- 4 -
Hancock reports second quarter 2013 financial results
July 25, 2013
savings targeted for the first quarter of 2014 will be derived from these closures and sales. Currently the Company plans to complete the majority of branch closings on August 30, 2013, with the remaining branches scheduled to close or be sold by year-end. Management expects one-time costs associated with the branch closures and sales, to be booked in the third quarter of 2013. These costs are expected to be lower than the previous guidance of between $18 and $22 million. The branch sales, which are subject to regulatory approvals and certain closing conditions, will be reflected in Hancock’s fourth quarter 2013 financial results. The buyers expect to acquire approximately $54 million in loans and $60 million in deposits booked in the 10 retail branches.
The effective income tax rate for the second quarter of 2013 was 25%, unchanged from the first quarter of 2013. Management expects the effective tax rate to approximate 26-27% for 2013. The effective income tax rate continues to be less than the statutory rate of 35% due primarily to tax-exempt income and tax credits.
Capital
Common shareholders’ equity totaled $2.3 billion at June 30, 2013, down almost $132 million from March 31, 2013. The tangible common equity (TCE) ratio declined 62 bps to 8.52% at June 30, 2013. The linked-quarter decline mainly reflects the $115 million (63 bps) used in May of 2013 to execute an accelerated share repurchase (ASR) program in conjunction with the previously announced program to repurchase up to 5% of the Company’s outstanding common stock. Additionally, while the Company continued to add to its strong capital base through retained earnings, accumulated other comprehensive income (a component of equity) declined $47 million (26 bps) from March 31, 2013. The decline mainly reflects the impact of increased market rates on the valuation of the securities portfolio.
Management continues to review the strategic opportunities presented by Hancock’s strong capital position, including additional stock buybacks, organic growth, acquisitions or increased dividends. Additional capital ratios are included in the financial tables.
Near Term EPS Guidance
Management expects earnings to remain flat to slightly down from current levels for the remainder of 2013, as expected declines and volatility in accretion levels on the acquired portfolios continue to impact reported results.
Conference Call and Slide Presentation
Management will host a conference call for analysts and investors at 9:00 a.m. Central Time on Friday, July 26, 2013 to review the results. A live listen-only webcast of the call will be available under the Investor Relations section of Hancock’s website at www.hancockbank.com. A slide presentation related to second quarter results is also posted as part of the webcast link. To participate in the Q&A portion of the call, dial (877) 564-1219 or (973) 638-3429. An audio archive of the conference call will be available under the Investor Relations section of our website. A replay of the call will also be available through August 1, 2013 by dialing (855) 859-2056 or (404) 537-3406, passcode 14843195.
- 5 -
Hancock reports second quarter 2013 financial results
July 25, 2013
About Hancock Holding Company
Hancock Holding Company, the parent company of Hancock Bank and Whitney Bank, operates across a Gulf south corridor comprising south Mississippi; southern and central Alabama; southern Louisiana; the northern, central, and Panhandle regions of Florida; and Houston, Texas. The Hancock Holding Company family of financial services companies also includes Hancock Investment Services, Inc.; Hancock Insurance Agency and Whitney Insurance Agency, Inc.; corporate trust offices in Gulfport and Jackson, Mississippi, New Orleans and Baton Rouge, Louisiana, and Orlando, Florida; and Harrison Finance Company. Additional information is available at www.hancockbank.com and www.whitneybank.com.
Forward-Looking Statements
This news release contains “forward-looking statements” within the meaning of section 27A of the Securities Act of 1933, as amended, and section 21E of the Securities Exchange Act of 1934, as amended, and we intend such forward-looking statements to be covered by the safe harbor provisions therein and are including this statement for purposes of invoking these safe-harbor provisions. Forward-looking statements provide projections of results of operations or of financial condition or state other forward-looking information, such as expectations about future conditions and descriptions of plans and strategies for the future.
Forward-looking statements that we may make include, but may not be limited to, comments with respect to future levels of economic activity in our markets, loan growth, deposit trends, credit quality trends, future sales of nonperforming assets, net interest margin trends, future expense levels and the ability to achieve reductions in non-interest expense or other cost savings, projected tax rates, future profitability, improvements in expense to revenue (efficiency) ratio, purchase accounting impacts such as accretion levels, the impact of the branch rationalization process, and the financial impact of regulatory requirements.
Hancock’s ability to accurately project results or predict the effects of future plans or strategies is inherently limited. Although Hancock believes that the expectations reflected in its forward-looking statements are based on reasonable assumptions, actual results and performance could differ materially from those set forth in the forward-looking statements. Factors that could cause actual results to differ from those expressed in Hancock’s forward-looking statements include, but are not limited to, those risk factors outlined in Hancock’s public filings with the Securities and Exchange Commission, which are available at the SEC’s internet site (http://www.sec.gov).
You are cautioned not to place undue reliance on these forward-looking statements. Hancock does not intend, and undertakes no obligation, to update or revise any forward-looking statements, whether as a result of differences in actual results, changes in assumptions or changes in other factors affecting such statements, except as required by law.
- 6 -
Hancock Holding Company
Financial Highlights
(amounts in thousands, except per share data and FTE headcount)
(unaudited)
| Three Months Ended | Six Months Ended | |||||||||||||||||||
| 6/30/2013 | 3/31/2013 | 6/30/2012 | 6/30/2013 | 6/30/2012 | ||||||||||||||||
| Per Common Share Data |
||||||||||||||||||||
| Earnings per share: |
||||||||||||||||||||
| Basic |
$ | 0.55 | $ | 0.56 | $ | 0.46 | $ | 1.11 | $ | 0.68 | ||||||||||
| Diluted |
$ | 0.55 | $ | 0.56 | $ | 0.46 | $ | 1.11 | $ | 0.67 | ||||||||||
| Operating earnings per share: (a) |
||||||||||||||||||||
| Basic |
$ | 0.55 | $ | 0.56 | $ | 0.55 | $ | 1.11 | $ | 1.03 | ||||||||||
| Diluted |
$ | 0.55 | $ | 0.56 | $ | 0.55 | $ | 1.11 | $ | 1.02 | ||||||||||
| Cash dividends per share |
$ | 0.24 | $ | 0.24 | $ | 0.24 | $ | 0.48 | $ | 0.48 | ||||||||||
| Book value per share (period-end) |
$ | 28.57 | $ | 29.18 | $ | 28.30 | $ | 28.57 | $ | 28.30 | ||||||||||
| Tangible book value per share (period-end) |
$ | 18.83 | $ | 19.67 | $ | 18.46 | $ | 18.83 | $ | 18.46 | ||||||||||
| Weighted average number of shares: |
||||||||||||||||||||
| Basic |
83,279 | 84,871 | 84,751 | 84,071 | 84,742 | |||||||||||||||
| Diluted |
83,357 | 84,972 | 85,500 | 84,153 | 85,467 | |||||||||||||||
| Period-end number of shares |
82,078 | 84,882 | 84,774 | 82,078 | 84,774 | |||||||||||||||
| Market data: |
||||||||||||||||||||
| High sales price |
$ | 30.93 | $ | 33.59 | $ | 36.56 | $ | 33.59 | $ | 36.73 | ||||||||||
| Low sales price |
$ | 25.00 | $ | 29.37 | $ | 27.96 | $ | 25.00 | $ | 27.96 | ||||||||||
| Period end closing price |
$ | 30.07 | $ | 30.92 | $ | 30.44 | $ | 30.07 | $ | 30.44 | ||||||||||
| Trading volume |
38,599 | 29,469 | 39,310 | 68,068 | 71,733 | |||||||||||||||
| Other Period-end Data |
||||||||||||||||||||
| FTE headcount |
4,160 | 4,197 | 4,456 | 4,160 | 4,456 | |||||||||||||||
| Tangible common equity |
$ | 1,545,122 | $ | 1,669,435 | $ | 1,565,029 | $ | 1,545,122 | $ | 1,565,029 | ||||||||||
| Tier I capital |
$ | 1,622,713 | $ | 1,700,115 | $ | 1,581,101 | $ | 1,622,713 | $ | 1,581,101 | ||||||||||
| Goodwill |
$ | 625,675 | $ | 625,675 | $ | 628,877 | $ | 625,675 | $ | 628,877 | ||||||||||
| Amortizing intangibles |
$ | 174,423 | $ | 181,853 | $ | 205,249 | $ | 174,423 | $ | 205,249 | ||||||||||
| Performance Ratios |
||||||||||||||||||||
| Return on average assets |
0.99 | % | 1.03 | % | 0.83 | % | 1.01 | % | 0.61 | % | ||||||||||
| Return on average assets (operating) (a) |
0.99 | % | 1.03 | % | 1.00 | % | 1.01 | % | 0.92 | % | ||||||||||
| Return on average common equity |
7.82 | % | 8.05 | % | 6.62 | % | 7.93 | % | 4.88 | % | ||||||||||
| Return on average common equity (operating) (a) |
7.82 | % | 8.05 | % | 7.93 | % | 7.93 | % | 7.40 | % | ||||||||||
| Return on average tangible common equity |
11.74 | % | 12.04 | % | 10.24 | % | 11.89 | % | 7.60 | % | ||||||||||
| Return on average tangible common equity (operating) (a) |
11.74 | % | 12.04 | % | 12.26 | % | 11.89 | % | 11.52 | % | ||||||||||
| Tangible common equity ratio |
8.52 | % | 9.14 | % | 8.72 | % | 8.52 | % | 8.72 | % | ||||||||||
| Earning asset yield (TE) |
4.42 | % | 4.60 | % | 4.80 | % | 4.51 | % | 4.80 | % | ||||||||||
| Total cost of funds |
0.25 | % | 0.28 | % | 0.32 | % | 0.27 | % | 0.35 | % | ||||||||||
| Net interest margin (TE) |
4.17 | % | 4.32 | % | 4.48 | % | 4.24 | % | 4.45 | % | ||||||||||
| Efficiency ratio (b) |
65.68 | % | 64.17 | % | 65.67 | % | 64.92 | % | 66.73 | % | ||||||||||
| Allowance for loan losses as a percent of period-end loans |
1.18 | % | 1.20 | % | 1.27 | % | 1.18 | % | 1.27 | % | ||||||||||
| Allowance for loan losses to non-performing loans + accruing loans 90 days past due |
91.43 | % | 87.34 | % | 104.78 | % | 91.43 | % | 104.78 | % | ||||||||||
| Average loan/deposit ratio |
76.41 | % | 75.30 | % | 73.51 | % | 75.86 | % | 73.30 | % | ||||||||||
| Noninterest income excluding securities transactions as a percent of total revenue (TE) |
27.11 | % | 25.40 | % | 26.06 | % | 26.25 | % | 25.81 | % | ||||||||||
| (a) | Excludes tax-effected merger related expenses and securities transactions. Management believes that this is a useful financial measure because it enables investors to assess ongoing operations. |
| (b) | Efficiency ratio is defined as noninterest expense as a percent of total revenue (TE) before amortization of purchased intangibles, securities transactions, and merger related expenses. |
- 7 -
Hancock Holding Company
Financial Highlights
(amounts in thousands)
(unaudited)
| Three Months Ended | Six Months Ended | |||||||||||||||||||
| 6/30/2013 | 3/31/2013 | 6/30/2012 | 6/30/2013 | 6/30/2012 | ||||||||||||||||
| Asset Quality Information |
||||||||||||||||||||
| Non-accrual loans (c) |
$ | 110,516 | $ | 115,289 | $ | 113,384 | $ | 110,516 | $ | 113,384 | ||||||||||
| Restructured loans (d) |
33,741 | 34,390 | 19,518 | 33,741 | 19,518 | |||||||||||||||
|
|
|
|
|
|
|
|
|
|
|
|||||||||||
| Total non-performing loans |
144,257 | 149,679 | 132,902 | 144,257 | 132,902 | |||||||||||||||
| ORE and foreclosed assets |
72,235 | 79,627 | 138,118 | 72,235 | 138,118 | |||||||||||||||
|
|
|
|
|
|
|
|
|
|
|
|||||||||||
| Total non-performing assets |
$ | 216,492 | $ | 229,306 | $ | 271,020 | $ | 216,492 | $ | 271,020 | ||||||||||
|
|
|
|
|
|
|
|
|
|
|
|||||||||||
| Non-performing assets as a percent of loans, ORE and foreclosed assets |
1.84 | % | 1.98 | % | 2.42 | % | 1.84 | % | 2.42 | % | ||||||||||
| Accruing loans 90 days past due (c) |
$ | 6,647 | $ | 8,076 | $ | 1,443 | $ | 6,647 | $ | 1,443 | ||||||||||
| Accruing loans 90 days past due as a percent of loans |
0.06 | % | 0.07 | % | 0.01 | % | 0.06 | % | 0.01 | % | ||||||||||
| Non-performing assets + accruing loans 90 days past due to loans, ORE and foreclosed assets |
1.90 | % | 2.05 | % | 2.43 | % | 1.90 | % | 2.43 | % | ||||||||||
| Net charge-offs - non-covered |
$ | 7,032 | $ | 6,633 | $ | 10,211 | $ | 13,665 | $ | 17,265 | ||||||||||
| Net charge-offs - covered |
2,026 | 3,222 | 3,499 | 5,248 | 19,289 | |||||||||||||||
| Net charge-offs - non-covered as a percent of average loans |
0.24 | % | 0.23 | % | 0.37 | % | 0.24 | % | 0.31 | % | ||||||||||
| Allowance for loan losses |
$ | 137,969 | $ | 137,777 | $ | 140,768 | $ | 137,969 | $ | 140,768 | ||||||||||
| Allowance for loan losses as a percent of period-end loans |
1.18 | % | 1.20 | % | 1.27 | % | 1.18 | % | 1.27 | % | ||||||||||
| Allowance for loan losses to non-performing loans + accruing loans |
||||||||||||||||||||
| 90 days past due |
91.43 | % | 87.34 | % | 104.78 | % | 91.43 | % | 104.78 | % | ||||||||||
| Provision for loan losses |
$ | 8,257 | $ | 9,578 | $ | 8,025 | $ | 17,835 | $ | 18,040 | ||||||||||
| Allowance for Loan Losses |
||||||||||||||||||||
| Beginning Balance |
$ | 137,777 | $ | 136,171 | $ | 142,337 | $ | 136,171 | $ | 124,881 | ||||||||||
| Provision for loan losses before FDIC benefit - covered loans |
1,355 | 8,484 | 5,146 | 9,839 | 37,025 | |||||||||||||||
| Benefit attributable to FDIC loss share agreement |
(993 | ) | (1,883 | ) | (4,116 | ) | (2,876 | ) | (34,401 | ) | ||||||||||
| Provision for loan losses - non-covered loans |
7,895 | 2,977 | 6,995 | 10,872 | 15,416 | |||||||||||||||
|
|
|
|
|
|
|
|
|
|
|
|||||||||||
| Net provision for loan losses |
8,257 | 9,578 | 8,025 | 17,835 | 18,040 | |||||||||||||||
|
|
|
|
|
|
|
|
|
|
|
|||||||||||
| Increase in FDIC loss share receivable |
993 | 1,883 | 4,116 | 2,876 | 34,401 | |||||||||||||||
| Charge-offs - non-covered |
11,451 | 11,237 | 12,711 | 22,688 | 22,377 | |||||||||||||||
| Recoveries - non-covered |
(4,419 | ) | (4,604 | ) | (2,500 | ) | (9,023 | ) | (5,112 | ) | ||||||||||
| Net charge-offs - covered |
2,026 | 3,222 | 3,499 | 5,248 | 19,289 | |||||||||||||||
|
|
|
|
|
|
|
|
|
|
|
|||||||||||
| Net charge-offs |
9,058 | 9,855 | 13,710 | 18,913 | 36,554 | |||||||||||||||
|
|
|
|
|
|
|
|
|
|
|
|||||||||||
| Ending Balance |
$ | 137,969 | $ | 137,777 | $ | 140,768 | $ | 137,969 | $ | 140,768 | ||||||||||
|
|
|
|
|
|
|
|
|
|
|
|||||||||||
| Net Charge-off Information |
||||||||||||||||||||
| Net charge-offs - non-covered: |
||||||||||||||||||||
| Commercial/real estate loans |
$ | 3,834 | $ | 4,304 | $ | 5,627 | $ | 8,138 | $ | 9,906 | ||||||||||
| Residential mortgage loans |
702 | (352 | ) | 1,846 | 350 | 2,567 | ||||||||||||||
| Consumer loans |
2,496 | 2,681 | 2,738 | 5,177 | 4,792 | |||||||||||||||
|
|
|
|
|
|
|
|
|
|
|
|||||||||||
| Total net charge-offs - non-covered |
$ | 7,032 | $ | 6,633 | $ | 10,211 | $ | 13,665 | $ | 17,265 | ||||||||||
|
|
|
|
|
|
|
|
|
|
|
|||||||||||
| Average loans: |
||||||||||||||||||||
| Commercial/real estate loans |
$ | 8,418,140 | $ | 8,284,408 | $ | 7,946,781 | $ | 8,351,642 | $ | 7,982,217 | ||||||||||
| Residential mortgage loans |
1,625,672 | 1,626,629 | 1,548,803 | 1,626,148 | 1,548,945 | |||||||||||||||
| Consumer loans |
1,579,397 | 1,618,891 | 1,644,532 | 1,599,036 | 1,635,334 | |||||||||||||||
|
|
|
|
|
|
|
|
|
|
|
|||||||||||
| Total average loans |
$ | 11,623,209 | $ | 11,529,928 | $ | 11,140,116 | $ | 11,576,826 | $ | 11,166,496 | ||||||||||
|
|
|
|
|
|
|
|
|
|
|
|||||||||||
| Net charge-offs - non-covered to average loans: |
||||||||||||||||||||
| Commercial/real estate loans |
0.18 | % | 0.21 | % | 0.28 | % | 0.20 | % | 0.25 | % | ||||||||||
| Residential mortgage loans |
0.17 | % | (0.09 | )% | 0.48 | % | 0.04 | % | 0.33 | % | ||||||||||
| Consumer loans |
0.63 | % | 0.67 | % | 0.67 | % | 0.65 | % | 0.59 | % | ||||||||||
|
|
|
|
|
|
|
|
|
|
|
|||||||||||
| Total net charge-offs - non-covered to average loans |
0.24 | % | 0.23 | % | 0.37 | % | 0.24 | % | 0.31 | % | ||||||||||
|
|
|
|
|
|
|
|
|
|
|
|||||||||||
| (c) | Non-accrual loans and accruing loans past due 90 days or more do not include non-accrual restructured loans and acquired credit-impaired loans which were written down to fair value upon acquisition and accrete interest income over the remaining life of the loan. |
| (d) | Included in restructured loans are $22.2 million, $21.1 million, and $9.7 million in non-accrual loans at 6/30/13, 3/31/13, and 6/30/12, respectively. Total excludes acquired credit-impaired loans. |
- 8 -
Hancock Holding Company
Financial Highlights
(amounts in thousands)
(unaudited)
| Three Months Ended | Six Months Ended | |||||||||||||||||||
| 6/30/2013 | 3/31/2013 | 6/30/2012 | 6/30/2013 | 6/30/2012 | ||||||||||||||||
| Income Statement |
||||||||||||||||||||
| Interest income |
$ | 179,649 | $ | 185,272 | $ | 190,489 | $ | 364,921 | $ | 382,205 | ||||||||||
| Interest income (TE) |
182,292 | 187,998 | 193,323 | 370,290 | 387,988 | |||||||||||||||
| Interest expense |
10,470 | 11,257 | 13,030 | 21,727 | 28,458 | |||||||||||||||
|
|
|
|
|
|
|
|
|
|
|
|||||||||||
| Net interest income (TE) |
171,822 | 176,741 | 180,293 | 348,563 | 359,530 | |||||||||||||||
| Provision for loan losses |
8,257 | 9,578 | 8,025 | 17,835 | 18,040 | |||||||||||||||
| Noninterest income excluding securities transactions |
63,897 | 60,187 | 63,552 | 124,084 | 125,046 | |||||||||||||||
| Securities transactions gains/(losses) |
— | — | — | — | 12 | |||||||||||||||
| Noninterest expense |
162,250 | 159,602 | 179,972 | 321,852 | 385,435 | |||||||||||||||
|
|
|
|
|
|
|
|
|
|
|
|||||||||||
| Income before income taxes |
62,569 | 65,022 | 53,014 | 127,591 | 75,330 | |||||||||||||||
| Income tax expense |
15,707 | 16,446 | 13,710 | 32,153 | 17,531 | |||||||||||||||
| Net income |
$ | 46,862 | $ | 48,576 | $ | 39,304 | $ | 95,438 | $ | 57,799 | ||||||||||
|
|
|
|
|
|
|
|
|
|
|
|||||||||||
| Merger-related expenses |
— | — | 11,913 | — | 45,827 | |||||||||||||||
| Securities transactions gains/(losses) |
— | — | — | — | 12 | |||||||||||||||
| Taxes on adjustments |
— | — | 4,170 | — | 16,035 | |||||||||||||||
|
|
|
|
|
|
|
|
|
|
|
|||||||||||
| Operating income (e) |
$ | 46,862 | $ | 48,576 | $ | 47,047 | $ | 95,438 | $ | 87,579 | ||||||||||
|
|
|
|
|
|
|
|
|
|
|
|||||||||||
| Noninterest Income and Noninterest Expense |
||||||||||||||||||||
| Service charges on deposit accounts |
$ | 19,864 | $ | 19,015 | $ | 20,907 | $ | 38,879 | $ | 37,181 | ||||||||||
| Trust fees |
9,803 | 8,692 | 7,983 | 18,495 | 16,721 | |||||||||||||||
| Bank card fees |
7,798 | 7,483 | 8,075 | 15,281 | 16,539 | |||||||||||||||
| Investment & annuity fees |
5,192 | 4,577 | 4,607 | 9,769 | 9,022 | |||||||||||||||
| ATM fees |
3,601 | 3,575 | 4,844 | 7,176 | 9,177 | |||||||||||||||
| Secondary mortgage market operations |
4,139 | 4,383 | 3,015 | 8,522 | 7,017 | |||||||||||||||
| Insurance fees |
4,845 | 3,994 | 4,581 | 8,839 | 8,058 | |||||||||||||||
| Other income |
8,655 | 8,468 | 9,540 | 17,123 | 21,331 | |||||||||||||||
|
|
|
|
|
|
|
|
|
|
|
|||||||||||
| Noninterest income excluding securities transactions |
$ | 63,897 | $ | 60,187 | $ | 63,552 | $ | 124,084 | $ | 125,046 | ||||||||||
| Securities transactions gains/(losses) |
— | — | — | — | 12 | |||||||||||||||
|
|
|
|
|
|
|
|
|
|
|
|||||||||||
| Total noninterest income including securities transactions |
$ | 63,897 | $ | 60,187 | $ | 63,552 | $ | 124,084 | $ | 125,058 | ||||||||||
| Personnel expense |
$ | 87,595 | $ | 87,927 | $ | 89,329 | $ | 175,522 | $ | 181,200 | ||||||||||
| Occupancy expense (net) |
12,404 | 12,326 | 13,603 | 24,730 | 28,005 | |||||||||||||||
| Equipment expense |
4,919 | 5,301 | 5,924 | 10,220 | 11,800 | |||||||||||||||
| Other operating expense |
49,901 | 46,493 | 51,281 | 96,394 | 102,377 | |||||||||||||||
| Amortization of intangibles |
7,431 | 7,555 | 7,922 | 14,986 | 16,226 | |||||||||||||||
| Merger-related expenses |
— | — | 11,913 | — | 45,827 | |||||||||||||||
|
|
|
|
|
|
|
|
|
|
|
|||||||||||
| Total noninterest expense |
$ | 162,250 | $ | 159,602 | $ | 179,972 | $ | 321,852 | $ | 385,435 | ||||||||||
|
|
|
|
|
|
|
|
|
|
|
|||||||||||
| (e) | Net income less tax-effected merger costs and securities gains/losses. Management believes that this is a useful financial measure because it enables investors to assess ongoing operations. |
- 9 -
Hancock Holding Company
Financial Highlights
(amounts in thousands)
(unaudited)
| Three Months Ended | Six Months Ended | |||||||||||||||||||
| 6/30/2013 | 3/31/2013 | 6/30/2012 | 6/30/2013 | 6/30/2012 | ||||||||||||||||
| Period-end Balance Sheet |
||||||||||||||||||||
| Commercial non-real estate loans |
$ | 4,653,342 | $ | 4,425,621 | $ | 3,890,489 | $ | 4,653,342 | $ | 3,890,489 | ||||||||||
| Construction and land development loans |
966,499 | 992,820 | 1,167,496 | 966,499 | 1,167,496 | |||||||||||||||
| Commercial real estate loans |
2,872,254 | 2,873,403 | 2,830,530 | 2,872,254 | 2,830,530 | |||||||||||||||
| Residential mortgage loans |
1,616,093 | 1,587,519 | 1,519,711 | 1,616,093 | 1,519,711 | |||||||||||||||
| Consumer loans |
1,573,309 | 1,603,399 | 1,669,920 | 1,573,309 | 1,669,920 | |||||||||||||||
|
|
|
|
|
|
|
|
|
|
|
|||||||||||
| Total loans |
11,681,497 | 11,482,762 | 11,078,146 | 11,681,497 | 11,078,146 | |||||||||||||||
|
|
|
|
|
|
|
|
|
|
|
|||||||||||
| Loans held for sale |
20,233 | 34,813 | 44,918 | 20,233 | 44,918 | |||||||||||||||
| Securities |
4,303,918 | 4,662,279 | 4,320,457 | 4,303,918 | 4,320,457 | |||||||||||||||
| Short-term investments |
442,917 | 475,677 | 650,470 | 442,917 | 650,470 | |||||||||||||||
|
|
|
|
|
|
|
|
|
|
|
|||||||||||
| Earning assets |
16,448,565 | 16,655,531 | 16,093,991 | 16,448,565 | 16,093,991 | |||||||||||||||
|
|
|
|
|
|
|
|
|
|
|
|||||||||||
| Allowance for loan losses |
(137,969 | ) | (137,777 | ) | (140,768 | ) | (137,969 | ) | (140,768 | ) | ||||||||||
| Other assets |
2,623,705 | 2,546,369 | 2,825,484 | 2,623,705 | 2,825,484 | |||||||||||||||
|
|
|
|
|
|
|
|
|
|
|
|||||||||||
| Total assets |
$ | 18,934,301 | $ | 19,064,123 | $ | 18,778,707 | $ | 18,934,301 | $ | 18,778,707 | ||||||||||
|
|
|
|
|
|
|
|
|
|
|
|||||||||||
| Noninterest bearing deposits |
$ | 5,340,177 | $ | 5,418,463 | $ | 5,040,484 | $ | 5,340,177 | $ | 5,040,484 | ||||||||||
| Interest bearing transaction and savings deposits |
5,965,372 | 6,017,735 | 5,876,843 | 5,965,372 | 5,876,843 | |||||||||||||||
| Interest bearing public fund deposits |
1,410,866 | 1,528,790 | 1,479,378 | 1,410,866 | 1,479,378 | |||||||||||||||
| Time deposits |
2,439,523 | 2,288,363 | 2,534,115 | 2,439,523 | 2,534,115 | |||||||||||||||
|
|
|
|
|
|
|
|
|
|
|
|||||||||||
| Total interest bearing deposits |
9,815,761 | 9,834,888 | 9,890,336 | 9,815,761 | 9,890,336 | |||||||||||||||
|
|
|
|
|
|
|
|
|
|
|
|||||||||||
| Total deposits |
15,155,938 | 15,253,351 | 14,930,820 | 15,155,938 | 14,930,820 | |||||||||||||||
| Other borrowed funds |
1,213,229 | 1,116,457 | 1,193,021 | 1,213,229 | 1,193,021 | |||||||||||||||
| Other liabilities |
219,794 | 217,215 | 255,504 | 219,794 | 255,504 | |||||||||||||||
| Common shareholders’ equity |
2,345,340 | 2,477,100 | 2,399,362 | 2,345,340 | 2,399,362 | |||||||||||||||
|
|
|
|
|
|
|
|
|
|
|
|||||||||||
| Total liabilities & common equity |
$ | 18,934,301 | $ | 19,064,123 | $ | 18,778,707 | $ | 18,934,301 | $ | 18,778,707 | ||||||||||
|
|
|
|
|
|
|
|
|
|
|
|||||||||||
| Capital Ratios |
||||||||||||||||||||
| Common shareholders’ equity |
$ | 2,345,340 | $ | 2,477,100 | $ | 2,399,362 | $ | 2,345,340 | $ | 2,399,362 | ||||||||||
| Tier 1 capital (f) |
1,622,713 | 1,700,115 | 1,581,101 | 1,622,713 | 1,581,101 | |||||||||||||||
| Tangible common equity ratio |
8.52 | % | 9.14 | % | 8.72 | % | 8.52 | % | 8.72 | % | ||||||||||
| Common equity (period-end) as a percent of total assets (period-end) |
12.39 | % | 12.99 | % | 12.78 | % | 12.39 | % | 12.78 | % | ||||||||||
| Leverage (Tier 1) ratio (f) |
8.91 | % | 9.28 | % | 8.62 | % | 8.91 | % | 8.62 | % | ||||||||||
| Tier 1 risk-based capital ratio (f) |
12.15 | % | 12.85 | % | 12.20 | % | 12.15 | % | 12.20 | % | ||||||||||
| Total risk-based capital ratio (f) |
13.63 | % | 14.49 | % | 14.23 | % | 13.63 | % | 14.23 | % | ||||||||||
| (f) | estimated for most recent period-end |
- 10 -
Hancock Holding Company
Financial Highlights
(amounts in thousands)
(unaudited)
| Three Months Ended | Six Months Ended | |||||||||||||||||||
| 6/30/2013 | 3/31/2013 | 6/30/2012 | 6/30/2013 | 6/30/2012 | ||||||||||||||||
| Average Balance Sheet |
||||||||||||||||||||
| Commercial non-real estate loans |
$ | 4,539,259 | $ | 4,413,558 | $ | 3,872,026 | $ | 4,476,754 | $ | 3,826,584 | ||||||||||
| Construction and land development loans |
984,449 | 975,301 | 1,235,612 | 979,900 | 1,251,362 | |||||||||||||||
| Commercial real estate loans |
2,894,432 | 2,895,549 | 2,839,143 | 2,894,988 | 2,904,271 | |||||||||||||||
| Residential mortgage loans |
1,625,672 | 1,626,629 | 1,548,803 | 1,626,148 | 1,548,945 | |||||||||||||||
| Consumer loans |
1,579,397 | 1,618,891 | 1,644,532 | 1,599,036 | 1,635,334 | |||||||||||||||
|
|
|
|
|
|
|
|
|
|
|
|||||||||||
| Total loans (g) |
11,623,209 | 11,529,928 | 11,140,116 | 11,576,826 | 11,166,496 | |||||||||||||||
|
|
|
|
|
|
|
|
|
|
|
|||||||||||
| Securities (h) |
4,423,441 | 3,929,255 | 4,292,686 | 4,177,713 | 4,243,585 | |||||||||||||||
| Short-term investments |
453,565 | 1,058,519 | 733,489 | 754,371 | 793,166 | |||||||||||||||
|
|
|
|
|
|
|
|
|
|
|
|||||||||||
| Earning assets |
16,500,215 | 16,517,702 | 16,166,291 | 16,508,910 | 16,203,247 | |||||||||||||||
|
|
|
|
|
|
|
|
|
|
|
|||||||||||
| Allowance for loan losses |
(137,815 | ) | (137,110 | ) | (142,991 | ) | (137,465 | ) | (134,031 | ) | ||||||||||
| Other assets |
2,660,432 | 2,772,059 | 2,964,097 | 2,715,938 | 3,021,242 | |||||||||||||||
|
|
|
|
|
|
|
|
|
|
|
|||||||||||
| Total assets |
$ | 19,022,832 | $ | 19,152,651 | $ | 18,987,397 | $ | 19,087,383 | $ | 19,090,458 | ||||||||||
|
|
|
|
|
|
|
|
|
|
|
|||||||||||
| Noninterest bearing deposits |
$ | 5,346,916 | $ | 5,314,648 | $ | 5,149,898 | $ | 5,330,871 | $ | 5,254,701 | ||||||||||
| Interest bearing transaction and savings deposits |
5,965,769 | 5,982,345 | 5,881,673 | 5,974,011 | 5,753,817 | |||||||||||||||
| Interest bearing public fund deposits |
1,483,267 | 1,608,925 | 1,517,743 | 1,545,749 | 1,524,426 | |||||||||||||||
| Time deposits |
2,415,411 | 2,406,772 | 2,604,387 | 2,411,115 | 2,700,161 | |||||||||||||||
|
|
|
|
|
|
|
|
|
|
|
|||||||||||
| Total interest bearing deposits |
9,864,447 | 9,998,042 | 10,003,803 | 9,930,875 | 9,978,404 | |||||||||||||||
|
|
|
|
|
|
|
|
|
|
|
|||||||||||
| Total deposits |
15,211,363 | 15,312,690 | 15,153,701 | 15,261,746 | 15,233,105 | |||||||||||||||
| Other borrowed funds |
1,183,744 | 1,160,110 | 1,212,692 | 1,171,993 | 1,225,271 | |||||||||||||||
| Other liabilities |
222,656 | 231,841 | 233,539 | 227,224 | 250,897 | |||||||||||||||
| Common shareholders’ equity |
2,405,069 | 2,448,010 | 2,387,465 | 2,426,420 | 2,381,185 | |||||||||||||||
|
|
|
|
|
|
|
|
|
|
|
|||||||||||
| Total liabilities & common equity |
$ | 19,022,832 | $ | 19,152,651 | $ | 18,987,397 | $ | 19,087,383 | $ | 19,090,458 | ||||||||||
|
|
|
|
|
|
|
|
|
|
|
|||||||||||
| (g) | Includes loans held for sale |
| (h) | Average securities does not include unrealized holding gains/losses on available for sale securities. |
- 11 -
Hancock Holding Company
Financial Highlights
(amounts in thousands)
(unaudited)
| Supplemental Asset Quality Information (excluding covered assets and acquired loans)(i) |
6/30/2013 | 3/31/2013 | 6/30/2012 | |||||||||
| Non-accrual loans (j) (k) |
$ | 81,613 | $ | 82,194 | $ | 100,067 | ||||||
| Restructured loans (l) |
28,176 | 28,689 | 19,518 | |||||||||
|
|
|
|
|
|
|
|||||||
| Total non-performing loans |
109,789 | 110,883 | 119,585 | |||||||||
| ORE and foreclosed assets (m) |
49,691 | 55,545 | 93,339 | |||||||||
|
|
|
|
|
|
|
|||||||
| Total non-performing assets |
$ | 159,480 | $ | 166,428 | $ | 212,924 | ||||||
|
|
|
|
|
|
|
|||||||
| Non-performing assets as a percent of loans, ORE and foreclosed assets |
1.92 | % | 2.24 | % | 3.61 | % | ||||||
| Accruing loans 90 days past due |
$ | 5,270 | $ | 6,113 | $ | 1,443 | ||||||
| Accruing loans 90 days past due as a percent of loans |
0.06 | % | 0.08 | % | 0.02 | % | ||||||
| Non-performing assets + accruing loans 90 days past due to loans, ORE and foreclosed assets |
1.98 | % | 2.32 | % | 3.63 | % | ||||||
| Allowance for loan losses (n) (o) |
$ | 76,399 | $ | 75,466 | $ | 81,376 | ||||||
| Allowance for loan losses as a percent of period-end loans |
0.93 | % | 1.02 | % | 1.40 | % | ||||||
| Allowance for loan losses to nonperforming loans + accruing loans 90 days past due |
66.40 | % | 64.50 | % | 67.24 | % | ||||||
| (i) | Covered and acquired credit impaired loans are considered performing due to the application of the accretion method under acquisition accounting. Acquired loans are recorded at fair value with no allowance brought forward in accordance with acquisition accounting. Certain acquired loans and foreclosed assets are also covered under FDIC loss sharing agreements, which provide considerable protection against credit risk. Due to the protection of loss sharing agreements and impact of acquisition accounting, management has excluded acquired loans and covered assets from this table to provide for improved comparability to prior periods and better perspective into asset quality trends. |
| (j) | Excludes acquired covered loans not accounted for under the accretion method of $4,221, $4,221, and $6,174. |
| (k) | Excludes non-covered acquired performing loans at fair value of $24,682, $28,874, and $7,143. |
| (l) | Excludes non-covered acquired performing loans at fair value of $5,565, $5,701, and $0. |
| (m) | Excludes covered foreclosed assets of $22,544, $24,082, and $44,779. |
| (n) | Excludes allowance for loan losses recorded on covered acquired loans of $61,200, $61,868, and $59,392. |
| (o) | Excludes allowance for loan losses recorded on non-covered acquired-performing loans of $370, $443 and $0. |
| 3/31/2013 | ||||||||||||||||
| Originated Loans |
Acquired Loans (p) |
Covered Loans (q) |
Total | |||||||||||||
| Commercial non-real estate loans |
$ | 2,901,190 | $ | 1,500,137 | $ | 24,294 | $ | 4,425,621 | ||||||||
| Construction and land development loans |
697,989 | 269,727 | 25,104 | 992,820 | ||||||||||||
| Commercial real estate loans |
1,562,383 | 1,226,854 | 84,166 | 2,873,403 | ||||||||||||
| Residential mortgage loans |
886,232 | 449,500 | 251,787 | 1,587,519 | ||||||||||||
| Consumer loans |
1,331,142 | 180,632 | 91,625 | 1,603,399 | ||||||||||||
|
|
|
|
|
|
|
|
|
|||||||||
| Total loans |
$ | 7,378,936 | $ | 3,626,850 | $ | 476,976 | $ | 11,482,762 | ||||||||
|
|
|
|
|
|
|
|
|
|||||||||
| Change in loan balance from previous quarter |
$ | 271,715 | ($ | 327,908 | ) | ($ | 38,847 | ) | ($ | 95,040 | ) | |||||
|
|
|
|
|
|
|
|
|
|||||||||
| 6/30/2013 | ||||||||||||||||
| Originated Loans |
Acquired Loans (p) |
Covered Loans (q) |
Total | |||||||||||||
| Commercial non-real estate loans |
$ | 3,564,008 | $ | 1,062,916 | $ | 26,418 | $ | 4,653,342 | ||||||||
| Construction and land development loans |
722,649 | 217,611 | 26,239 | 966,499 | ||||||||||||
| Commercial real estate loans |
1,638,409 | 1,161,500 | 72,345 | 2,872,254 | ||||||||||||
| Residential mortgage loans |
988,595 | 392,282 | 235,216 | 1,616,093 | ||||||||||||
| Consumer loans |
1,340,094 | 162,722 | 70,493 | 1,573,309 | ||||||||||||
|
|
|
|
|
|
|
|
|
|||||||||
| Total loans |
$ | 8,253,755 | $ | 2,997,031 | $ | 430,711 | $ | 11,681,497 | ||||||||
|
|
|
|
|
|
|
|
|
|||||||||
| Change in loan balance from previous quarter |
$ | 874,819 | ($ | 629,819 | ) | ($ | 46,265 | ) | $ | 198,735 | ||||||
|
|
|
|
|
|
|
|
|
|||||||||
| (p) | Loans which have been acquired and no allowance brought forward in accordance with acquisition accounting. |
| (q) | Loans which are covered by loss sharing agreements with the FDIC providing considerable protection against credit risk. |
- 12 -
Hancock Holding Company
Average Balance and Net Interest Margin Summary
(amounts in thousands)
(unaudited)
| Three Months Ended | ||||||||||||||||||||||||||||||||||||
| 6/30/2013 | 3/31/2013 | 6/30/2012 | ||||||||||||||||||||||||||||||||||
| Interest | Volume | Rate | Interest | Volume | Rate | Interest | Volume | Rate | ||||||||||||||||||||||||||||
| Average Earning Assets |
||||||||||||||||||||||||||||||||||||
| Commercial & real estate loans (TE) |
$ | 103,344 | $ | 8,418,140 | 4.92 | % | $ | 113,296 | $ | 8,284,408 | 5.54 | % | $ | 108,777 | $ | 7,946,781 | 5.50 | % | ||||||||||||||||||
| Residential mortgage loans |
27,540 | 1,625,672 | 6.78 | % | 25,680 | 1,626,629 | 6.31 | % | 28,709 | 1,548,803 | 7.41 | % | ||||||||||||||||||||||||
| Consumer loans |
26,534 | 1,579,397 | 6.74 | % | 26,501 | 1,618,891 | 6.64 | % | 28,372 | 1,644,532 | 6.92 | % | ||||||||||||||||||||||||
| Loan fees & late charges |
1,236 | — | 0.00 | % | 568 | — | 0.00 | % | 1,548 | — | 0.00 | % | ||||||||||||||||||||||||
|
|
|
|
|
|
|
|
|
|
|
|
|
|
|
|
|
|
|
|||||||||||||||||||
| Total loans (TE) |
158,654 | 11,623,209 | 5.47 | % | 166,045 | 11,529,928 | 5.83 | % | 167,406 | 11,140,116 | 6.04 | % | ||||||||||||||||||||||||
| US Treasury and government agency securities |
1 | 150 | 2.67 | % | 17 | 5,579 | 1.24 | % | 738 | 142,149 | 2.09 | % | ||||||||||||||||||||||||
| CMOs |
7,454 | 1,589,017 | 1.88 | % | 7,091 | 1,534,840 | 1.85 | % | 7,983 | 1,578,438 | 2.02 | % | ||||||||||||||||||||||||
| Mortgage backed securities |
13,217 | 2,593,270 | 2.04 | % | 11,605 | 2,163,544 | 2.15 | % | 13,921 | 2,296,126 | 2.43 | % | ||||||||||||||||||||||||
| Municipals (TE) |
2,630 | 232,987 | 4.51 | % | 2,554 | 216,974 | 4.71 | % | 2,741 | 266,661 | 4.11 | % | ||||||||||||||||||||||||
| Other securities |
56 | 8,017 | 2.79 | % | 41 | 8,318 | 1.96 | % | 65 | 9,312 | 2.79 | % | ||||||||||||||||||||||||
|
|
|
|
|
|
|
|
|
|
|
|
|
|
|
|
|
|
|
|||||||||||||||||||
| Total securities (TE) (r) |
23,358 | 4,423,441 | 2.11 | % | 21,308 | 3,929,255 | 2.17 | % | 25,448 | 4,292,686 | 2.37 | % | ||||||||||||||||||||||||
| Total short-term investments |
280 | 453,565 | 0.25 | % | 645 | 1,058,519 | 0.25 | % | 469 | 733,489 | 0.26 | % | ||||||||||||||||||||||||
| Average earning assets yield (TE) |
$ | 182,292 | $ | 16,500,215 | 4.42 | % | $ | 187,998 | $ | 16,517,702 | 4.60 | % | $ | 193,323 | $ | 16,166,291 | 4.80 | % | ||||||||||||||||||
| Interest-bearing Liabilities |
||||||||||||||||||||||||||||||||||||
| Interest-bearing transaction and savings deposits |
$ | 1,542 | $ | 5,965,769 | 0.10 | % | $ | 1,659 | $ | 5,982,345 | 0.11 | % | $ | 1,764 | $ | 5,881,673 | 0.12 | % | ||||||||||||||||||
| Time deposits |
3,795 | 2,415,411 | 0.63 | % | 4,086 | 2,406,772 | 0.69 | % | 5,018 | 2,604,387 | 0.77 | % | ||||||||||||||||||||||||
| Public funds |
852 | 1,483,267 | 0.23 | % | 1,000 | 1,608,925 | 0.25 | % | 1,090 | 1,517,743 | 0.29 | % | ||||||||||||||||||||||||
|
|
|
|
|
|
|
|
|
|
|
|
|
|
|
|
|
|
|
|||||||||||||||||||
| Total interest bearing deposits |
6,189 | 9,864,447 | 0.25 | % | 6,745 | 9,998,042 | 0.27 | % | 7,872 | 10,003,803 | 0.32 | % | ||||||||||||||||||||||||
| Total borrowings |
4,281 | 1,183,744 | 1.45 | % | 4,512 | 1,160,110 | 1.58 | % | 5,158 | 1,212,692 | 1.71 | % | ||||||||||||||||||||||||
| Total interest bearing liabilities cost |
$ | 10,470 | $ | 11,048,191 | 0.38 | % | $ | 11,257 | $ | 11,158,152 | 0.41 | % | $ | 13,030 | $ | 11,216,495 | 0.47 | % | ||||||||||||||||||
| Net interest-free funding sources |
5,452,024 | 5,359,550 | 4,949,796 | |||||||||||||||||||||||||||||||||
| Total Cost of Funds |
$ | 10,470 | $ | 16,500,215 | 0.25 | % | $ | 11,257 | $ | 16,517,702 | 0.28 | % | $ | 13,030 | $ | 16,166,291 | 0.32 | % | ||||||||||||||||||
| Net Interest Spread (TE) |
$ | 171,822 | 4.04 | % | $ | 176,741 | 4.19 | % | $ | 180,293 | 4.33 | % | ||||||||||||||||||||||||
| Net Interest Margin (TE) |
$ | 171,822 | $ | 16,500,215 | 4.17 | % | $ | 176,741 | $ | 16,517,702 | 4.32 | % | $ | 180,293 | $ | 16,166,291 | 4.48 | % | ||||||||||||||||||
| (r) | Average securities does not include unrealized holding gains/losses on available for sale securities. |
- 13 -
Hancock Holding Company
Average Balance and Net Interest Margin Summary
(amounts in thousands)
(unaudited)
| Six Months Ended | ||||||||||||||||||||||||
| 6/30/2013 | 6/30/2012 | |||||||||||||||||||||||
| Interest | Volume | Rate | Interest | Volume | Rate | |||||||||||||||||||
| Average Earning Assets |
||||||||||||||||||||||||
| Commercial & real estate loans (TE) |
$ | 216,640 | $ | 8,351,642 | 5.23 | % | $ | 221,285 | $ | 7,982,217 | 5.57 | % | ||||||||||||
| Residential mortgage loans |
53,220 | 1,626,148 | 6.55 | % | 55,132 | 1,548,945 | 7.12 | % | ||||||||||||||||
| Consumer loans |
53,035 | 1,599,036 | 6.69 | % | 56,934 | 1,635,334 | 6.98 | % | ||||||||||||||||
| Loan fees & late charges |
1,804 | — | 0.00 | % | 2,347 | — | 0.00 | % | ||||||||||||||||
|
|
|
|
|
|
|
|
|
|
|
|
|
|||||||||||||
| Total loans (TE) |
324,699 | 11,576,826 | 5.65 | % | 335,698 | 11,166,496 | 6.04 | % | ||||||||||||||||
| US Treasury and government agency securities |
18 | 2,849 | 1.27 | % | 2,001 | 180,793 | 2.23 | % | ||||||||||||||||
| CMOs |
14,545 | 1,562,078 | 1.86 | % | 14,766 | 1,469,785 | 2.01 | % | ||||||||||||||||
| Mortgage backed securities |
24,822 | 2,379,595 | 2.09 | % | 28,327 | 2,308,915 | 2.45 | % | ||||||||||||||||
| Municipals (TE) |
5,184 | 225,025 | 4.61 | % | 6,009 | 275,387 | 4.36 | % | ||||||||||||||||
| Other securities |
97 | 8,166 | 2.37 | % | 191 | 8,705 | 4.38 | % | ||||||||||||||||
|
|
|
|
|
|
|
|
|
|
|
|
|
|||||||||||||
| Total securities (TE) (s) |
44,666 | 4,177,713 | 2.14 | % | 51,294 | 4,243,585 | 2.42 | % | ||||||||||||||||
| Total short-term investments |
925 | 754,371 | 0.25 | % | 996 | 793,166 | 0.25 | % | ||||||||||||||||
| Average earning assets yield (TE) |
$ | 370,290 | $ | 16,508,910 | 4.51 | % | $ | 387,988 | $ | 16,203,247 | 4.80 | % | ||||||||||||
| Interest-Bearing Liabilities |
||||||||||||||||||||||||
| Interest-bearing transaction deposits |
$ | 3,201 | $ | 5,974,011 | 0.11 | % | $ | 3,946 | $ | 5,753,817 | 0.14 | % | ||||||||||||
| Time deposits |
7,881 | 2,411,115 | 0.66 | % | 11,906 | 2,700,161 | 0.88 | % | ||||||||||||||||
| Public funds |
1,852 | 1,545,749 | 0.24 | % | 2,283 | 1,524,426 | 0.30 | % | ||||||||||||||||
|
|
|
|
|
|
|
|
|
|
|
|
|
|||||||||||||
| Total interest bearing deposits |
12,934 | 9,930,875 | 0.26 | % | 18,135 | 9,978,404 | 0.36 | % | ||||||||||||||||
| Total borrowings |
8,793 | 1,171,993 | 1.51 | % | 10,323 | 1,225,271 | 1.69 | % | ||||||||||||||||
| Total interest bearing liabilities cost |
$ | 21,727 | $ | 11,102,868 | 0.39 | % | $ | 28,458 | $ | 11,203,675 | 0.51 | % | ||||||||||||
| Net interest-free funding sources |
5,406,042 | 4,999,572 | ||||||||||||||||||||||
| Total Cost of Funds |
$ | 21,727 | $ | 16,508,910 | 0.27 | % | $ | 28,458 | $ | 16,203,247 | 0.35 | % | ||||||||||||
| Net Interest Spread (TE) |
$ | 348,563 | 4.12 | % | $ | 359,530 | 4.30 | % | ||||||||||||||||
| Net Interest Margin (TE) |
$ | 348,563 | $ | 16,508,910 | 4.24 | % | $ | 359,530 | $ | 16,203,247 | 4.45 | % | ||||||||||||
| (s) | Average securities does not include unrealized holding gains/losses on available for sale securities. |
- 14 -
 Second Quarter 2013
Financial Results
July 25, 2013
Second Quarter 2013
Financial Results
July 25, 2013 |
 Forward-Looking
Statements
Forward-Looking
Statements
Certain of the statements or information included in this presentation
may constitute forward-looking statements.
Forward-looking statements include projections of revenue, costs, results of operations or
financial condition or statements regarding future market conditions or
our potential plans and strategies for the future.
Forward-looking statements that we may make include, but may not be limited to, comments
with respect to future levels of economic activity in our
markets, loan growth, deposit trends, credit quality
trends, future sales of nonperforming assets, net interest margin
trends, future expense levels and the ability to achieve
reductions in non-interest expense or other cost savings, projected tax rates, future
profitability, improvements in expense to revenue (efficiency) ratio,
purchase accounting impacts such as accretion levels, the impact
of the branch rationalization process, and the financial impact of regulatory
requirements. Hancock’s ability to accurately project
results or predict the effects of future plans or strategies is
inherently limited. We believe that the expectations
reflected or implied by any forward-looking statements are based on
reasonable
assumptions,
but
actual
results
and
performance
could
differ
materially
from
those
set
forth
in
the forward-looking statements. Factors that could cause
actual results or outcomes to differ from those expressed in the
Company's forward-looking statements include, but are not limited to, those outlined in
Hancock's SEC filings, including the “Risk Factors”
section of the Company’s 10-K for the year ended
December 31, 2012 and most recent form 10-Q.
Hancock undertakes no obligation to update or revise any
forward-looking statements, and you are cautioned not to
place undue reliance on such forward-looking statements. 2
|
 •
Net income $47 million or
$.55 per diluted common share
•
ROA 0.99%
•
ROTCE 11.74%
•
Net loan growth (excluding covered loans),
up 9% linked-quarter annualized
•
Core net interest income (TE) and
NIM remained relatively stable
•
Growth in fee income
•
Improved core revenue
•
Improved asset quality metrics
•
Initiated 5% common stock
buyback through an accelerated
share repurchase (ASR)
Second Quarter Highlights
Second Quarter Highlights
3
* Core is defined as reported results less purchase accounting
adjustments. See table on slide 11. ** Noninterest
expense
as
a
percent
of
total
revenue
(TE)
before
amortization
of
purchased
intangibles,
securities
transactions
and
merger
expenses.
($s in millions; except per share data)
2Q13
1Q13
change
Net Income
$46.9
$48.6
-4%
Earnings Per Share (diluted)
$.55
$.56
-2%
Return on Assets
0.99%
1.03%
-4bps
Return on Tangible Common Equity
11.74%
12.04%
-30bps
Net Interest Margin
4.17%
4.32%
-15bps
Net Interest Margin (core)*
3.38%
3.41%
-3bps
Total Revenue (TE) (core)*
$203.0
$199.8
+2%
Net Charge-offs non-covered
0.24%
0.23%
+1bp
Tangible Common Equity
8.52%
9.14%
-62bps
Efficiency Ratio**
65.68%
64.17%
+151bps |
 Growth Continues In The
Commercial (C&I) Portfolio
Commercial (C&I) Portfolio
•
Total loans $11.7 Billion
An increase of almost $200 million, or 1.7% linked-quarter
An increase of over $600 million, or 5%, from a year ago
•
Excluding the FDIC covered loans, total loans were up
$245 million, or 2.2%, linked-quarter and $760 million, or
7%, from a year earlier
•
Increase mainly related to the commercial and industrial
(C&I) portfolio, up $228 million linked-quarter
•
Moved over $600 million, or 50%, of non-covered
problem loans out of the company over the past 2 years
(see slide 7)
•
New loan activity in all markets across the footprint
contributed to the solid loan growth this quarter
Period-end balances. As of June 30, 2013
4 |
 Whitney Portfolio Continues
Solid Performance
Solid Performance
•
Loan mark on the acquired-performing portfolio accreted into
earnings over the life of the portfolio
•
Credit-impaired loan mark available for charge-offs; if not
needed for charge-offs then accreted into income
•
Quarterly reviews of accretion levels and portfolio performance will
impact reported margin 5
As of June 30, 2013
$s in millions
Credit-
Impaired
Performing
Total
Whitney loan mark at acquisition
(as adjusted in 4Q11)
$284
$187
$471
Acquired portfolio loan balances at acquisition
$818
$6,101
$6,919
Discount at acquisition
34.7%
3.1%
6.8%
Remaining Whitney loan mark at 6/30/13
$170
$53
$223
Remaining acquired portfolio loan balances at
6/30/13
$265
$2,958
$3,223
Acquired loan charge-offs from acquisition thru
6/30/13
$27
$6
$33
Discount at 6/30/13
64.1%
1.8%
6.9% |
 Peoples First Loan Mark Used
For Charge-Offs
For Charge-Offs
•
FDIC covered loan portfolio
•
Entire loan mark available for charge-offs; if not needed for
charge-offs then accreted into income
•
Quarterly reviews of accretion levels and portfolio performance will
impact reported margin •
FDIC loss share receivable totaled $152 million at June 30, 2013
Balance reflects the total amount expected to be collected from the
FDIC 6
As of June 30, 2013
$s in millions
Credit Impaired
Peoples First loan mark at acquisition (12/2009)
$509
Charge-offs from acquisition thru 6/30/13
$397
Accretion since acquisition date
$75
Remaining loan mark at 6/30/13
$79
Impairment reserve at 6/30/13
$61
Remaining acquired portfolio loan balances at 6/30/13
$510
Discount & allowance at 6/30/13
27.5% |
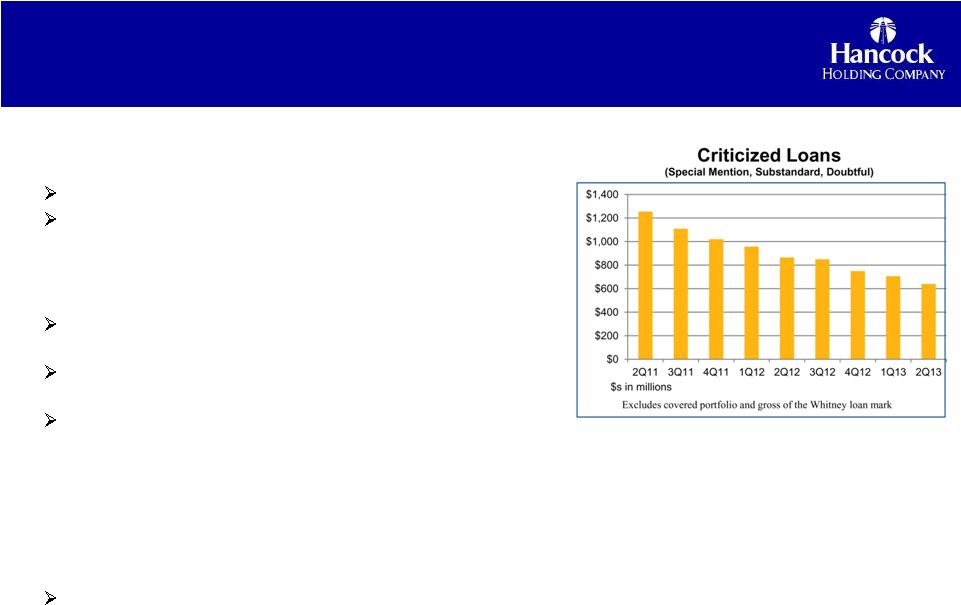 •
Nonperforming assets totaled $216 million, a
decrease of $13 million linked-quarter
Nonperforming loans down $5.4 million
ORE and foreclosed assets down $7.4 million
•
Provision for loan losses was $8.3 million, compared
to $9.6 million in 1Q13
2Q13 includes $7.9 million for the non-covered loan
portfolio, compared to $3.0 million in 1Q13
2Q13 includes $0.4 million impact from FDIC-covered loan
portfolio, compared to $6.6 million in 1Q13
Linked-quarter increase in non-covered provision related to
the volume of newly originated loans in the second quarter
•
Non-covered net charge-offs totaled $7.0 million, or
0.24%, compared to $6.6 million or 0.23% in 1Q13
•
Allowance for loan losses/loans 1.18%
Excluding the impact of the Whitney acquired loans and FDIC
covered loans, allowance for loan losses was 0.93%
Improved Asset Quality Metrics
Improved Asset Quality Metrics
7
As of June 30, 2013 |
 Securities Portfolio Funded Loan
Growth in Second Quarter
Securities Portfolio Funded Loan
Growth in Second Quarter
8
•
Portfolio totaled $4.3 billion at June 30,
2013, down $358 million linked-quarter
•
Yield 2.11% for 2Q13
•
Average maturity 3.35 years
•
Decline during 2Q13 funded loan growth
and deposit runoff
Better earning asset mix
•
Low risk, government guaranteed
•
Mainly mortgage-backed securities and
CMOs
•
60% AFS, 40% HTM
•
Unrealized loss (net) $24.8 million on AFS
•
Duration 3.87, up .80 linked-quarter
Extends to 4.3 in +100bps shift in the yield curve
Extends to 4.6 in +200bps shift in the yield curve
Period-end balances. As of June 30, 2013
|
 Strong Core Deposit
Funding
Funding
•
Total deposits $15.2 billion, down
approximately $100 million, or less than
1%, linked-quarter
•
Overall decrease mainly related to
seasonal trends in public fund deposits
•
Funding mix remained strong
Noninterest-bearing demand deposits (DDA)
comprised 35% of total period-end deposits
No and low cost deposits comprised 75% of total
period-end deposits
Cost of funds declined 3bps to 25bps
9
Period-end balances. As of June 30, 2013
|
 Net Interest Margin Impacted By
Earning Asset Repricing, Accretion
Earning Asset Repricing, Accretion
•
Reported net interest margin (NIM) 4.17%, down 15 bps
linked-quarter Net
purchase
accounting
adjustments
impact
reported
net
interest
income
and
NIM
Approximately 11 bps of reported NIM compression due to lower
linked-quarter impact from excess cash recoveries
•
Core NIM compressed 3 bps
Repricing of earning assets led to core NIM compression
10
6.04%
5.95%
5.95%
5.83%
5.47%
4.86%
4.65%
4.55%
4.40%
4.23%
2.37%
2.30%
2.21%
2.17%
2.11%
0.32%
0.30%
0.28%
0.28%
0.25%
Loan
Yield
-
reported
Loan
Yield
-
core*
Securities
Yield
-
reported
Cost
of
Funds
-
reported
2Q12
3Q12
4Q12
1Q13
2Q13
2Q12
3Q12
4Q12
1Q13
2Q13
NIM -
reported
NIM -
core
Core NIM = reported net interest income (TE) excluding total net
purchase accounting adjustments, annualized, as a percent of
average earning assets. (See slide 11)
As of June 30, 2013
3.80%
3.75%
3.61%
3.41%
3.38%
4.48%
4.54%
4.48%
4.32%
4.17% |
 Purchase Accounting Adjustments
Core NII & NIM Reconciliation
11
($s in millions)
2Q13
1Q13
4Q12
3Q12
2Q12
Net
Interest
Income
(TE)
–
reported
(NII)
$171.8
$176.7
$182.8
$180.1
$180.3
Whitney expected loan accretion (performing)
12.8
13.7
17.6
17.4
14.3
Whitney expected loan accretion (credit impaired)
15.9
14.6
11.5
7.9
7.3
Peoples First expected loan accretion
4.1
4.5
7.4
11.7
11.2
Excess cash recoveries*
3.1
7.5
4.0
---
---
Total Loan Accretion
$35.9
$40.3
$40.5
$37.0
$32.8
Whitney premium bond amortization
(3.4)
(3.5)
(5.4)
(5.8)
(6.3)
Whitney and Peoples First CD accretion
.2
.3
.3
.4
.9
Total Net Purchase Accounting
Adjustments (PAAs) impacting NII
$32.7
$37.1
$35.5
$31.5
$27.4
Net
Interest
Income
(TE)
–
core
(Reported NII less net PAAs)
$139.0
$139.7
$147.3
$148.6
$152.9
Average Earning Assets
$16,500
$16,518
$16,246
$15,830
$16,166
Net
Interest
Margin
–
reported
4.17%
4.32%
4.48%
4.54%
4.48%
Net Purchase Accounting Adjustments (%)
.79%
.91%
.87%
.79%
.68%
Net
Interest
Margin
-
core
3.38%
3.41%
3.61%
3.75%
3.80%
* Excess cash recoveries include cash collected on certain zero
carrying value acquired loan pools. |
 Efficiency Improvements Will Offset Loss
of Purchase Accounting Adjustments
of Purchase Accounting Adjustments
•
Net
purchase
accounting
adjustments
will
be
‘sizeable’
part
of
earnings
for
the
next
few
years
•
Revenue includes loan accretion, securities amortization, CD
accretion •
Amortization of intangibles mainly related to the Whitney
acquisition 12
$s in millions
Impact of Purchase Accounting Adjustments and Efficiency Initiative
2012-2015 (2013-2015 projections will be updated
quarterly; subject to volatility) Revenue impact
Amortization of intangibles
Pre-tax
impact
PAA
Pre-tax
impact
PAA
Efficiency initiative pre-tax impact |
 Linked-Quarter Noninterest Income Growth
Reflects Increased Business, Seasonality
Reflects Increased Business, Seasonality
•
Noninterest income totaled $64 million, up $3.7
million linked-quarter
•
Service charges on deposits totaled $19.9 million,
up $0.8 million from 1Q13
The linked-quarter increase partly reflects the impact of
two additional business days in the second quarter
•
Fees from secondary mortgage operations totaled
$4.1 million, down $0.2 million linked-quarter
•
Linked-quarter changes in trust, insurance, and
investment and annuity fees reflect some
seasonality in these lines of business and impact
of changes in stock market values
13
As of June 30, 2013 |
 Increase in Noninterest
Expense Related to ORE
Expense Related to ORE
•
Noninterest expense totaled $162 million, up
$2.6 million, or 2%, from 1Q13
Amortization of intangibles totaled $7.4 million
Increase mainly related to other real estate (ORE)
expense
14
As of June 30, 2013
•
Personnel expense, the largest component of
total noninterest expense, totaled $87.6 million,
a decrease of $0.3 million linked-quarter
•
ORE expense totaled $3.4 million in 2Q13, up
from $0.7 million in 1Q13
•
Other operating expense (excluding ORE
expense) totaled $46.5 million, up $0.8 million
from 1Q13 |
 Efficiency & Process Improvement
Initiative On Track
Initiative On Track
15
$s in millions
1Q13 noninterest
expense
$160
Annualized 1Q13
noninterest expense
$640
1Q14 noninterest
expense projection
$153
4Q14 noninterest
expense projection
$147
•
As part of the Company’s updated long-term Strategic Plan,
announced an efficiency and process improvement initiative
•
Most effective way of operating the consolidated organization
Short-term efficiency improvements
Long-term process improvement
•
Committed to reducing non-interest expense in future years by
$50 million compared to annualized 2013 expense
•
Designed to reduce overall annual expense levels over the
next 7 quarters
50% attainment by 1Q14
100% attainment by 4Q14
•
Will include reviews of front and back office areas as well as branch
network and current business models
•
Longer-term sustainable efficiency ratio target of 57%-59%
set for 2016
•
Expect to incur one-time costs in implementing the initiative
70%
65%
60%
55%
50%
Midpoint Long-Term Efficiency Ratio Target 57% -
59%
3Q11
4Q11
1Q12
2Q12
3Q12
4Q12
1Q13
2Q13
Efficiency Ratio
The
efficiency
ratio
is
defined
as
noninterest
expense
as
a
percent
of
total
revenue
(TE)
before
amortization
of
purchased
intangibles, sub debt redemption costs, securities transactions and
merger expenses. |
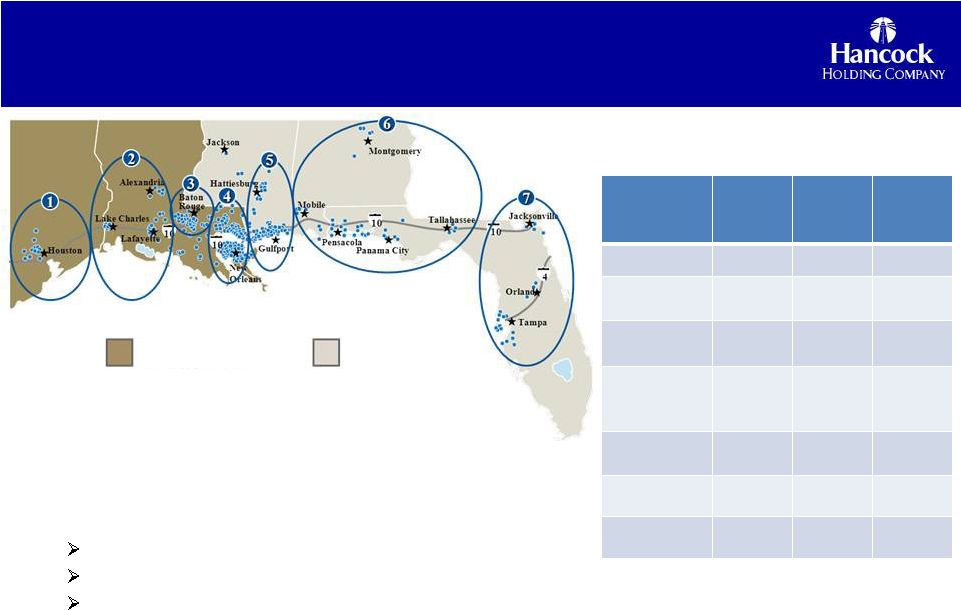 •
Reviewed each market for Business and/or Retail
line of business focus
•
Expect to close or sell approximately 40 branches
across the 5-state footprint
•
Expect one-time costs will be lower than previous
guidance and will be booked in 3Q13
1Q14 Expense Target Mainly Achieved Through
Previously Announced Branch Closures
16
Region
# of
Branches
# of
Branches
Closing
# of
Branches
Sold
1. Houston
14
1
7
2. SW Louisiana
20
--
3
3. Greater Baton
Rouge
33
3
--
4. Greater New
Orleans/Houma/
Thibodaux
66
2
--
5. South
Mississippi
43
1
--
6. AL/West FL
(panhandle)
43
13
--
7. East Central
Florida
23
10
--
* Information regarding branch sales included in press release issued
on July 22, 2013 Whitney Bank
Hancock Bank
Majority will close on August 30, 2013
10 are expected to be sold by year-end 2013*
Remainder to close by year-end 2013 |
 •
TCE ratio 8.52% at June 30, 2013
•
Announced stock buyback of up to 5% of
outstanding common stock
•
Other comprehensive income (OCI)
decreased $47 million, or 26 bps, in 2Q13
•
Continue reviewing opportunities to deploy
excess capital in the best interest of the
Company and its shareholders
•
Projected capital levels exceed Basel III
fully implemented, required guidelines
Solid Capital Levels
Solid Capital Levels
17
As of June 30, 2013
Executed an accelerated share repurchase on May 9, 2013
Total transaction amount of $115 million
Received approximately 2.8 million shares
Impacted TCE ratio by 63 bps
Based on current stock prices, the remaining shares of
approximately 1 million will be received no later than 2Q14
10.00%
9.00%
8.00%
7.00%
1Q12
2Q12
3Q12
4Q12
1Q13
2Q13
TCE
Minimum Target
Tangible Common Equity (TCE) Ratio |
 18
Appendix
Appendix |
      Non-GAAP
Reconciliation
Non-GAAP
Non-GAAP
Reconciliation
Reconciliation
19
(a) Net income less tax-effected merger costs, and securities gains/losses. Management
believes that this is a useful financial measure because it enables investors to assess ongoing operations.
Hancock Holding Company
Financial Highlights
(amounts in thousands)
(unaudited)
6/30/2013
3/31/2013
6/30/2012
6/30/2013
6/30/2012
Income Statement
Interest income
$179,649
$185,272
$190,489
$364,921
$382,205
Interest income (TE)
182,292
187,998
193,323
370,290
387,988
Interest expense
10,470
11,257
13,030
21,727
28,458
Net interest income (TE)
171,822
176,741
180,293
348,563
359,530
Provision for loan losses
8,257
9,578
8,025
17,835
18,040
Noninterest income excluding
securities transactions
63,897
60,187
63,552
124,084
125,046
Securities transactions gains/(losses)
-
-
-
-
12
Noninterest expense
162,250
159,602
179,972
321,852
385,435
Income before income taxes
62,569
65,022
53,014
127,591
75,330
Income tax expense
15,707
16,446
13,710
32,153
17,531
Net income
$46,862
$48,576
$39,304
$95,438
$57,799
Merger-related expenses
-
-
11,913
-
45,827
Securities transactions gains/(losses)
-
-
-
-
12
Taxes on adjustments
-
-
4,170
-
16,035
Operating income (a)
$46,862
$48,576
$47,047
$95,438
$87,579
Three Months Ended
Six Months Ended |
 Second Quarter 2013
Financial Results
July 25, 2013
Second Quarter 2013
Financial Results
July 25, 2013 |