Attached files
| file | filename |
|---|---|
| 8-K - FORM 8-K - Altra Industrial Motion Corp. | d569876d8k.htm |
| EX-99.1 - EX-99.1 - Altra Industrial Motion Corp. | d569876dex991.htm |
| Exhibit 99.2
|

Exhibit 99.2
Second-Quarter Replay Number
Through August 8, 2013, 2013
2013 Results 877-660-6853 Domestic
201-612-7415 International
Conference ID: # 417875
Webcast Replay at
July 25, 2013 www.altramotion.com
5:00 PM ET
Dial In Number
877-407-8293 Domestic
201-689-8349 International
Webcast at www.altramotion.com
|
|
Safe Harbor Statement
Cautionary Statement Regarding Forward Looking Statements
All statements, other than statements of historical fact included in this release are forward-looking statements, as that term is defined in the Private Securities Litigation Reform Act of 1995. These statements include, but are not limited to, any statement that may predict, forecast, indicate or imply future results, performance, achievements or events. Forward-looking statements can generally be identified by phrases such as “believes,” “expects,” “potential,” “continues,” “may,” “should,” “seeks,” “predicts,” “anticipates,” “intends,” “projects,” “estimates,” “plans,” “could,” “designed”, “should be,” and other similar expressions that denote expectations of future or conditional events rather than statements of fact. Forward-looking statements also may relate to strategies, plans and objectives for, and potential results of, future operations, financial results, financial condition, business prospects, growth strategy and liquidity, and are based upon financial data, market assumptions and management’s current business plans and beliefs or current estimates of future results or trends available only as of the time the statements are made, which may become out of date or incomplete. Forward-looking statements are inherently uncertain, and investors must recognize that events could differ significantly from our expectations. These statements include, but may not be limited to, those relating to the Company’s strategic growth and profitability initiatives, end market expectations, plans to enhance bottom line performance, plans to gain market share, improvement in orders, the Company’s acquisition strategy and its guidance for full year 2013.
In addition to the risks and uncertainties noted in this release, there are certain factors that could cause actual results to differ materially from those anticipated by some of the statements made. These include: (1) competitive pressures, (2) changes in economic conditions in the United States and abroad and the cyclical nature of our markets, (3) loss of distributors, (4) the ability to develop new products and respond to customer needs, (5) risks associated with international operations, including currency risks, (6) accuracy of estimated forecasts of OEM customers and the impact of the current global economic environment on our customers, (7) risks associated with a disruption to our supply chain, (8) fluctuations in the costs of raw materials used in our products, (9) product liability claims, (10) work stoppages and other labor issues, (11) changes in employment, environmental, tax and other laws and changes in the enforcement of laws, (12) loss of key management and other personnel, (13) changes in pension and retirement liabilities, (14) risks associated with compliance with environmental laws, (15) the ability to successfully execute, manage and integrate key acquisitions and mergers, (16) failure to obtain or protect intellectual property rights, (17) risks associated with impairment of goodwill or intangibles assets, (18) failure of operating equipment or information technology infrastructure, (19) risks associated with our debt leverage and operating covenants under our debt instruments, (20) risks associated with restrictions contained in our Convertible Notes and Credit Facility, (21) risks associated with compliance with tax laws, (22) risks associated with the global recession and volatility and disruption in the global financial markets, (23) risks associated with implementation of our new ERP system, (24) risks associated with the Bauer and Lamiflex acquisitions and integration and other acquisitions, (25) risks associated with the Company’s investment in a new manufacturing facility in China, and (26) other risks, uncertainties and other factors described in the Company’s quarterly reports on Form 10-Q and annual reports on Form 10-K and in the Company’s other filings with the U.S. Securities and Exchange Commission (SEC) or in materials incorporated therein by reference. Except as required by applicable law, Altra Holdings, Inc. does not intend to, update or alter its forward looking statements, whether as a result of new information, future events or otherwise.
| 1 |
|
|
|
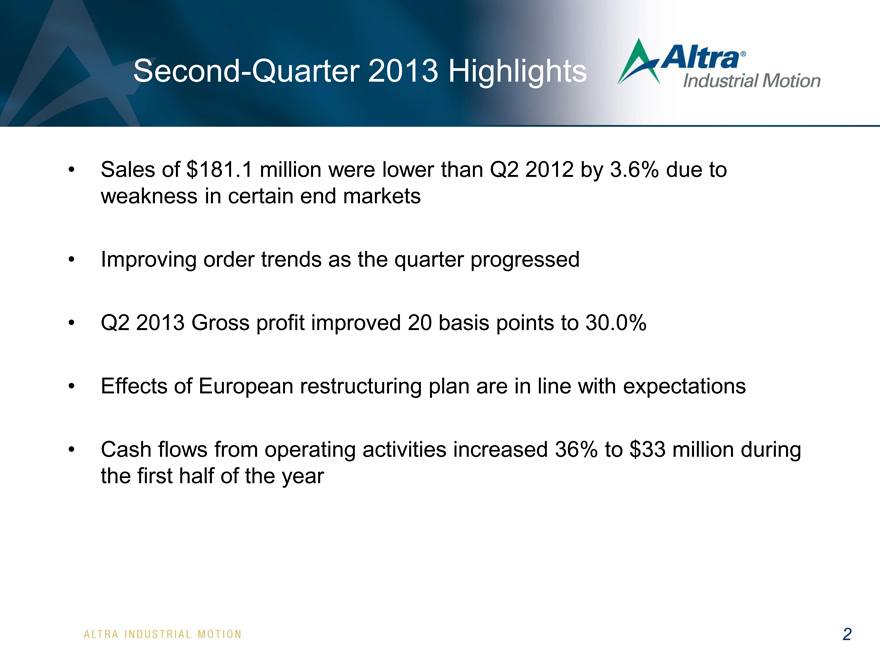
Second-Quarter 2013 Highlights
Sales of $181.1 million were lower than Q2 2012 by 3.6% due to weakness in certain end markets
Improving order trends as the quarter progressed
Q2 2013 Gross profit improved 20 basis points to 30.0%
Effects of European restructuring plan are in line with expectations
Cash flows from operating activities increased 36% to $33 million during the first half of the year
| 2 |
|
|
|
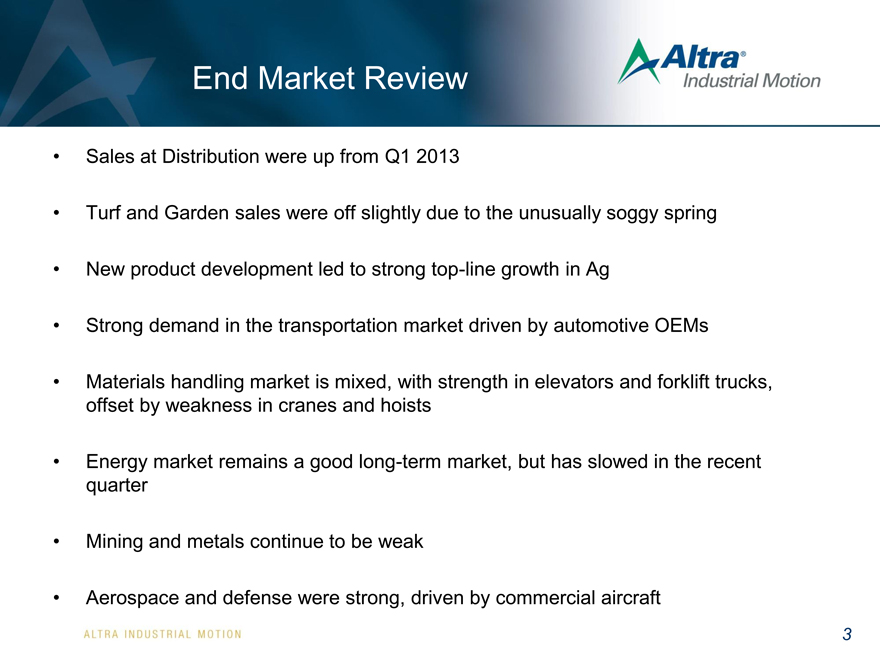
End Market Review
Sales at Distribution were up from Q1 2013
Turf and Garden sales were off slightly due to the unusually soggy spring
New product development led to strong top-line growth in Ag
Strong demand in the transportation market driven by automotive OEMs
Materials handling market is mixed, with strength in elevators and forklift trucks, offset by weakness in cranes and hoists
Energy market remains a good long-term market, but has slowed in the recent quarter
Mining and metals continue to be weak
Aerospace and defense were strong, driven by commercial aircraft
| 3 |
|
|
|
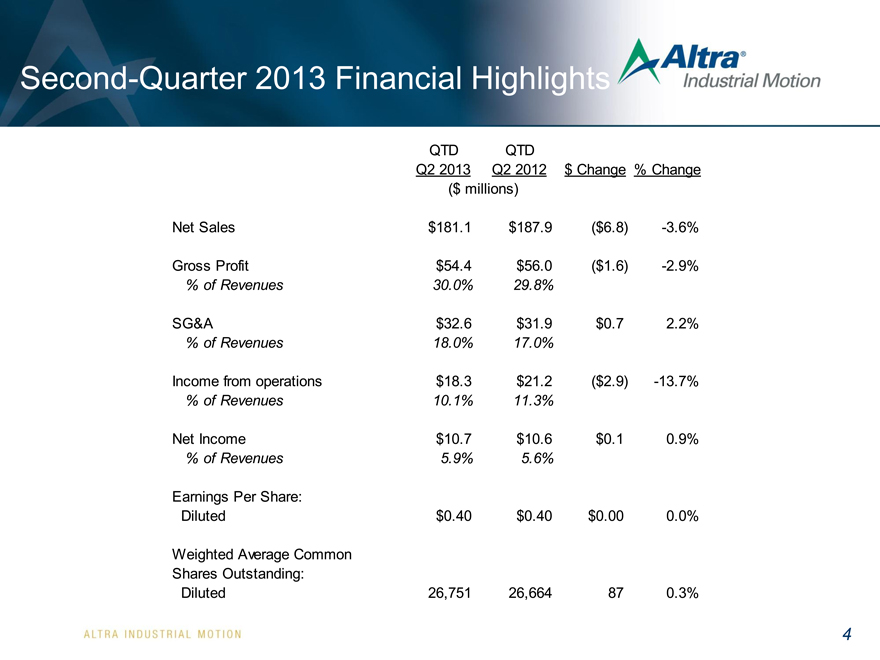
Second-Quarter 2013 Financial Highlights
QTD QTD
Q2 2013 Q2 2012 $ Change % Change
($ millions)
Net Sales $181.1 $187.9($6.8) -3.6%
Gross Profit $54.4 $56.0($1.6) -2.9%
% of Revenues 30.0% 29.8%
SG&A $32.6 $31.9 $0.7 2.2%
% of Revenues 18.0% 17.0%
Income from operations $18.3 $21.2($2.9) -13.7%
% of Revenues 10.1% 11.3%
Net Income $10.7 $10.6 $0.1 0.9%
% of Revenues 5.9% 5.6%
Earnings Per Share:
Diluted $0.40 $0.40 $0.00 0.0%
Weighted Average Common
Shares Outstanding:
Diluted 26,751 26,664 87 0.3%
| 4 |
|
|
|
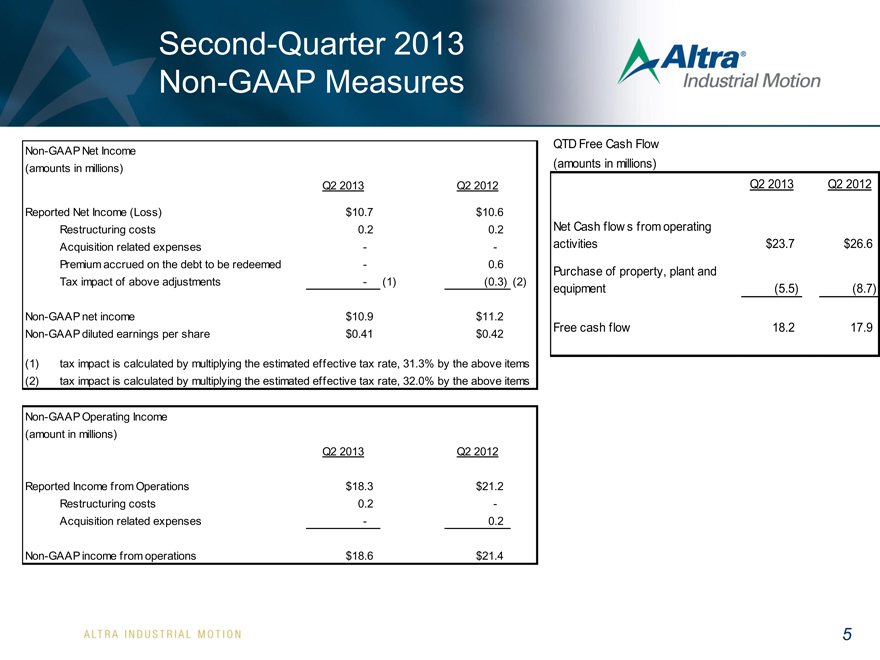
Second-Quarter 2013
Non-GAAP Measures
Non-GAAP Net Income QTD Free Cash Flow
(amounts in millions)(amounts in millions)
Q2 2013 Q2 2012 Q2 2013 Q2 2012
Reported Net Income (Loss) $ 10.7 $10.6
Restructuring costs 0.2 0.2 Net Cash flow s from operating
Acquisition related expenses — activities $23.7 $26.6
Premium accrued on the debt to be redeemed—0.6 Purchase of property, plant and
Tax impact of above adjustments—(1)(0.3) (2) equipment(5.5)(8.7)
Non-GAAP net income $ 10.9 $11.2
Non-GAAP diluted earnings per share $ 0.41 $0.42 Free cash flow 18.2 17.9
tax impact is calculated by multiplying the estimated effective tax rate, 31.3% by the above items
tax impact is calculated by multiplying the estimated effective tax rate, 32.0% by the above items
Non-GAAP Operating Income
(amount in millions)
Q2 2013 Q2 2012
Reported Income from Operations $ 18.3 $21.2
Restructuring costs 0.2 -
Acquisition related expenses—0.2
Non-GAAP income from operations $ 18.6 $21.4
| 5 |
|
|
|
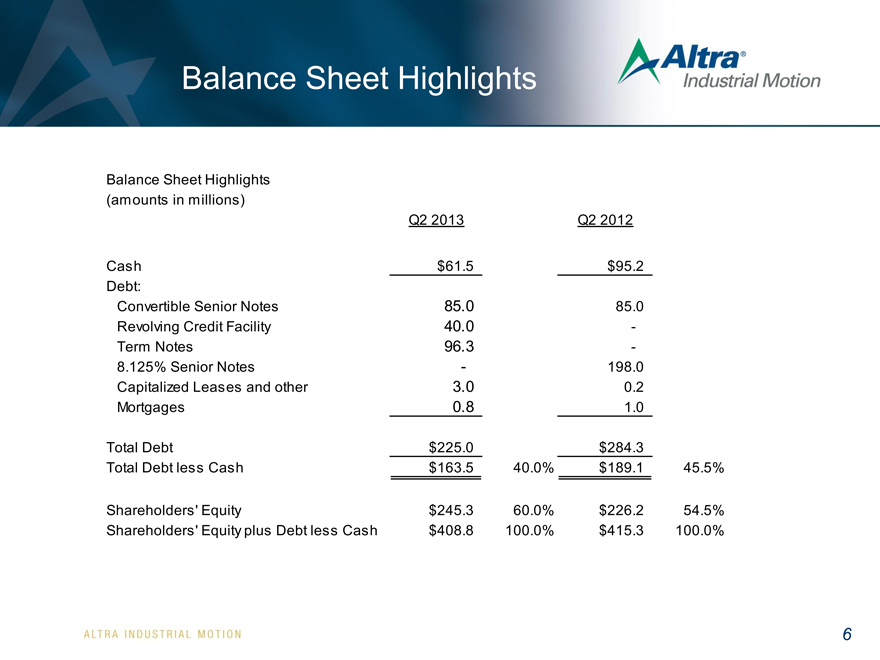
Balance Sheet Highlights
Balance Sheet Highlights
(amounts in millions)
Q2 2013 Q2 2012
Cash $61.5 $95.2
Debt:
Convertible Senior Notes 85.0 85.0
Revolving Credit Facility 40.0 -
Term Notes 96.3 -
| 8.125% |
|
Senior Notes—198.0 |
Capitalized Leases and other 3.0 0.2
Mortgages 0.8 1.0
Total Debt $225.0 $284.3
Total Debt less Cash $163.5 40.0% $189.1 45.5%
Shareholders’ Equity $245.3 60.0% $226.2 54.5%
Shareholders’ Equity plus Debt less Cash $408.8 100.0% $415.3 100.0%
| 6 |
|
|
|
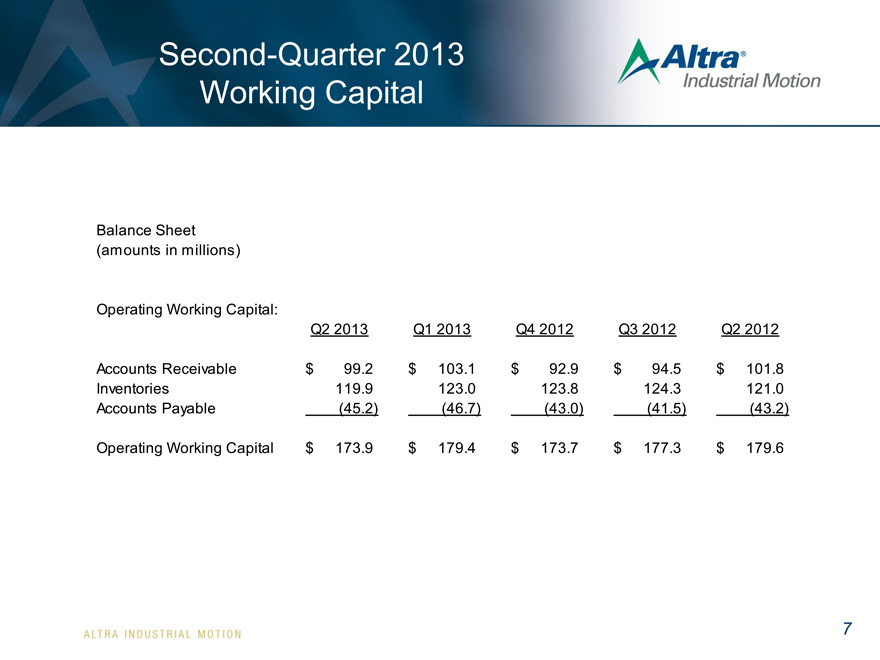
Second-Quarter 2013
Working Capital
Balance Sheet
(amounts in millions)
Operating Working Capital:
Q2 2013 Q1 2013 Q4 2012 Q3 2012 Q2 2012
Accounts Receivable $ 99.2 $ 103.1 $ 92.9 $ 94.5 $ 101.8
Inventories 119.9 123.0 123.8 124.3 121.0
Accounts Payable(45.2)(46.7)(43.0)(41.5)(43.2)
Operating Working Capital $ 173.9 $ 179.4 $ 173.7 $ 177.3 $ 179.6
| 7 |
|
|
|
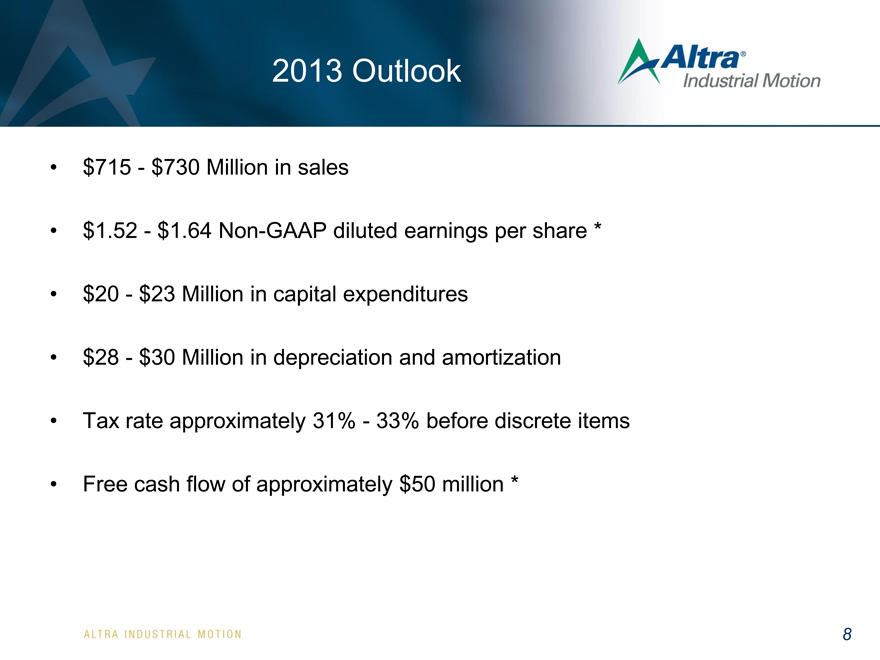
2013 Outlook
$715—$730 Million in sales
$1.52—$1.64 Non-GAAP diluted earnings per share *
$20—$23 Million in capital expenditures
$28—$30 Million in depreciation and amortization
Tax rate approximately 31%—33% before discrete items
Free cash flow of approximately $50 million *
| 8 |
|
|
|
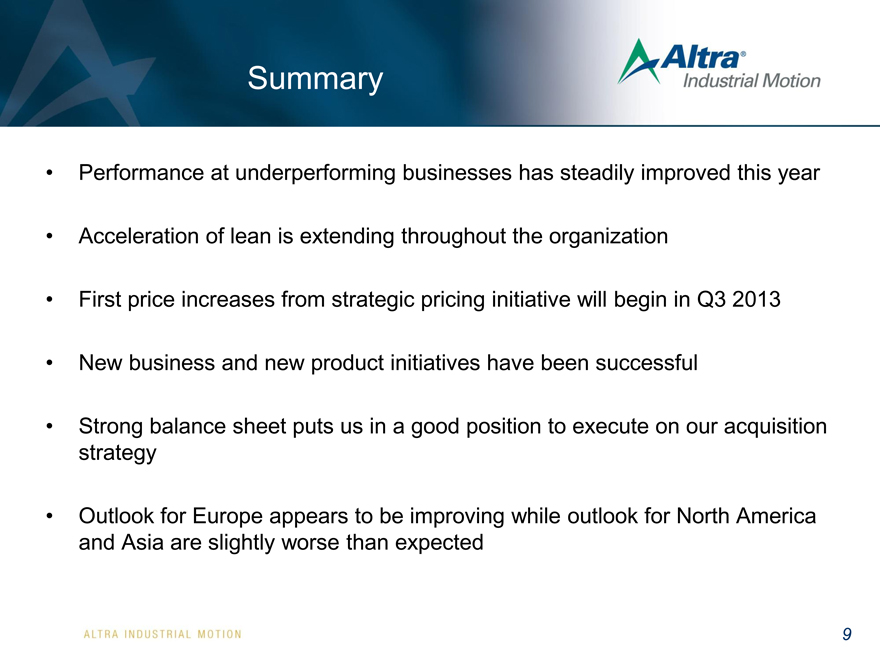
Performance at underperforming businesses has steadily improved this year
Acceleration of lean is extending throughout the organization
First price increases from strategic pricing initiative will begin in Q3 2013
New business and new product initiatives have been successful
Strong balance sheet puts us in a good position to execute on our acquisition strategy
Outlook for Europe appears to be improving while outlook for North America and Asia are slightly worse than expected
9
|
|
Summary
Discussion of Non-GAAP Measures
* As used in this release and the accompanying slides posted on the Company’s website, non-GAAP diluted earnings per share, non-GAAP income from operations and non-GAAP net income are each calculated using either net income or income from operations that excludes acquisition related costs, restructuring costs, and other income or charges that management does not consider to be directly related to the Company’s core operating performance. Non-GAAP diluted earnings per share is calculated by dividing non-GAAP net income by GAAP weighted average shares outstanding (diluted). Non-GAAP free cash flow is calculated by deducting purchases of property, plant and equipment from net cash provided by operating activities.
Altra believes that the presentation of non-GAAP net income, non-GAAP income from operations, non-GAAP diluted earnings per share and non-GAAP free cash flow provides important supplemental information to management and investors regarding financial and business trends relating to the Company’s financial condition and results of operations.
10