Attached files
| file | filename |
|---|---|
| 8-K - FORM 8-K - TOTAL SYSTEM SERVICES INC | d571381d8k.htm |
| EX-99.1 - EX-99.1 - TOTAL SYSTEM SERVICES INC | d571381dex991.htm |
 2013
Second Quarter and YTD Results July 23, 2013
©
2013
Total
System
Services,
Inc.®
Proprietary.
All
rights
reserved
worldwide.
Exhibit 99.2 |
 Forward-Looking Statements
This presentation and comments made by management contain forward-
looking statements including, among others, statements regarding
the
expected future operating results of TSYS. These statements are
based on
management’s current expectations and assumptions and are subject to
risks, uncertainties and changes in circumstances. Forward-looking
statements include all statements that are not historical facts and can be
identified by the use of forward-looking terminology such as the words
“believe,” “expect,”
“anticipate,”
“intend,”
“plan,”
“estimate”
or similar expressions. Actual results
may differ materially from those set forth in the forward-looking statements
due to a variety of factors. More information about these risks,
uncertainties and factors may be found in TSYS’
filings with the Securities and Exchange
Commission, including its 2012 Annual Report on Form 10-K, Quarterly
Reports on Form 10-Q and Current Reports on Form 8-K. TSYS does not
assume any obligation to update any forward-looking statements as a
result of new information, future developments or otherwise.
2
©2013
Total
System
Services,
Inc.®
Proprietary.
All
rights
reserved
worldwide. |
 Use of
Non-GAAP Financial Measures This slide presentation contains certain
non-GAAP financial measures determined by methods other than in
accordance with generally accepted accounting principles. Such non-GAAP
financial measures include the following: revenues before reimbursable
items; operating margin excluding reimbursable items; revenues measured on a
constant currency basis; free cash flow; EBITDA, Adjusted EBITDA and
Adjusted cash earnings per share. The most comparable GAAP measures to these
measures are revenues; operating margin; revenues; cash flows from operating
activities; net income; net income; and earnings per share, respectively.
Management uses these non-GAAP financial measures to assess the
performance of TSYS’ core
business. TSYS believes that these non-GAAP financial measures provide
meaningful additional information about TSYS to assist investors
in evaluating
TSYS’
operating results. These non-GAAP financial measures should not be
considered as a substitute for operating results determined in accordance with
GAAP and may not be comparable to other similarly titled measures of other
companies. The computations of the non-GAAP financial measures used in
this slide presentation are set forth in the Appendix to this slide
presentation. 3
©2013
Total
System
Services,
Inc.®
Proprietary.
All
rights
reserved
worldwide. |
 Phil
Tomlinson Chairman and Chief Executive Officer
©2013
Total
System
Services,
Inc.®
Proprietary.
All
rights
reserved
worldwide. |
 Troy
Woods President & Chief Operating Officer
©2013
Total
System
Services,
Inc.®
Proprietary.
All
rights
reserved
worldwide. |
 2Q
2013 North America Segment Highlights 6
©2013
Total
System
Services,
Inc.®
Proprietary.
All
rights
reserved
worldwide.
Improving Revenue
Operating Income up 10.6%
Margin Expansion: up 210 BPS over 2Q12
Shifting Conversion Pipeline
(*) Revenues Before Reimbursable Items |
 2Q
2013 North America Segment Highlights 7
©2013
Total
System
Services,
Inc.®
Proprietary.
All
rights
reserved
worldwide.
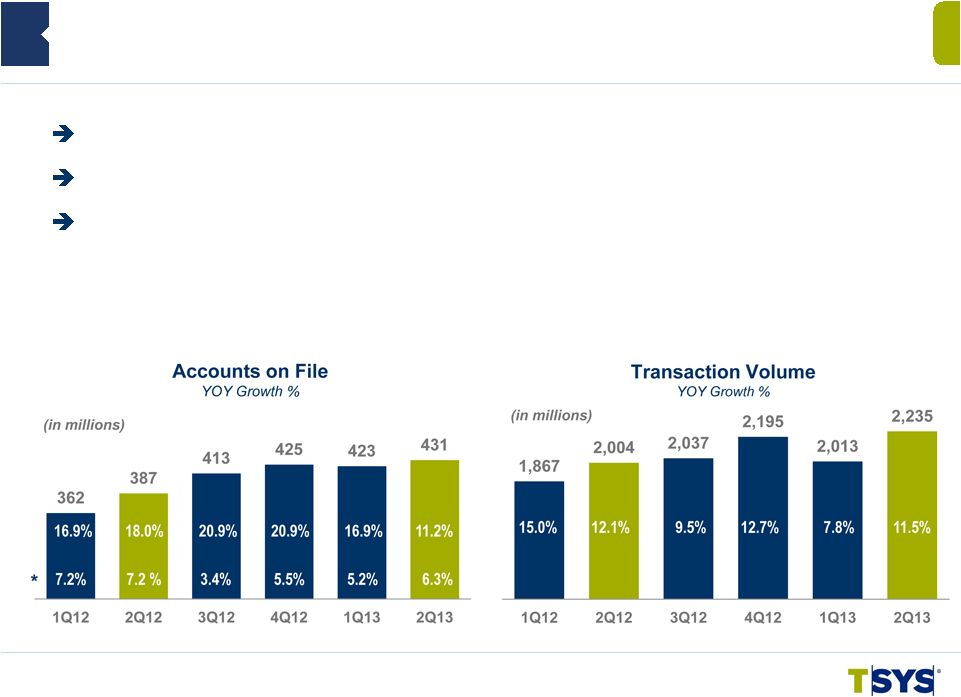
(*)
Growth
Excluding
Prepaid,
Government
Services
and
Single
Use
Accounts
Tenth Straight Quarter of Account On File YOY Growth
Thirteenth Straight Quarter of Transaction YOY Growth
Same Client Transactions up 11.4%: Fifteenth Straight Quarter of
YOY Growth |
 ©
2013
Total
System
Services,
Inc.®
Proprietary.
All
rights
reserved
worldwide.
8
North America Conversion Pipeline
Reporting
Period
1Q13
2Q13
3Q13
4Q13
1Q14
2Q14
3Q14
4Q14
Conversion
Pipeline
Net Total
4Q12
0.20
0.10
11.80
14.10
0.10
75.40
—
0.70
102.40
2013 Total
26.20
1Q13
—
0.10
10.90
0.50
0.70
79.50
9.40
0.30
101.40
2013 Total
11.50
2Q13
—
—
0.50 (1)
0.50
—
79.40
9.20
—
89.60
2013 Total
1.00
(1) Converted 10.7M Accounts 7/13/13
2Q 2013 North America Segment Highlights
(in millions) |
 2Q
2013 International Segment Highlights 9
©2013
Total
System
Services,
Inc.®
Proprietary.
All
rights
reserved
worldwide.
Revenue $93.2M* –
down 5.9%
–
Up 0.4% on Constant Currency
Currency Headwinds Continue: Q2 $6.2M* YTD $10.2M*
Margin Expansion Continues
1M Account Conversion Pipeline
Renewed Focus on Growth
(*) Revenues Before Reimbursable Items |
 2Q
2013 International Segment Highlights 10
©2013
Total
System
Services,
Inc.®
Proprietary.
All
rights
reserved
worldwide.
Record Number Accounts Processed
Solid Transaction Growth
Same Client Transaction Growth 9.3% |
 2Q
2013 Merchant Segment Highlights 11
©2013
Total
System
Services,
Inc.®
Proprietary.
All
rights
reserved
worldwide.
Acquisitions Fueling Growth
Direct Exceeds Indirect
Sequential Quarter Margin Expansion
Bank of America Merchant Services Extended
EMV Certification Complete
Back-end Integration on Schedule
–
Headwind on Margin
(*) Revenues Before Reimbursable Items |
 2Q
2013 Merchant Segment Highlights 12
©2013
Total
System
Services,
Inc.®
Proprietary.
All
rights
reserved
worldwide.
(*) Excludes Managed Accounts and ProPay
Record SBS Sales Volume
Indirect Faces Headwinds but Optimistic Growth Still Achievable
POS Transactions, Excluding Deconverted Accounts, Increased 4.8%
|
 2Q
2013 NetSpend Segment Highlights 13
©2013
Total
System
Services,
Inc.®
Proprietary.
All
rights
reserved
worldwide.
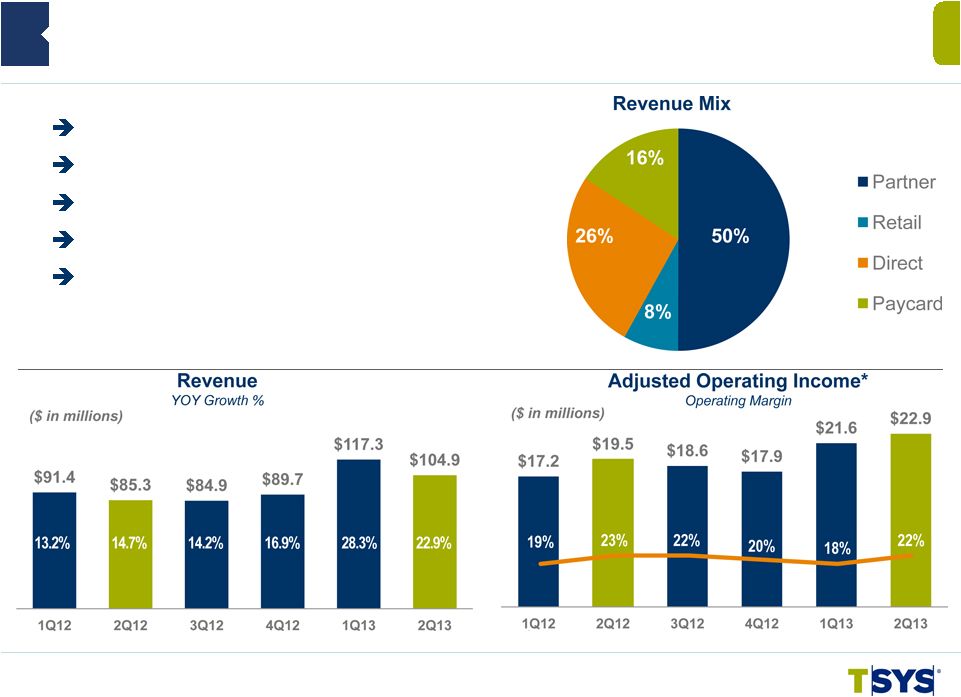
Revenue $105M –
up 23%
Significant Sequential Quarter Margin Expansion
Extended Exclusive ACE Agreement 5 Years
Added Over 3,500 Retail Locations
Added 75 New PayCard Clients
(*) Operating Income Excluding Amortization of Acquisition
Intangibles, M&A Costs and Non-recurring Items
|
 14
©2013
Total
System
Services,
Inc.®
Proprietary.
All
rights
reserved
worldwide.
2Q 2013 NetSpend Segment Highlights
Gross Dollar Volume
YOY Growth %
Direct Deposit Active Cards
YOY Growth %
Direct Deposit Active Cards up 42%
Total Active Accounts up 38%
Gross Dollar Volume (GDV) up 30% |
 Jim
Lipham Chief Financial Officer
©2013
Total
System
Services,
Inc.®
Proprietary.
All
rights
reserved
worldwide. |
 Consolidated Selected Financial Highlights
16
©2013
Total
System
Services,
Inc.®
Proprietary.
All
rights
reserved
worldwide.
$ 478,443
$ 462,651
3.4%
Total Revenues
$ 943,439
$ 923,813
2.1%
417,512
398,691
4.7
Revenues Before Reimbursable Items
821,749
793,870
3.5
95,314
92,096
3.5
Operating Income
170,217
176,927
(3.8)
57,716
66,710
(13.5)
Net Income Attributable to TSYS
Common Shareholders
114,745
123,105
(6.8)
2,727.4
2,406.1
13.4
Total Cardholder Transactions (in millions)
5,175.0
4,656.4
11.1
Basic Earnings Per Share (EPS)
Attributable to TSYS Common
Shareholders:
$0.31
$0.35
(12.9)
As Reported (GAAP)
$0.61
$0.65
(6.0)
$0.34
$0.35
(4.3)
Excluding M&A expenses
$0.67
$0.65
2.9
$0.38
$0.40
(3.5)
Adjusted Cash EPS*
$0.77
$0.73
5.2
$142,324
$140,338
1.4
Adjusted EBITDA*
$267,799
$269,640
(0.7)
YTD
2013
YTD
2012
Percent
Change
(in thousands, except per share data)
2
Qtr
2013
2
Qtr
2012
Percent
Change
(*) Adjusted Cash EPS and Adjusted EBITDA definitions are contained in
Appendix nd
nd |
 2013
YTD Revenue Change Revenues Before Reimbursable Items
17
©2013
Total
System
Services,
Inc.®
Proprietary.
All
rights
reserved
worldwide.
12%
16%
4%
0%
5.4%
Internal
Growth
New
Clients
2.9%
Acquisitions
Lost
Business
(5.3%)
Non-recurring
Items
(0.6%)
Price
Compression
(2.3%)
(8.2%)
Reported
3.5%
Currency
(1.3%)
4.7%
8% |
 Consumer Credit
208.6
199.4
4.7
208.6
203.8
2.4
Retail
25.9
25.2
2.8
25.9
25.2
2.6
Total Consumer
234.5
224.6
4.5
234.5
229.0
2.4
Commercial
38.6
36.1
6.7
38.6
37.9
1.8
Other
15.3
9.6
60.5
15.3
13.4
14.1
Subtotal
288.4
270.3
6.7
288.4
280.3
2.9
Prepaid /
Stored Value
102.8
105.4
(2.4
)
102.8
107.3
(4.2
)
Government
Services
60.6
30.8
96.4
60.6
59.4
2.1
Commercial Card
Single Use
37.0
34.0
8.8
37.0
31.6
17.0
Total AOF
488.8
440.5
11.0
488.8
478.6
2.1
Consolidated Accounts on File Portfolio Summary
(in millions)
Jun
2013
Jun
2012
%
Change
Jun
2013
Mar
2013
%
Change
18
©2013
Total
System
Services,
Inc.®
Proprietary.
All
rights
reserved
worldwide. |
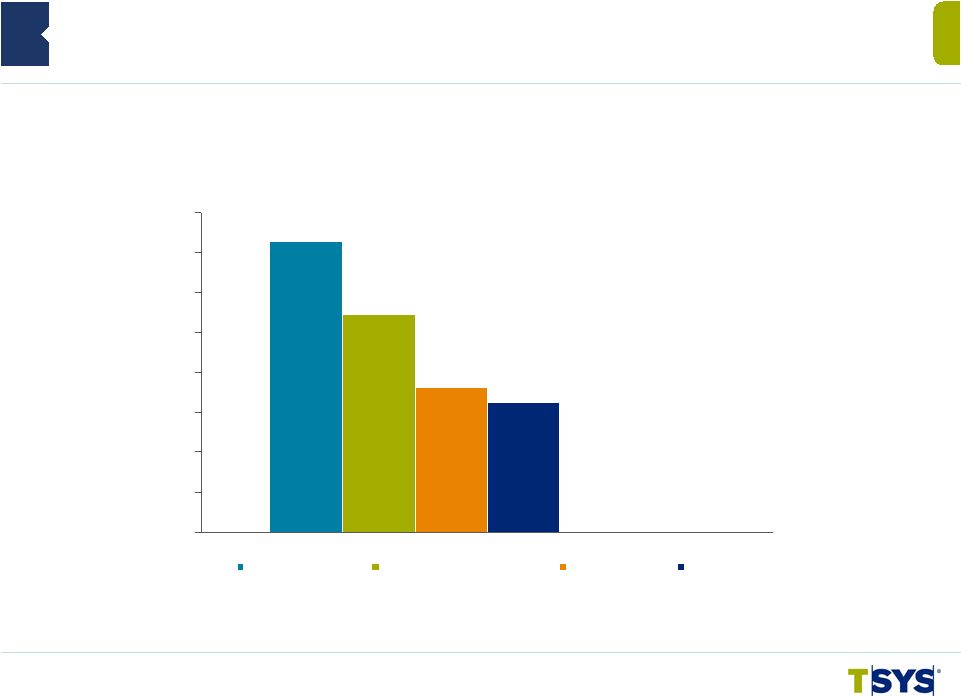 Cash
Flow Strength: 2013 TTM Consolidated Financial Highlights
$545
$410
$271
$244
$0
$75
$150
$225
$300
$375
$450
$525
$600
Adjusted EBITDA
Cash flow from operations
Free cash flow
Net income
19
©2013
Total
System
Services,
Inc.®
Proprietary.
All
rights
reserved
worldwide.
TTM = Trailing Twelve Months
(in millions) |
 NetSpend Acquisition
Closed July 1
Approximately $1.4 billion in consideration
–
Includes cash from borrowings and equity
–
Conversion
of
NetSpend
unvested
options
and
nonvested
awards
to
TSYS’
equity
New operating segment named “NetSpend”
One-time M&A costs will also impact second half of 2013 of $11.3 million
Interest expense with new borrowings $23.0-$24.5 million in 2013
Approximately $67 million annual amortization of acquisition intangibles
Synergies
©2013
Total
System
Services,
Inc.®
Proprietary.
All
rights
reserved
worldwide.
20 |
 NetSpend Acquisition Financing
May Bond Issuance:
$1,100M*
–
$550M of 5-year notes with a 2.375% coupon
–
$550M of 10-year notes with a 3.750% coupon
July 5-year Term Debt:
$200M
July Credit Facility Revolver Draw:
$100M
Total Acquisition Debt:
$1,400M
Other Outstanding Long-term Debt:
$ 44M
Credit Facility Term Loan Balance:
$143M
©2013
Total
System
Services,
Inc.®
Proprietary.
All
rights
reserved
worldwide.
21
(*)
Shown
at
par
value;
does
not
include
bond
issuance
discounts
or
fees |
 2013
Revised Guidance* Range
Range
Percent Change
Total Revenues
$2,137
to
$2,180
14 %
to
17 %
Revenues Before Reimbursable Items
$1,898
to
$1,936
17%
to
20%
Adjusted EBITDA
$639
to
$652
17%
to
19%
Adjusted Cash EPS
$1.69
to
$1.72
16%
to
18%
(in millions, except per share data)
22
©2013
Total
System
Services,
Inc.®
Proprietary.
All
rights
reserved
worldwide.
(*) See Appendix for guidance assumptions |
 2013
Guidance Reconciliation Total Revenues
Revenues
Before Reimbursables
Original Guidance
$1,955
to
$1,995
$1,711
to
$1,746
NetSpend Acquisition
197
to
200
197
to
200
Reimbursable Items
(5)
to
(5)
--
--
Currency Translation (Jun YTD)
(10)
to
(10)
(10)
to
(10)
Revised Guidance
$2,137
to
$2,180
$1,898
to
$1,936
(in millions)
23
©2013
Total
System
Services,
Inc.®
Proprietary.
All
rights
reserved
worldwide. |
 2013
Revised Guidance Revenue Change Revenues Before Reimbursable Items
24
©2013
Total
System
Services,
Inc.®
Proprietary.
All
rights
reserved
worldwide.
30%
15%
0%
Internal
Growth
New
Clients
3-4%
Acquisitions
Lost
Business,
Non-recurring
Items and
Price
Compression
(5-7%)
Guidance
17-20%
Currency
5-7%
15-17%
(1%) |
 Closing Remarks
©2013
Total
System
Services,
Inc.®
Proprietary.
All
rights
reserved
worldwide. |
 Q&A
©2013
Total
System
Services,
Inc.®
Proprietary.
All
rights
reserved
worldwide. |
 Appendix
©2013
Total
System
Services,
Inc.®
Proprietary.
All
rights
reserved
worldwide. |
 Appendix: Non-GAAP Items –
Adjusted EBITDA and
Adjusted Cash EPS
•
Adjusted EBITDA is net income excluding equity in income of equity investments,
nonoperating income/(expense), taxes, depreciation, amortization and
stock-based compensation expenses and other non-recurring items..
•
Adjusted cash EPS is adjusted cash earnings divided by weighted average shares
outstanding used for basic EPS calculations. Adjusted cash earnings is net
income excluding the after-tax impact of stock-based compensation
expenses, amortization of acquisition intangibles, and other
non-recurring items. •
The Company believes that these non-GAAP financial measures it presents are
useful to investors in evaluating the Company’s operating performance
for the following reasons: –
adjusted EBITDA and Adjusted cash EPS are widely used by investors to measure a
company’s operating performance without regard to items, such as
interest expense, income tax expense, depreciation and amortization, merger and acquisition expenses
and employee stock-based compensation expense that can vary substantially from
company to company depending upon their respective financing structures and
accounting policies, the book values of their assets, their capital structures and the methods by
which their assets were acquired; and
–
securities
analysts
use
adjusted
EBITDA
and
Adjusted
cash
EPS
as
supplemental
measures
to
evaluate
the
overall
operating
performance of companies.
•
By comparing the Company’s adjusted EBITDA and Adjusted cash EPS in different
historical periods, investors can evaluate the Company’s operating
results without the additional variations caused by employee stock-based compensation expense,
which may not be comparable from period to period due to changes
in the fair market value of the Company’s common stock
(which is influenced by external factors like the volatility of public markets and
the financial performance of the Company’s peers) and is not a key
measure of the Company’s operations. •
The Company’s management uses the non-GAAP financial measures:
–
as measures of operating performance, because they exclude the impact of items not
directly resulting from the Company’s core operations;
–
for planning purposes, including the preparation of the Company’s annual
operating budget; –
to allocate resources to enhance the financial performance of the Company’s
business; –
to evaluate the effectiveness of the Company’s business strategies; and
–
in communications with the Company’s board of directors concerning the
Company’s financial performance. ©2013
Total
System
Services,
Inc.®
Proprietary.
All
rights
reserved
worldwide.
28 |
 Appendix: Non-GAAP Reconciliation –
Revenues Before Reimbursable Items
Three Months
Ended Six Months Ended
6/30/13
6/30/12
6/30/13
6/30/12 Total Revenues
$ 478,443 $
462,651 $
943,439 $
923,813 Reimbursable Items
60,931
63,959
121,690
129,942
Revenues Before Reimbursable Items
$ 417,512
$ 398,692
$ 821,749
$ 793,871
(in thousands)
29
©2013
Total
System
Services,
Inc.®
Proprietary.
All
rights
reserved
worldwide. |
 Three Months Ended
6/30/13 6/30/12
Three Months Ended
6/30/13
6/30/12 Three Months Ended
6/30/13 6/30/12
Operating Income (a)
$ 79,896 $
72,231 $
8,056 $
9,438 $
33,590 $ 32,950
Total Revenues (b)
248,640
239,557
98,087
103,415
136,458
124,903
Reimbursable Items
34,114
33,992
4,878
4,368
23,506
27,202
Revenues Before
Reimbursable Items(c)
214,526
205,565
93,209
99,047
112,952
97,701
Operating Margin (a)/(b)
32.13%
30.15%
8.21%
9.13%
24.62%
26.38%
Operating Margin Excluding Reimbursables (a)/(c)
37.24%
35.14%
8.64%
9.53%
29.74%
33.73%
Appendix: Non-GAAP Reconciliation –
Segment
Operating Margin Excluding Reimbursable Items
North America
International
Merchant
(in thousands)
30
©2013
Total
System
Services,
Inc.®
Proprietary.
All
rights
reserved
worldwide. |
 Six
Months Ended
6/30/13 6/30/12
Percentage
Change
Three
Months Ended
6/30/13 6/30/12
Percentage
Change
Appendix: Non-GAAP Reconciliation –
Constant Currency
(1) Reflects current period results on a non-GAAP basis as if foreign currency
rates did not change from the comparable prior year period. (2) Reflects the
impact of calculated changes in foreign currency rates from the comparable period.
(in thousands)
Consolidated:
Constant Currency (1)
$ 484,810
$ 462,651
4.8%
$953,825
$ 923,813
3.2%
Foreign Currency (2)
(6,367)
---
(10,386)
---
Total Revenues
$478,443
$462,651
3.4%
$943,439
$923,813
2.1%
International Services:
Constant Currency (1)
$ 104,480
$103,415
1.0%
$ 205,665
$ 203,775
0.9%
Foreign Currency (2)
(6,393)
---
(10,482)
---
Total Revenues
$98,087
$103,415
(5.2%)
$195,183
$203,775
(4.2%)
31
©2013
Total
System
Services,
Inc.®
Proprietary.
All
rights
reserved
worldwide. |
 Six
Months Ended
6/30/13 6/30/12
Percentage
Change
Three
Months Ended
6/30/13 6/30/12
Percentage
Change
Appendix: Non-GAAP Reconciliation –
Constant Currency
(1) Reflects current period results on a non-GAAP basis as if foreign currency
rates did not change from the comparable prior year period. (2) Reflects the
impact of calculated changes in foreign currency rates from the comparable period.
(in thousands)
Consolidated:
Constant Currency (1)
$ 423,725
$ 398,692
6.3%
$831,918
$ 793,871
4.8%
Foreign Currency (2)
(6,213)
---
(10,169)
---
Revenues before
reimbursable items
$417,512
$398,692
4.7%
$821,749
$793,871
3.5%
International Services:
Constant Currency (1)
$ 99,449
$99,047
0.4%
$ 196,067
$ 195,538
0.3%
Foreign Currency (2)
(6,240)
---
(10,265)
---
Revenues before
reimbursable items
$93,209
$99,047
(5.9%)
$185,802
$195,538
(5.0%)
32
©2013
Total
System
Services,
Inc.®
Proprietary.
All
rights
reserved
worldwide. |
 Appendix: Non-GAAP Reconciliation –
EBITDA and Adjusted EBITDA
(in thousands)
33
©2013
Total
System
Services,
Inc.®
Proprietary.
All
rights
reserved
worldwide.
Three Months Ended
Six Months Ended
Mar
Jun
Sep
Dec
Mar
Jun
Jun
Jun
2012
2012
2012
2012
2013
2013
2013
2012
Net income :
As reported (GAAP) (a)
$57,644
$67,977
$62,043
$62,257
$59,149
$60,561
$119,710
$125,622
Adjusted for:
Deduct: Equity in Income of
Equity Investments
(2,774)
(2,252)
(1,957)
(3,188)
(3,817)
(2,748)
(6,565)
(5,026)
Add: Income Taxes
29,556
24,553
30,228
30,767
17,845
29,947
47,793
54,108
Add: Nonoperating expenses
405
1,818
579
(5)
1,726
7,554
9,279
2,223
Add: Depreciation and
amortization
40,873
43,213
43,243
43,281
42,498
40,546
83,044
84,086
EBITDA
$125,704
$135,309
$134,136
$133,112
$117,401
$135,860
$253,261
$261,013
Adjust for:
Add: Share-based
compensation
3,598
5,029
3,722
6,273
4,593
5,211
9,804
8,627
Add: NetSpend M&A expenses
--
--
--
--
3,481
1,253
4,734
--
Adjusted EBITDA
$129,302
$140,338
$137,858
$139,385
$125,475
$142,324
$267,799
$269,640 |
 Appendix: Non-GAAP Reconciliation –
Adjusted Cash EPS
(in thousands)
34
©2013
Total
System
Services,
Inc.®
Proprietary.
All
rights
reserved
worldwide.
Three Months Ended
Six Months Ended
Mar
Jun
Sep
Dec
Mar
Jun
Jun
Jun
2012
2012
2012
2012
2013
2013
2013
2012
Net income Available to TSYS
Common Shareholders:
As reported (GAAP) (a)
$56,395
$66,710
$60,312
$60,862
$57,028
$57,716
$114,745
$123,106
Adjusted for amounts
attributable to TSYS common
shareholders (net of taxes):
Acquisition intangible
amortization
3,933
4,409
4,383
4,528
6,096
4,847
10,848
8,355
Share-based compensation
2,363
3,686
2,489
4,169
3,494
3,431
6,917
6,004
Cash earnings
$62,691
$74,805
$67,184
$69,559
$66,618
$65,994
$132,510
$137,465
M&A expenses
--
--
--
--
$5,222
$5,653
$10,875
--
Adjusted cash earnings (b)
$62,691
$74,805
$67,184
$69,559
$71,840
$71,647
$143,385
$137,465
Average common shares
outstanding and participating
securities(c)
188,718
189,070
187,878
186,471
186,807
187,738
187,277
188,894
Basic EPS Available to TSYS
Common Shareholders (a) / (c)
$0.30
$0.35
$0.32
$0.32
$0.31
$0.31
$0.71
$0.73
Adjusted cash EPS Available to
TSYS Common Shareholders
(b) / (c)
$0.33
$0.40
$0.36
$0.37
$0.38
$0.38
$0.77
$0.73 |
 Appendix: Non-GAAP Reconciliation –
EBITDA and Adjusted EBITDA
Trailing Twelve
Months Ended
6/30/2013
Net Income
$ 244,010
Adjusted for:
Deduct: Equity in Income of Equity Investments
(11,709)
Add: Income Taxes
108,787
Add: Nonoperating expense
9,854
Add: Depreciation and Amortization
169,568
EBITDA
$ 520,510
Adjust for: Share-based compensation
19,798
NetSpend M&A Operating Expenses
4,734
Adjusted EBITDA
$ 545,042
(in thousands)
35
©2013
Total
System
Services,
Inc.®
Proprietary.
All
rights
reserved
worldwide. |
 Appendix: Non-GAAP Reconciliation –
Free Cash Flow
Trailing Twelve
Months Ended
6/30/2013
Cash Flows from Operating Activities
$ 409,596
Less:
Purchase of Property and Equipment
(31,286)
Additions to Licensed Computer Software from Vendors
(43,434)
Additions to Internally Developed Computer Software
(21,686)
Additions to Contract Acquisition Costs
(42,150)
Free Cash Flow
$ 271,040
(in thousands)
36
©2013
Total
System
Services,
Inc.®
Proprietary.
All
rights
reserved
worldwide. |
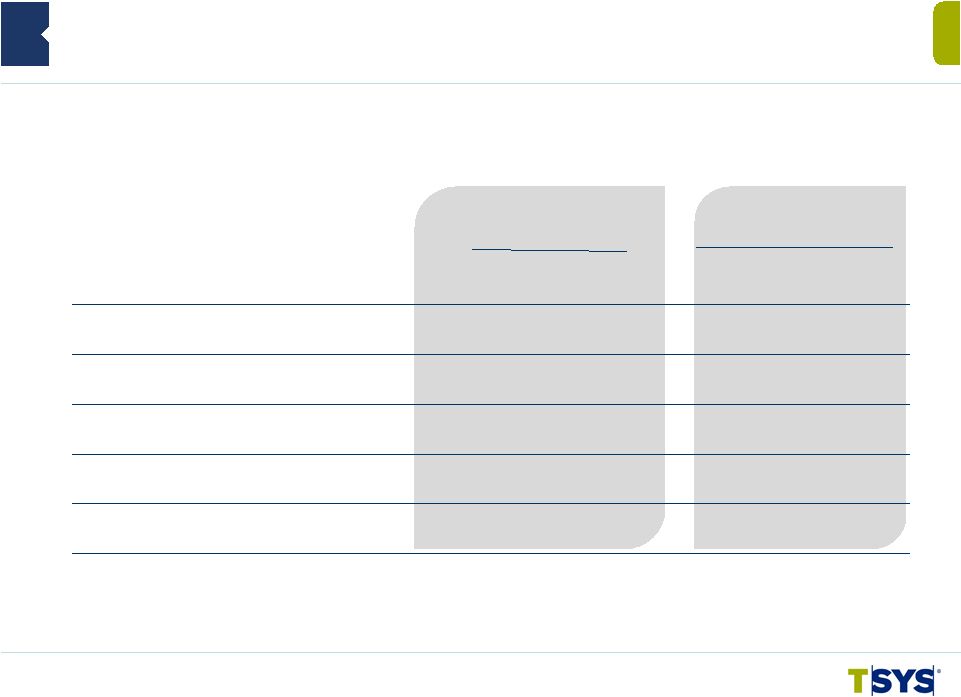
 Mar
31, 2013
Dec 31,
2012
Jun 30,
2012
Jun 30,
2013
Sep 30,
2012
Appendix: Non-GAAP Reconciliation –
NetSpend
Adjusted Operating Income
Mar 31,
2012
Operating income (loss) (GAAP)
($ 8,964)
$ 17,430
$ 7,869
$ 17,594
$ 18,332
$ 15,799
Adjusted for:
Add: Amortization of acquisition
intangibles
881
534
446
434
590
431
Add: Settlement (gains) and
other losses
25,315
1,533
10,300
(160)
48
3,423
Add: M&A expenses
--
--
--
--
2,656
3,219
Adjusted operating income
$ 17,232
$ 19,497
$ 18,615
$ 17,868
$ 21,626
$ 22,872
(in thousands)
37
©2013
Total
System
Services,
Inc.®
Proprietary.
All
rights
reserved
worldwide.
Three Months Ended |
 Appendix: 2013 Revised Guidance Assumptions
The guidance includes:
©2013
Total
System
Services,
Inc.®
Proprietary.
All
rights
reserved
worldwide.
38
•
NetSpend’s operating results for six months of 2013;
•
Excludes one-time expenses incurred in connection with the NetSpend
acquisition of $16.0 million;
•
Assumes approximately $33.5 million ($67 million on an annual basis)
of acquisition intangible amortization associated with the NetSpend
acquisition;
•
No significant movement in foreign exchange rates; and
•
Minimal synergies for 2013. |