Attached files
| file | filename |
|---|---|
| 8-K - FORM 8K - ManpowerGroup Inc. | form8-k.htm |
| EX-99.1 - PRESS RELEASE DATED JULY 19, 2013 - ManpowerGroup Inc. | exhibit_99-1.htm |
| EX-99.3 - OPERATING UNIT RESULTS REFLECTING THE RESTATEMENT OF SEGMENT RESULTS - ManpowerGroup Inc. | exhibit_99-3.htm |
Exhibit 99.2

ManpowerGroup Second Quarter Results July 19, 2013
Forward-Looking Statements This presentation contains statements, including financial projections, that are forward-looking in nature. These statements are based on managements’ current expectations or beliefs, and are subject to known and unknown risks and uncertainties regarding expected future results. Actual results might differ materially from those projected in the forward-looking statements. Additional information concerning factors that could cause actual results to materially differ from those in the forward-looking statements is contained in the ManpowerGroup Inc. Annual Report on Form 10-K dated December 31, 2012, which information is incorporated herein by reference, and such other factors as may be described from time to time in the Company’s SEC filings. Any forward-looking statements in this presentation speak only as of the date hereof. The Company assumes no obligation to update or revise any forward-looking statements. *
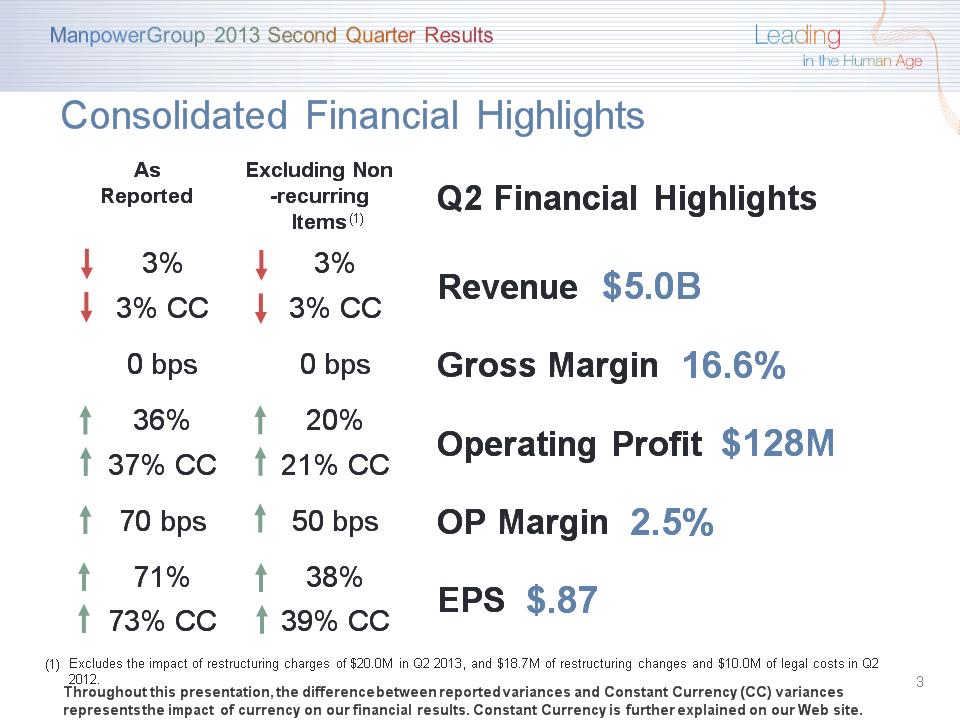
As Reported Excluding Non-recurring Items Q2 Financial Highlights 3% 3% Revenue $5.0B 3% CC 3% CC Revenue $5.0B 0 bps 0 bps Gross Margin 16.6% 36% 20% Operating Profit $128M 37% CC 21% CC Operating Profit $128M 70 bps 50 bps OP Margin 2.5% 71% 38% EPS $.87 73% CC 39% CC EPS $.87 Throughout this presentation, the difference between reported variances and Constant Currency (CC) variances represents the impact of currency on our financial results. Constant Currency is further explained on our Web site. Consolidated Financial Highlights * Excludes the impact of restructuring charges of $20.0M in Q2 2013, and $18.7M of restructuring changes and $10.0M of legal costs in Q2 2012. (1)
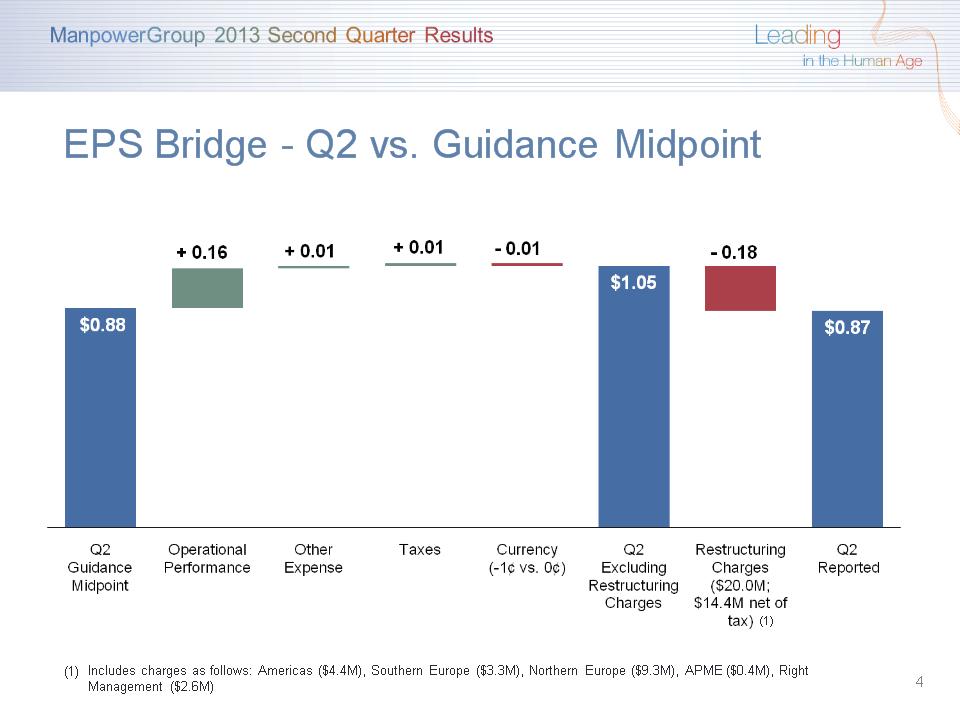
EPS Bridge – Q2 vs. Guidance Midpoint Includes charges as follows: Americas ($4.4M), Southern Europe ($3.3M), Northern Europe ($9.3M), APME ($0.4M), Right Management ($2.6M) (1) *
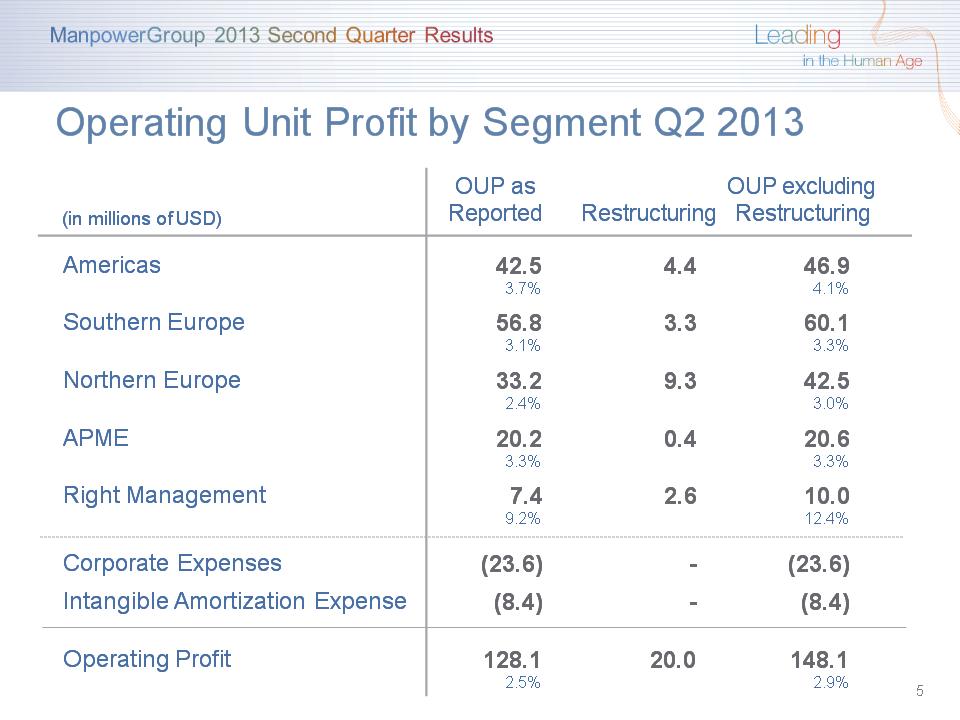
(in millions of USD) OUP as Reported Restructuring OUP excluding Restructuring Americas 42.5 3.7% 4.4 46.9 4.1% Southern Europe 56.8 3.1% 3.3 60.1 3.3% Northern Europe 33.2 2.4% 9.3 42.5 3.0% APME 20.2 3.3% 0.4 20.6 3.3% Right Management 7.4 9.2% 2.6 10.0 12.4% Corporate Expenses (23.6) - (23.6) Intangible Amortization Expense (8.4) - (8.4) Operating Profit 128.1 2.5% 20.0 148.1 2.9% Operating Unit Profit by Segment Q2 2013 *
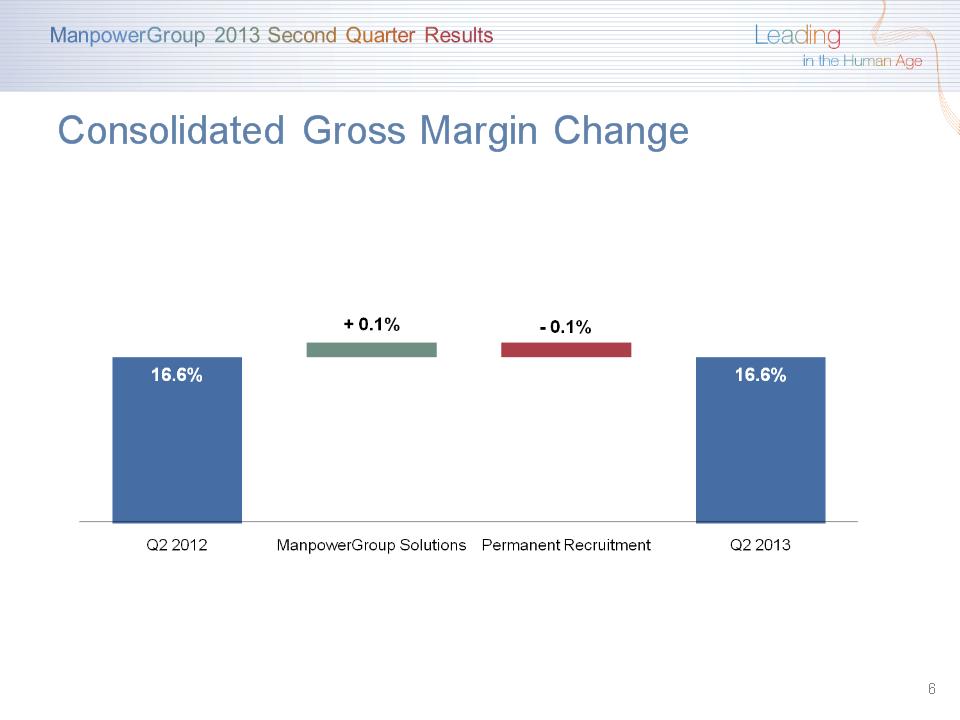
Consolidated Gross Margin Change *
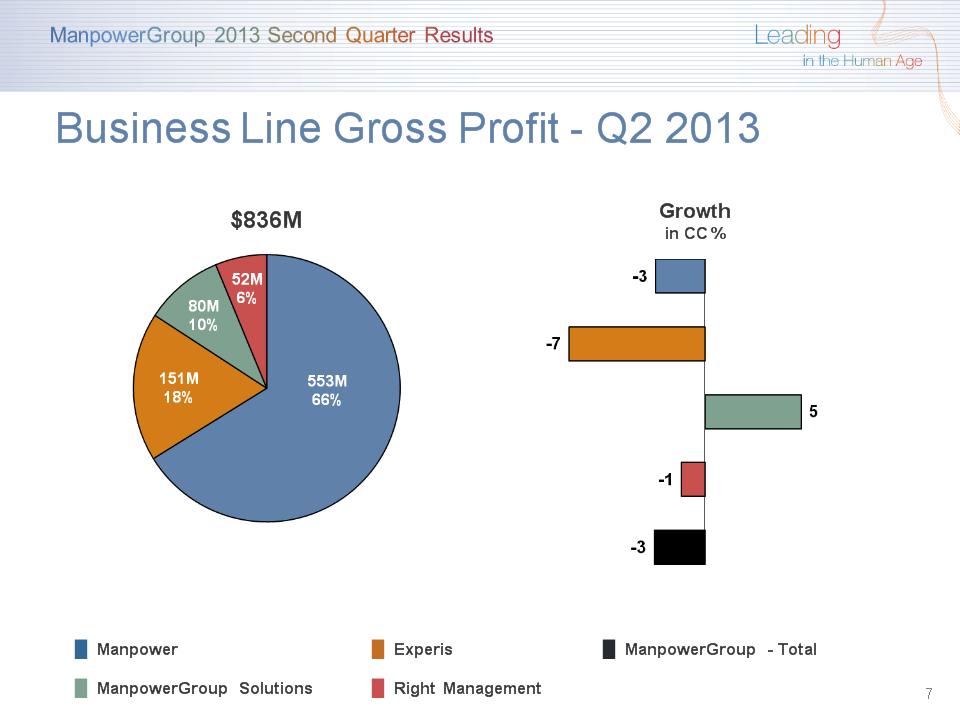
* $836M Growth in CC % Business Line Gross Profit – Q2 2013 █ Manpower █ Experis █ ManpowerGroup - Total █ ManpowerGroup Solutions █ Right Management
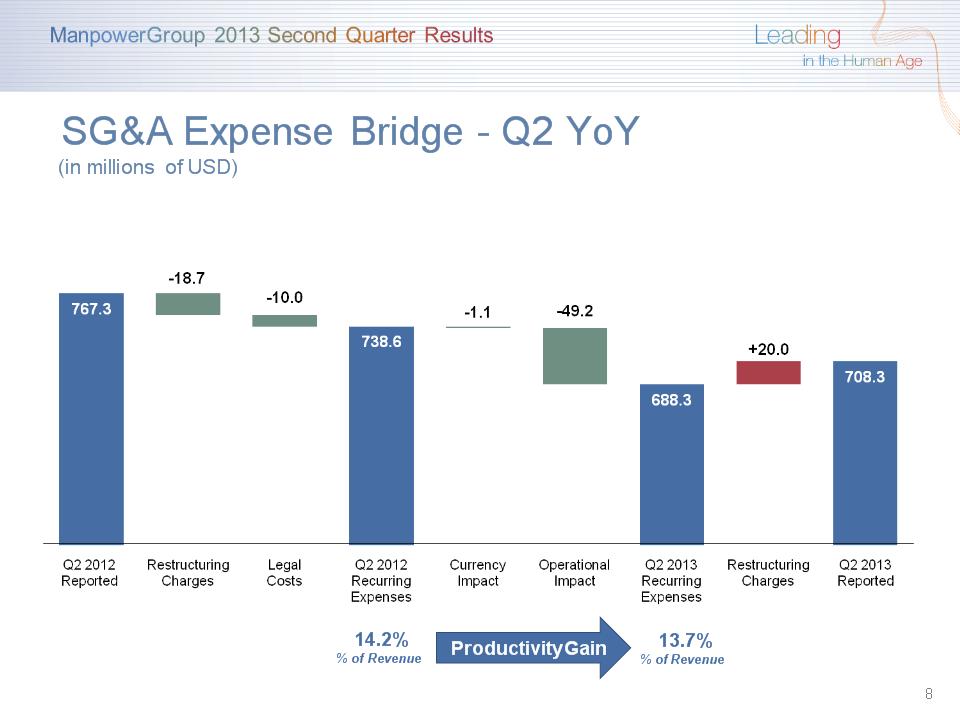
SG&A Expense Bridge – Q2 YoY (in millions of USD) * Productivity Gain 13.7% % of Revenue 14.2% % of Revenue
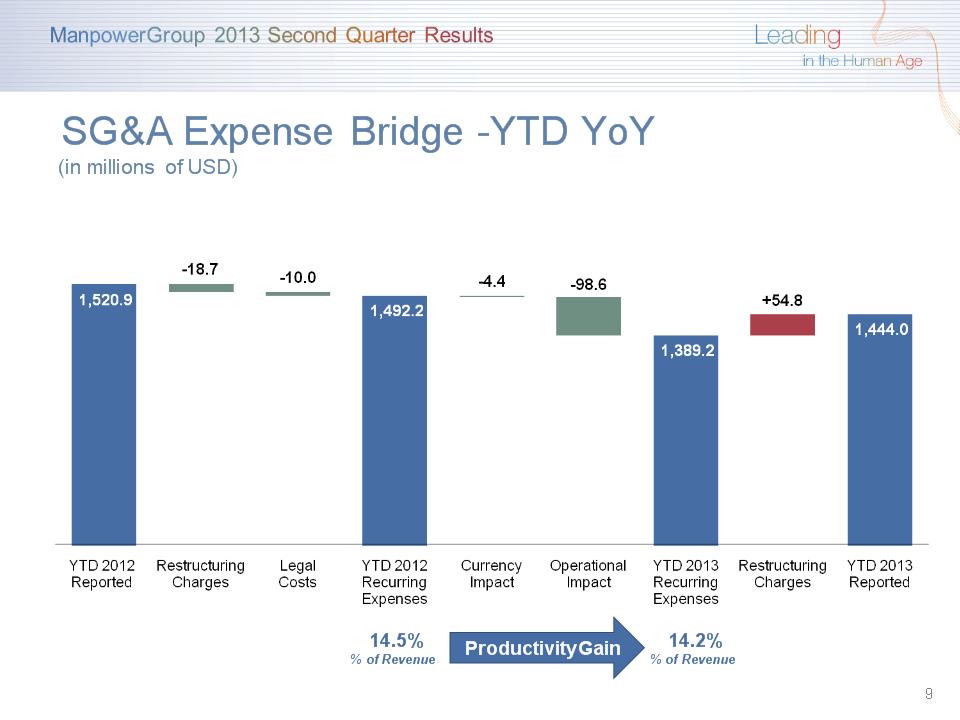
SG&A Expense Bridge –YTD YoY (in millions of USD) * Productivity Gain 14.2% % of Revenue 14.5% % of Revenue
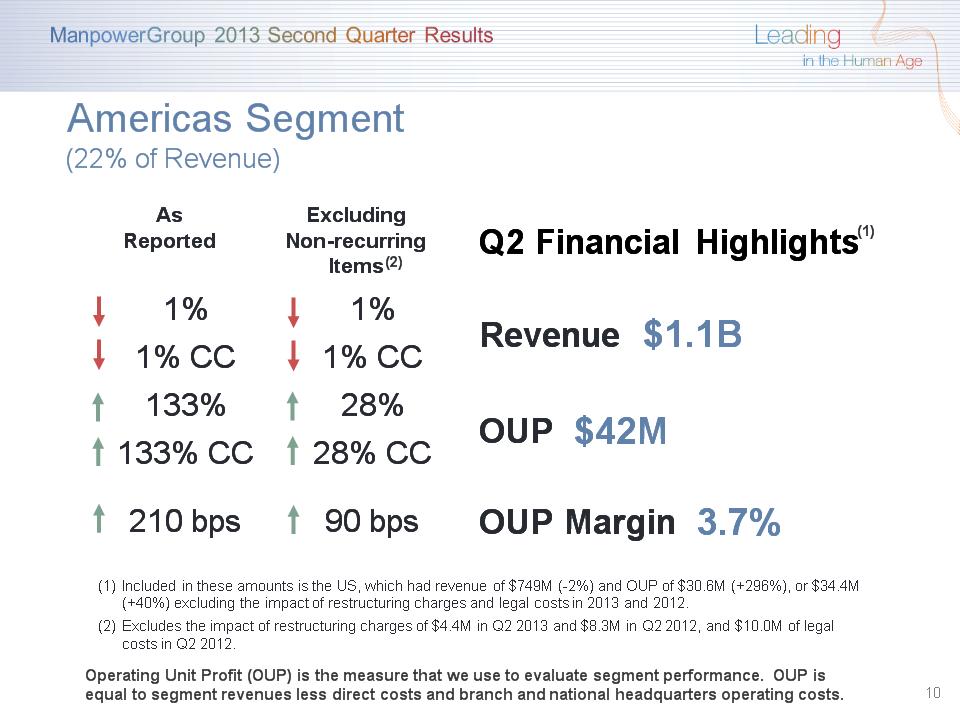
As Reported Excluding Non-recurring Items Q2 Financial Highlights 1% 1% Revenue $1.1B 1% CC 1% CC Revenue $1.1B 133% 28% OUP $42M 133% CC 28% CC OUP $42M 210 bps 90 bps OUP Margin 3.7% * (1) Americas Segment (22% of Revenue) Included in these amounts is the US, which had revenue of $749M (-2%) and OUP of $30.6M (+296%), or $34.4M (+40%) excluding the impact of restructuring charges and legal costs in 2013 and 2012. Excludes the impact of restructuring charges of $4.4M in Q2 2013 and $8.3M in Q2 2012, and $10.0M of legal costs in Q2 2012. Operating Unit Profit (OUP) is the measure that we use to evaluate segment performance. OUP is equal to segment revenues less direct costs and branch and national headquarters operating costs. (2)
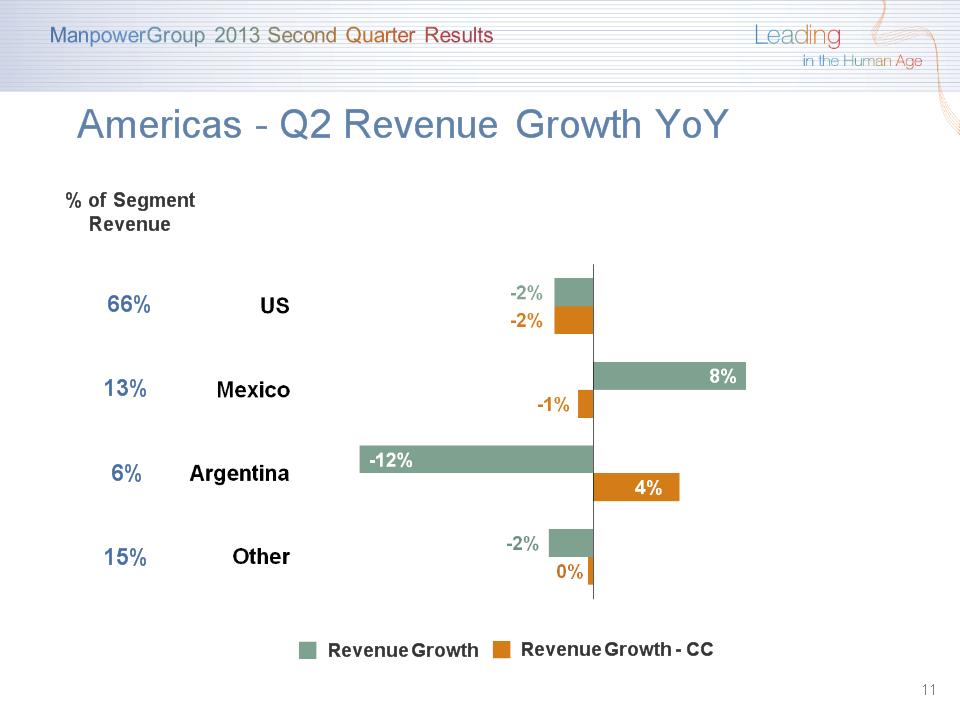
Americas – Q2 Revenue Growth YoY * Revenue Growth - CC Revenue Growth % of Segment Revenue 66% 13% 6% 15%
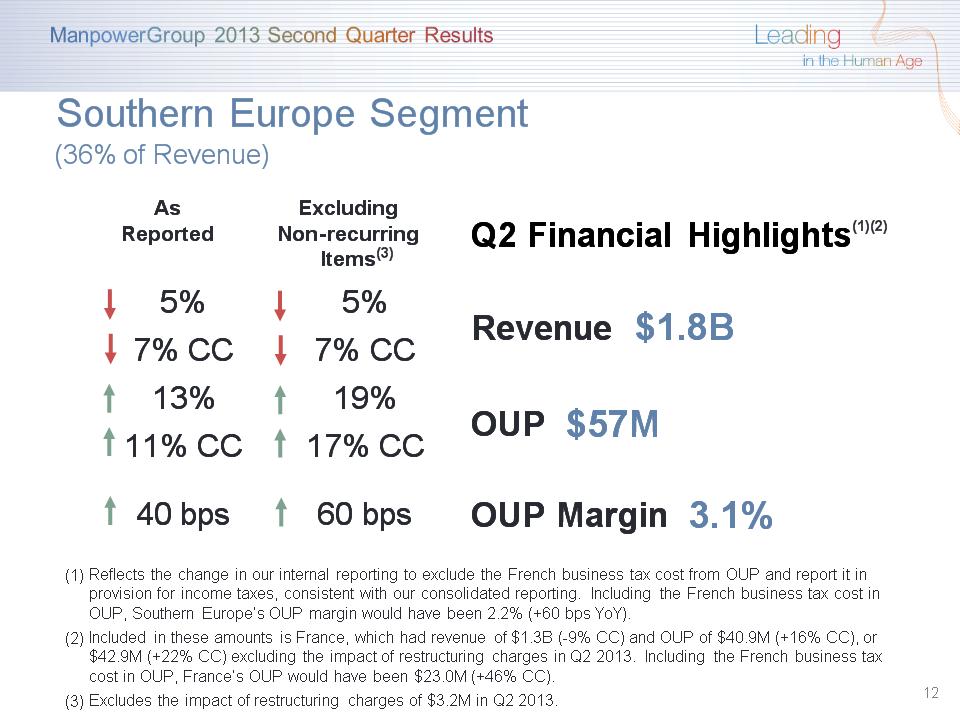
As Reported Excluding Non-recurring Items Q2 Financial Highlights 5% 5% Revenue $1.8B 7% CC 7% CC Revenue $1.8B 13% 19% OUP $57M 11% CC 17% CC OUP $57M 40 bps 60 bps OUP Margin 3.1% * (1)(2) Southern Europe Segment (36% of Revenue) Reflects the change in our internal reporting to exclude the French business tax cost from OUP and report it in provision for income taxes, consistent with our consolidated reporting. Including the French business tax cost in OUP, Southern Europe’s OUP margin would have been 2.2% (+60 bps YoY). Included in these amounts is France, which had revenue of $1.3B (-9% CC) and OUP of $40.9M (+16% CC), or $42.9M (+22% CC) excluding the impact of restructuring charges in Q2 2013. Including the French business tax cost in OUP, France’s OUP would have been $23.0M (+46% CC). Excludes the impact of restructuring charges of $3.2M in Q2 2013. (3)
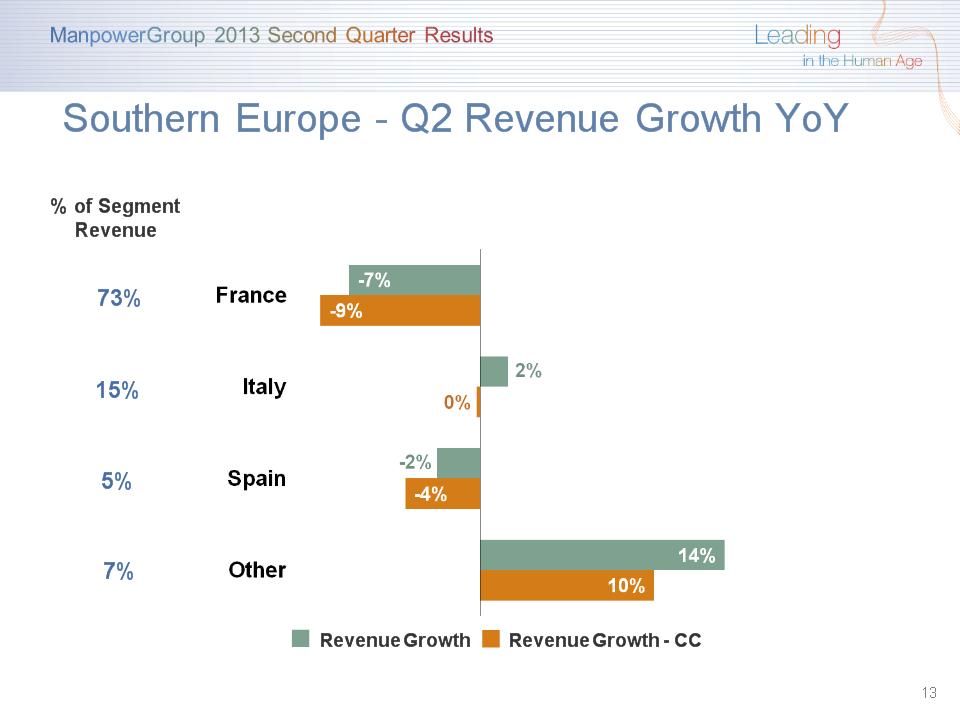
Southern Europe – Q2 Revenue Growth YoY * Revenue Growth - CC Revenue Growth % of Segment Revenue 73% 15% 5% 7%
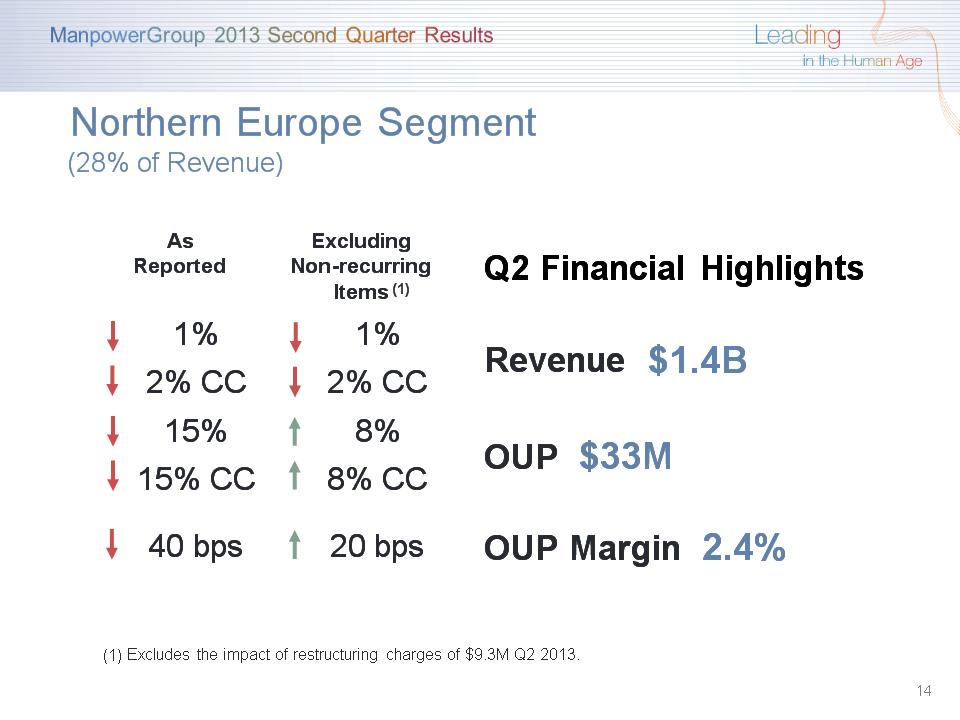
As Reported Excluding Non-recurring Items Q2 Financial Highlights 1% 1% Revenue $1.4B 2% CC 2% CC Revenue $1.4B 15% 8% OUP $33M 15% CC 8% CC OUP $33M 40 bps 20 bps OUP Margin 2.4% * Northern Europe Segment (28% of Revenue) (1) Excludes the impact of restructuring charges of $9.3M Q2 2013.
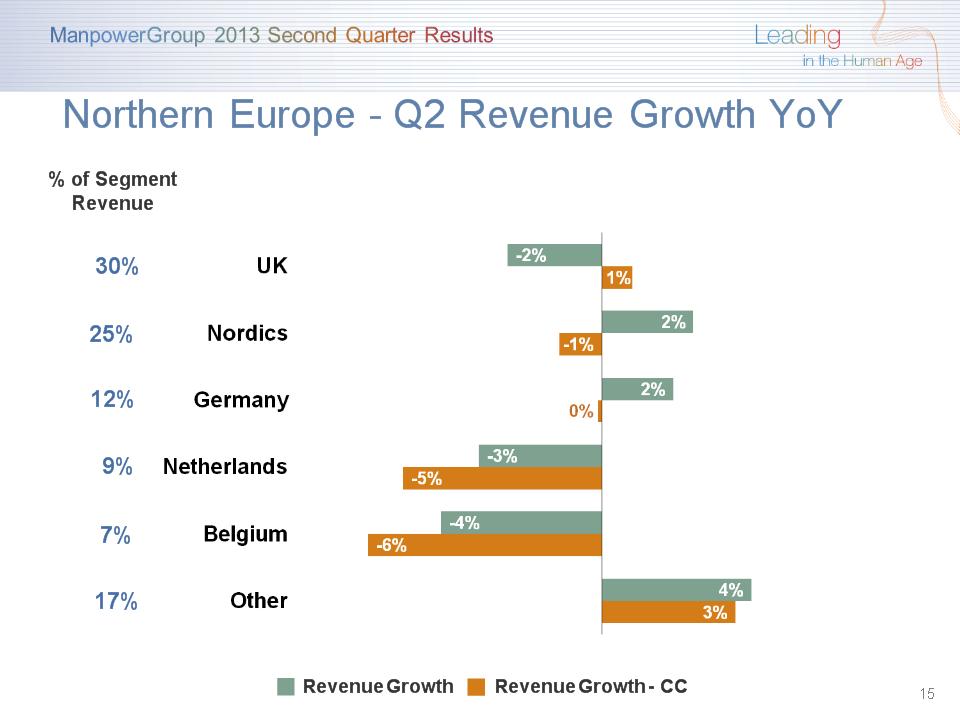
Northern Europe – Q2 Revenue Growth YoY * Revenue Growth - CC Revenue Growth % of Segment Revenue 30% 25% 12% 9% 17% 7%
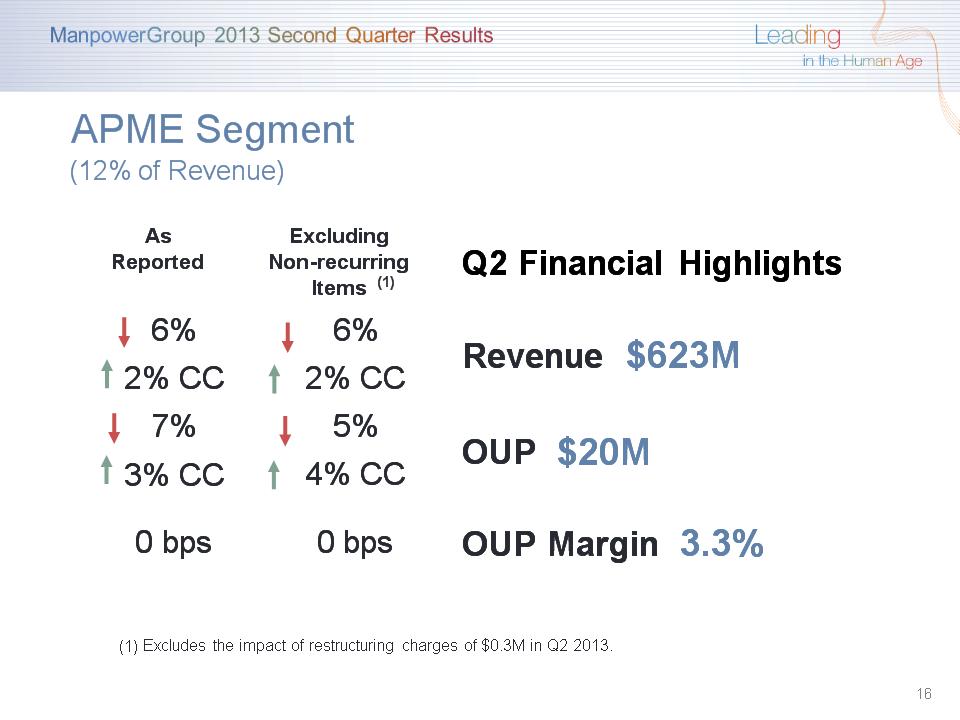
As Reported Excluding Non-recurring Items Q2 Financial Highlights 6% 6% Revenue $623M 2% CC 2% CC Revenue $623M 7% 5% OUP $20M 3% CC 4% CC OUP $20M 0 bps 0 bps OUP Margin 3.3% APME Segment (12% of Revenue) * (1) Excludes the impact of restructuring charges of $0.3M in Q2 2013.
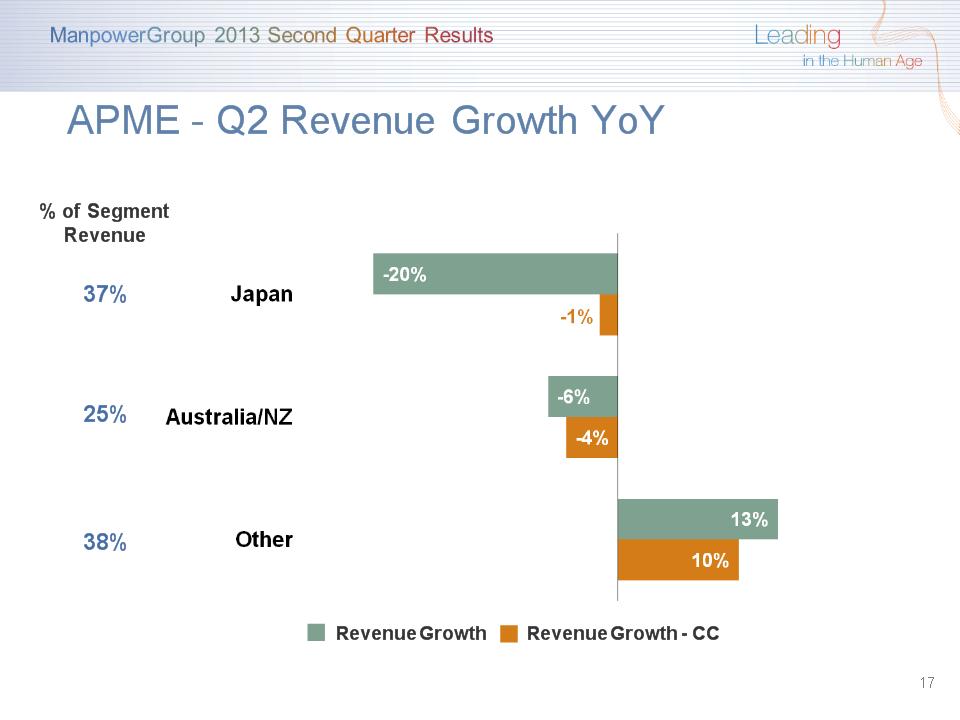
APME – Q2 Revenue Growth YoY * Revenue Growth - CC Revenue Growth % of Segment Revenue 37% 25% 38%
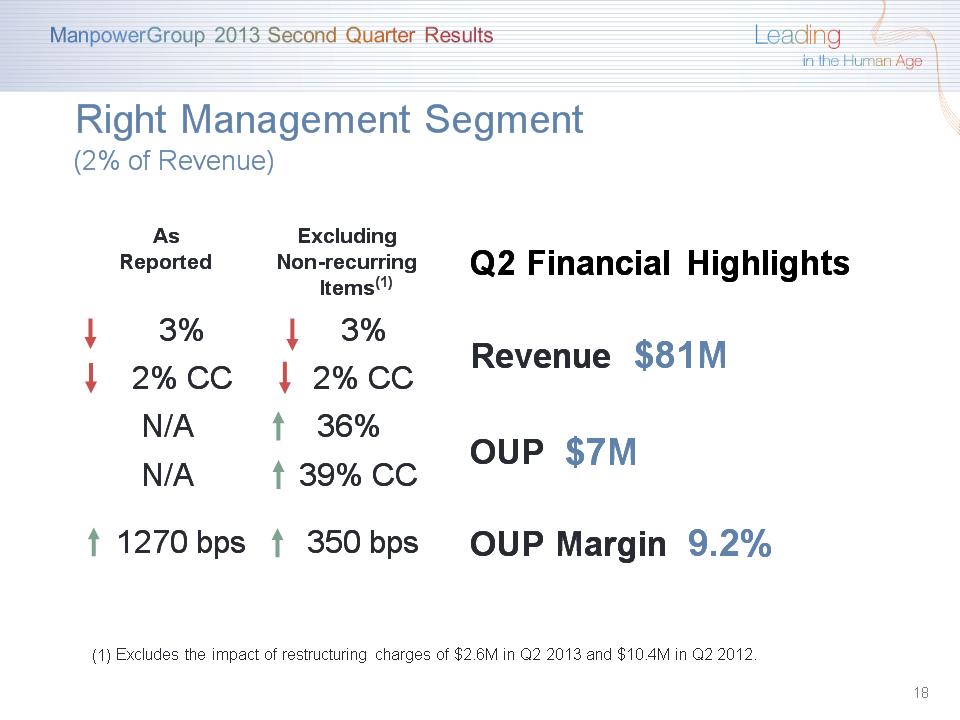
* Right Management Segment (2% of Revenue) As Reported Excluding Non-recurring Items Q2 Financial Highlights 3% 3% Revenue $81M 2% CC 2% CC Revenue $81M N/A 36% OUP $7M N/A 39% CC OUP $7M 1270 bps 350 bps OUP Margin 9.2% (1) Excludes the impact of restructuring charges of $2.6M in Q2 2013 and $10.4M in Q2 2012.
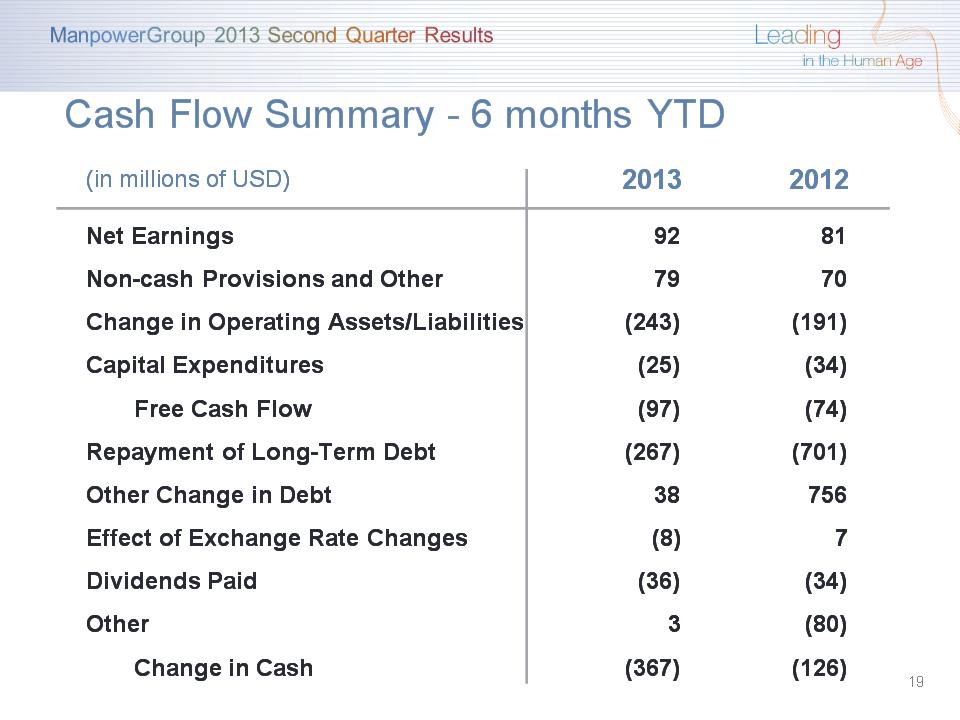
(in millions of USD) 2013 2012 Net Earnings 92 81 Non-cash Provisions and Other 79 70 Change in Operating Assets/Liabilities (243) (191) Capital Expenditures (25) (34) Free Cash Flow (97) (74) Repayment of Long-Term Debt (267) (701) Other Change in Debt 38 756 Effect of Exchange Rate Changes (8) 7 Dividends Paid (36) (34) Other 3 (80) Change in Cash (367) (126) Cash Flow Summary – 6 months YTD *
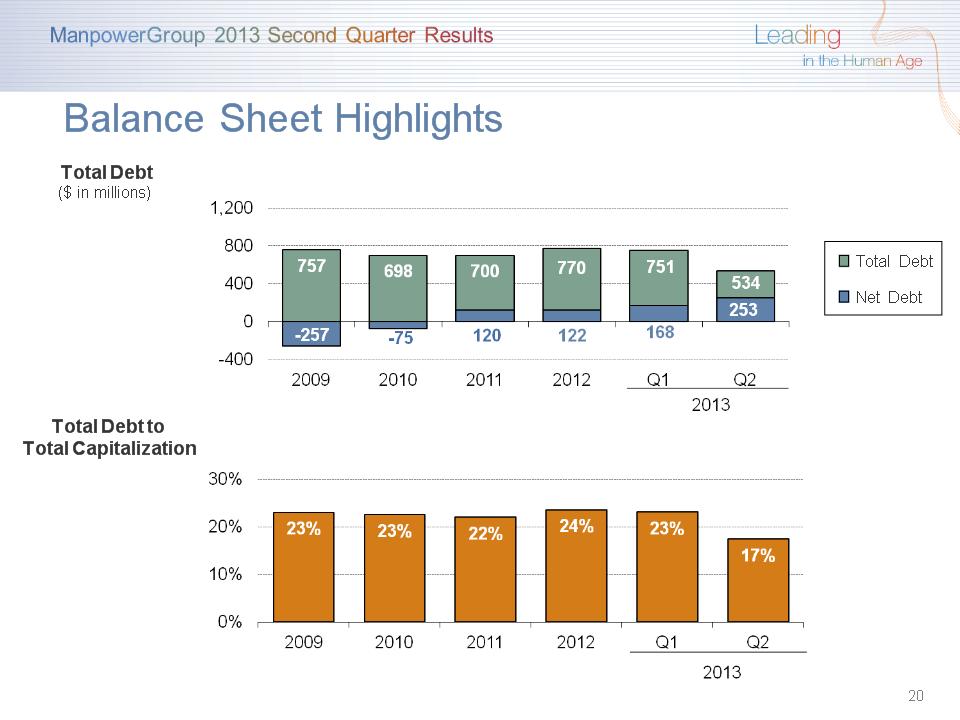
Balance Sheet Highlights * Total Debt ($ in millions) Total Debt to Total Capitalization Total Debt Net Debt
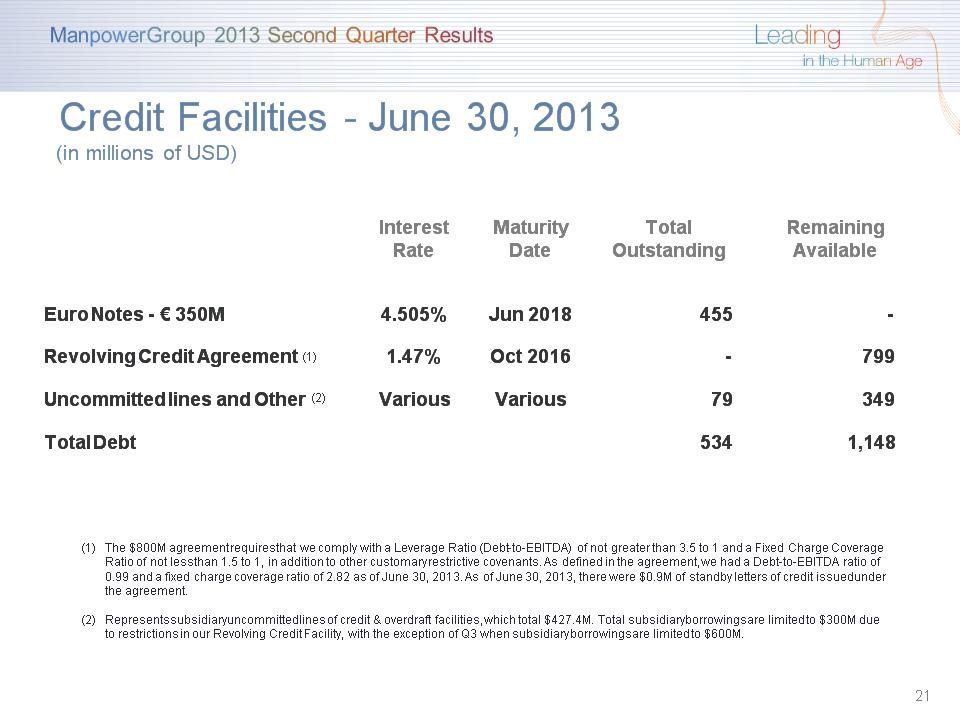
Interest Rate Maturity Date Total Outstanding Remaining Available Euro Notes - € 350M 4.505% Jun 2018 455 - Revolving Credit Agreement 1.47% Oct 2016 - 799 Uncommitted lines and Other Various Various 79 349 Total Debt 534 1,148 Credit Facilities – June 30, 2013 (in millions of USD) * (1) (2) The $800M agreement requires that we comply with a Leverage Ratio (Debt-to-EBITDA) of not greater than 3.5 to 1 and a Fixed Charge Coverage Ratio of not less than 1.5 to 1, in addition to other customary restrictive covenants. As defined in the agreement, we had a Debt-to-EBITDA ratio of 0.99 and a fixed charge coverage ratio of 2.82 as of June 30, 2013. As of June 30, 2013, there were $0.9M of standby letters of credit issued under the agreement. Represents subsidiary uncommitted lines of credit & overdraft facilities, which total $427.4M. Total subsidiary borrowings are limited to $300M due to restrictions in our Revolving Credit Facility, with the exception of Q3 when subsidiary borrowings are limited to $600M.
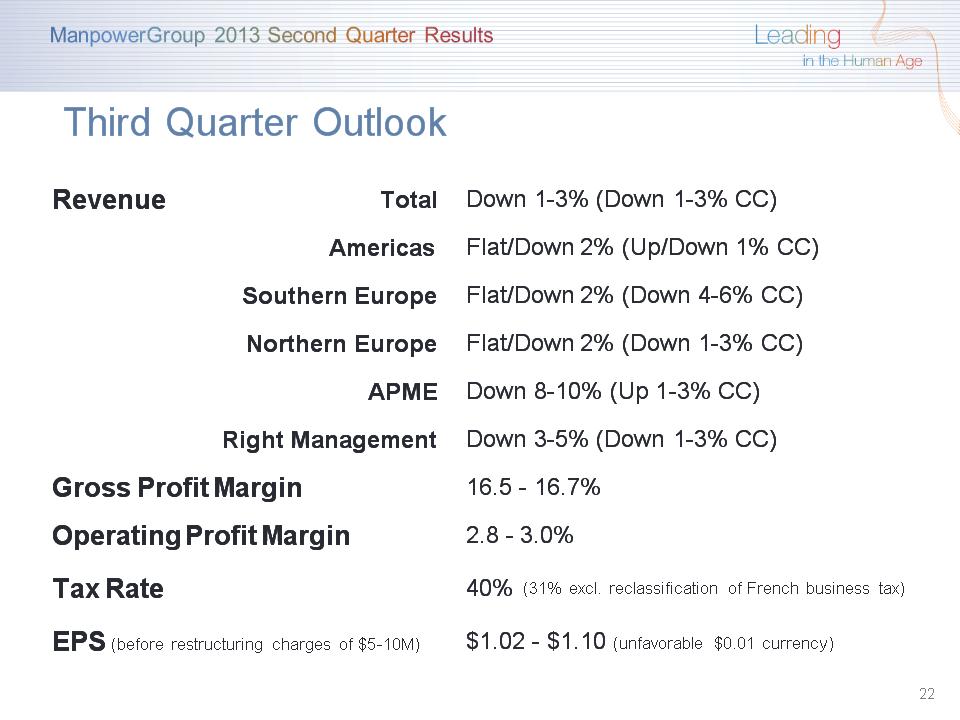
Revenue Total Down 1-3% (Down 1-3% CC) Americas Flat/Down 2% (Up/Down 1% CC) Southern Europe Flat/Down 2% (Down 4-6% CC) Northern Europe Flat/Down 2% (Down 1-3% CC) APME Down 8-10% (Up 1-3% CC) Right Management Right Management Down 3-5% (Down 1-3% CC) Gross Profit Margin Gross Profit Margin 16.5 – 16.7% Operating Profit Margin Operating Profit Margin 2.8 – 3.0% Tax Rate Tax Rate 40% EPS (before restructuring charges of $5-10M) EPS (before restructuring charges of $5-10M) $1.02 – $1.10 (unfavorable $0.01 currency) Third Quarter Outlook * (31% excl. reclassification of French business tax)
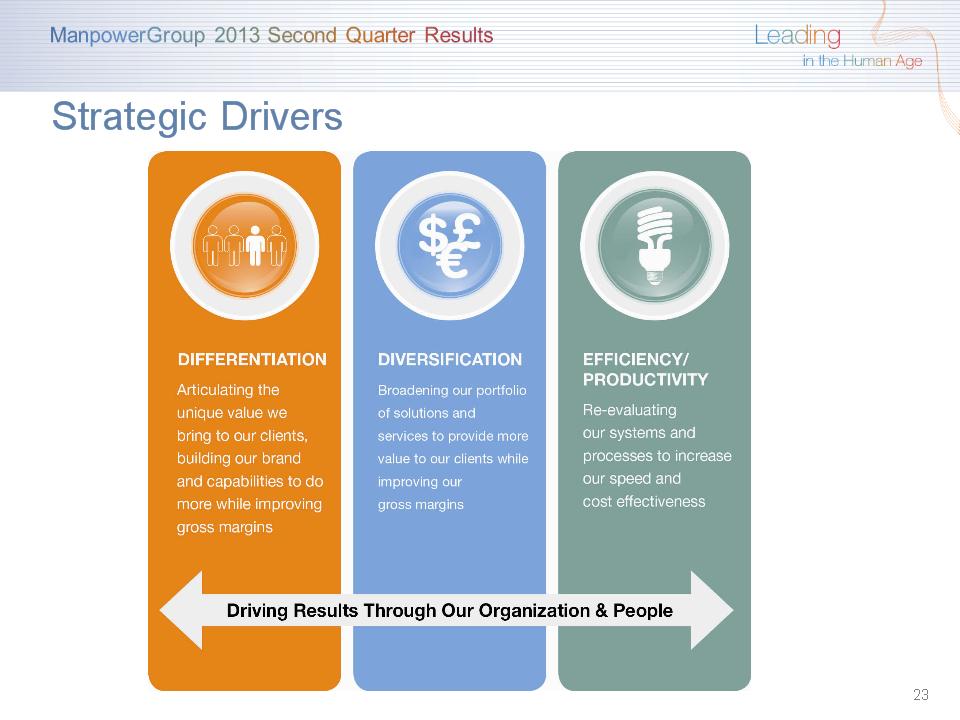
Strategic Drivers *

Questions *