Attached files
| file | filename |
|---|---|
| 8-K - 8-K - ASSOCIATED BANC-CORP | d570746d8k.htm |
| EX-99.1 - EX-99.1 - ASSOCIATED BANC-CORP | d570746dex991.htm |
 Associated Banc-Corp
2Q 2013 Earnings Presentation
July 18, 2013
Exhibit 99.2 |
 Forward-Looking Statements
1 |
 Second Quarter 2013 Highlights
•
Net income available to common shareholders of $47 million or $0.28 per
share •
Return on Tier 1 common equity of 9.9%, compared to 9.3% for Q2 2012
2
Solid
Results
Driven
by
Mortgage
Banking
and
Net
Interest
Income
Growth
Net Income
&
ROT1CE
Balance Sheet
Net Interest Income
&
Net Interest Margin
•
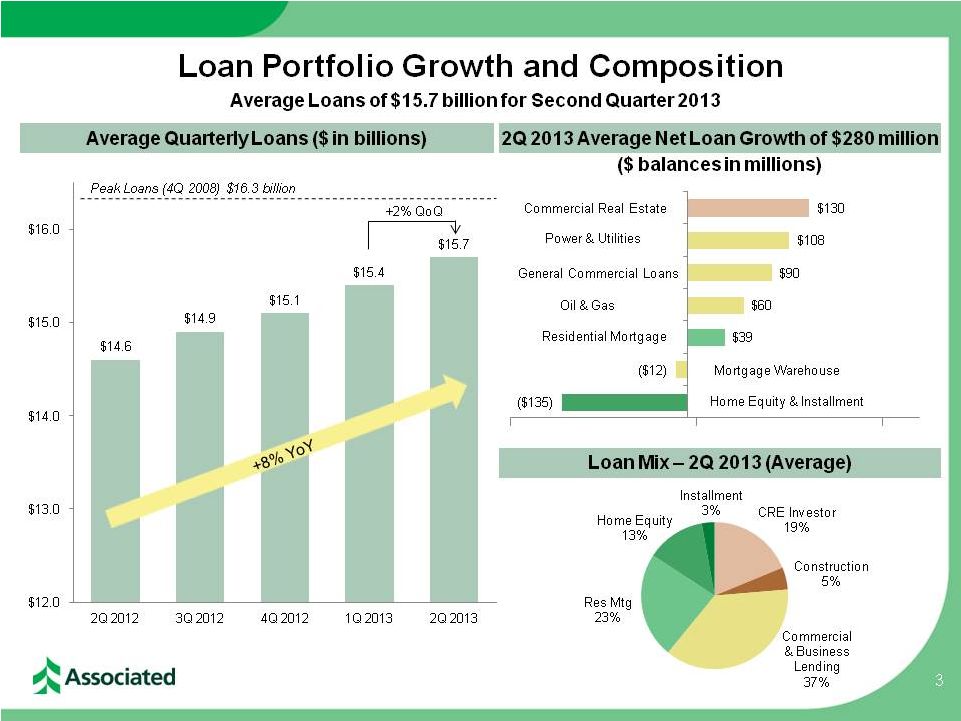
Average loans of $15.7 billion were up $280 million, or 2% from the first
quarter –
Average total commercial loan balances grew 4% from the prior quarter
•
Net interest income of $160 million was up 2% from the first quarter
–
Net interest margin of 3.16% compared to 3.17% in first quarter
Capital
•
Quarterly dividend of $0.08/share
•
Repurchased $30 million of stock during the second quarter
•
Capital ratios remain very strong with a Tier 1 common equity ratio of
11.48%
Noninterest Income
& Expense
•
Noninterest income of $84 million was up 3% from the first quarter
•
Record mortgage banking income of $19 million, up 8% from first quarter
•
Average deposits of $17.1 billion were flat to the first quarter
|
 |
 Growing Net Interest Income While Margin Compresses
4
Yield on Interest-earning Assets
Cost of Interest-bearing Liabilities
Net Interest Income & Net Interest Margin
($ in millions)
3.80%
3.73%
3.70%
3.52%
3.47%
2Q 2012
3Q 2012
4Q 2012
1Q 2013
2Q 2013
0.65%
0.62%
0.51%
0.45%
0.41%
2Q 2012
3Q 2012
4Q 2012
1Q 2013
2Q 2013
$154
$156
$161
$158
$160
3.30%
3.26%
3.32%
3.17%
3.16%
2Q 2012
3Q 2012
4Q 2012
1Q 2013
2Q 2013
Net Interest
Income
Net Interest
Margin |
 Noninterest Income and Expense
5
1
–
Efficiency
ratio
=
Noninterest
expense,
excluding
amortization
of
intangibles,
divided
by
sum
of
taxable
equivalent net interest income plus noninterest income, excluding investment
securities gains, net, and asset
gains,
net.
This
is
a
non-GAAP
financial
measure.
Please
refer
to
our
press
release
tables
for
a
reconciliation of this and other non-GAAP items.
|
 Continued Improvement in Credit Quality Indicators
6
($ in millions)
2Q 2012
3Q 2012
4Q 2012
1Q 2013
2Q 2013
Potential problem loans
$ 410
$ 404
$ 361
$ 344
$ 310
Nonaccruals
$ 318
$ 278
$ 253
$ 225
$ 217
Provision for loan losses
$ 0
$ 0
$ 3
$ 4
$ 4
Net charge offs
$ 24
$ 18
$ 21
$ 14
$ 14
ALLL/Total loans
2.26%
2.11%
1.93%
1.84%
1.76%
ALLL/Nonaccruals
104.65%
113.29%
117.61%
127.27%
127.46%
NPA/Assets
1.62%
1.38%
1.23%
1.12%
1.04%
Nonaccruals/Loans
2.16%
1.86%
1.64%
1.45%
1.38%
NCOs / Avg Loans
0.65%
0.47%
0.55%
0.38%
0.35% |
 Strong Capital Profile & Improving Earnings
7
Tier 1 Common Equity Ratio
Net Income Available to Common & ROT1CE
Net Income Available
to Common
($ in millions)
Return on Tier 1
Common Equity
•
Current capital levels are well in excess of
“well-capitalized”
regulatory benchmarks
–
Existing capital levels are already above
Basel III capital levels |
 2013
Second Half Outlook 8
Loan Trends
•
Quarterly
loan
growth
of
1
–
2%.
•
Continued disciplined loan
pricing
Deposit Trends
Fee Income
Expenses
NIM
Growing the Franchise & Creating Long-Term Shareholder Value
Footprint
Credit
Capital
•
Continued disciplined deposit
pricing
•
Sustained focus on treasury
management solutions to drive
growth in commercial deposits
•
Continued compression over
the second half of the year
•
Modest improvement in core fee-
based revenues with lower net
mortgage banking revenues
•
Flat year-over-year
•
Reduced regulatory costs offset by
continued franchise investments
•
Continuing to invest in our
branches while optimizing our
network
•
Complete Green Bay and Chicago
corporate office consolidations
•
Modest improvement in credit
trends
•
Provision expense to increase
based on quarterly loan growth
•
Disciplined focus on
deploying capital to drive
long-term shareholder value
•
$26 million of 9.25% sub-debt
redeemable in October |