Attached files
| file | filename |
|---|---|
| 8-K - Q2 2013 FORM 8-K - CSX CORP | form8kq22013.htm |
| EX-99.1 - Q2 2013 PRESS RELEASE - CSX CORP | pressrelease_q22013.htm |
Exhibit 99.2

CSX Corporation Announces Second Quarter
Earnings of 52 Cents Per Share
Highlights:
• | Record results in all key financial measures |
• | Growth in merchandise and intermodal volume more than offset declines in coal |
• | Continued strong results in safety, service and efficiency |
JACKSONVILLE, Fla. - July 16, 2013 - CSX Corporation (NYSE: CSX) today announced second-quarter net earnings of $535 million, or $0.52 per share, versus $512 million, or $0.49 per share, in the same period last year. This performance was supported by overall revenue growth; service and efficiency results; and a few additional items, such as tax and real estate, which benefited the quarter.
“CSX continues to drive solid growth in many of its markets and is encouraged by the team's sustained track record of delivering excellent operating performance in a wide range of market conditions,” said Michael J. Ward, chairman, president and chief executive officer. “We remain sharply focused on creating strong, sustained value for customers and shareholders, as the economy appears to be slowly gaining strength.”
Second-quarter revenue was nearly $3.1 billion, a slight increase from the same quarter last year, as strong service resulted in overall increases in volume and pricing. The higher revenues along with efficiency gains helped to deliver second quarter operating income of $963 million and an operating ratio of 68.6 percent.
CSX remains on track to achieve its goal of sustaining a high-60s operating ratio by 2015, while remaining focused on attaining a mid-60s operating ratio longer-term. The company continues to expect annual earnings-per-share growth of 10 to 15 percent on average through 2015 off of the 2013 base, which is now expected to be roughly flat compared to prior year levels.
CSX executives will conduct a quarterly earnings conference call with the investment community on July 17, 2013, at 8:30 a.m. Eastern time. Investors, media and the public may listen to the conference call by dialing 1-888-EARN-CSX (888-327-6279) and asking for the CSX earnings call. Callers outside the U.S., dial 1-773-756-0199. Participants should dial in 10 minutes prior to the call. In conjunction with the call, a live webcast will be accessible and presentation materials will be posted on the company's website at http:// investors.csx.com. Following the earnings call, an internet replay of the presentation will be archived on the company website.
This earnings announcement, as well as additional detailed financial information, is contained in the CSX Quarterly Financial Report available on the company's website at http://investors.csx.com and on Form 8-K with the Securities and Exchange Commission.
CSX, based in Jacksonville, Florida, is a premier transportation company. It provides rail, intermodal and rail-to-truck transload services and solutions to customers across a broad array of markets, including energy, industrial, construction, agricultural, and consumer products. For more than 185 years, CSX has played a critical role in the nation's economic expansion and industrial development. Its network connects every major metropolitan area in the eastern United States, where nearly two-thirds of the nation's population resides. It also links more than 240 short-line railroads and more than 70 ocean, river and lake ports with major population centers and small farming towns alike. More information about CSX Corporation and its subsidiaries is available at www.csx.com. Like us on Facebook (http://www.facebook.com/OfficialCSX) and follow us on Twitter (http://twitter.com/CSX).
Table of Contents | The accompanying unaudited | CSX CORPORATION | CONTACTS: |
financial information should be | 500 Water Street, C900 | ||
read in conjunction with the | Jacksonville, FL 32202 | INVESTOR RELATIONS | |
Company’s most recent | www.csx.com | David Baggs | |
Annual Report on Form 10-K, | (904) 359-4812 | ||
Quarterly Reports on Form | MEDIA | ||
10-Q, and any Current | Melanie Cost | ||
Reports on Form 8-K. | (877) 835-5279 | ||
1
Forward-looking Statements
This information and other statements by the company may contain forward-looking statements within the meaning of the Private Securities Litigation Reform Act with respect to, among other items: projections and estimates of earnings, revenues, margins, volumes, rates, cost-savings, expenses, taxes, liquidity, capital expenditures, dividends, share repurchases or other financial items, statements of management's plans, strategies and objectives for future operations, and management's expectations as to future performance and operations and the time by which objectives will be achieved, statements concerning proposed new services, and statements regarding future economic, industry or market conditions or performance. Forward-looking statements are typically identified by words or phrases such as “will,” “should,” “believe,” “expect,” “anticipate,” “project,” “estimate,” “preliminary” and similar expressions. Forward-looking statements speak only as of the date they are made, and the company undertakes no obligation to update or revise any forward-looking statement. If the company updates any forward-looking statement, no inference should be drawn that the company will make additional updates with respect to that statement or any other forward-looking statements.
Forward-looking statements are subject to a number of risks and uncertainties, and actual performance or results could differ materially from that anticipated by any forward-looking statements. Factors that may cause actual results to differ materially from those contemplated by any forward- looking statements include, among others; (i) the company's success in implementing its financial and operational initiatives; (ii) changes in domestic or international economic, political or business conditions, including those affecting the transportation industry (such as the impact of industry competition, conditions, performance and consolidation); (iii) legislative or regulatory changes; (iv) the inherent business risks associated with safety and security; (v) the outcome of claims and litigation involving or affecting the company; (vi) natural events such as severe weather conditions or pandemic health crises; and (vii) the inherent uncertainty associated with projecting economic and business conditions.
Other important assumptions and factors that could cause actual results to differ materially from those in the forward-looking statements are specified in the company's SEC reports, accessible on the SEC's website at www.sec.gov and the company's website at www.csx.com.
2
CSX Corporation
CONSOLIDATED INCOME STATEMENTS (Unaudited)
(Dollars in millions, except per share amounts)
Quarters Ended | Six Months Ended | ||||||||||||||||||||||
Jun. 28, 2013 | Jun. 29, 2012 | $ Change | % Change | Jun. 28, 2013 | Jun. 29, 2012 | $ Change | % Change | ||||||||||||||||
Revenue | $ | 3,069 | $ | 3,012 | $ | 57 | 2 | % | $ | 6,027 | $ | 5,978 | $ | 49 | 1 | % | |||||||
Expense | |||||||||||||||||||||||
Labor and Fringe | 777 | 744 | (33 | ) | (4 | ) | 1,544 | 1,514 | (30 | ) | (2 | ) | |||||||||||
Materials, Supplies and Other | 560 | 550 | (10 | ) | (2 | ) | 1,067 | 1,092 | 25 | 2 | |||||||||||||
Fuel | 397 | 410 | 13 | 3 | 841 | 854 | 13 | 2 | |||||||||||||||
Depreciation | 276 | 263 | (13 | ) | (5 | ) | 546 | 520 | (26 | ) | (5 | ) | |||||||||||
Equipment and Other Rents | 96 | 102 | 6 | 6 | 191 | 199 | 8 | 4 | |||||||||||||||
Total Expense | 2,106 | 2,069 | (37 | ) | (2 | ) | 4,189 | 4,179 | (10 | ) | — | ||||||||||||
Operating Income | 963 | 943 | 20 | 2 | 1,838 | 1,799 | 39 | 2 | |||||||||||||||
Interest Expense | (140 | ) | (139 | ) | (1 | ) | (1 | ) | (287 | ) | (283 | ) | (4 | ) | (1 | ) | |||||||
Other Income - Net | 9 | 5 | 4 | 80 | 6 | 9 | (3 | ) | (33 | ) | |||||||||||||
Earnings Before Income Taxes | 832 | 809 | 23 | 3 | 1,557 | 1,525 | 32 | 2 | |||||||||||||||
Income Tax Expense (a) | (297 | ) | (297 | ) | — | — | (563 | ) | (564 | ) | 1 | — | |||||||||||
Net Earnings | $ | 535 | $ | 512 | $ | 23 | 4 | % | $ | 994 | $ | 961 | $ | 33 | 3 | % | |||||||
Operating Ratio | 68.6 | % | 68.7 | % | 69.5 | % | 69.9 | % | |||||||||||||||
Per Common Share | |||||||||||||||||||||||
Net Earnings Per Share, Assuming Dilution | $ | 0.52 | $ | 0.49 | $ | 0.03 | 6 | % | $ | 0.97 | $ | 0.92 | $ | 0.05 | 5 | % | |||||||
Average Shares Outstanding, Assuming Dilution (millions) | 1,023 | 1,043 | 1,023 | 1,046 | |||||||||||||||||||
Cash Dividends Paid Per Common Share | $ | 0.15 | $ | 0.14 | $ | 0.29 | $ | 0.26 | |||||||||||||||
3
CSX Corporation
CONDENSED CONSOLIDATED BALANCE SHEETS
(Dollars in millions)
(Unaudited) | ||||||
Jun. 28, 2013 | Dec. 28, 2012 | |||||
ASSETS | ||||||
Cash, Cash Equivalents and Short-term Investments | $ | 1,017 | $ | 1,371 | ||
Other Current Assets | 1,472 | 1,430 | ||||
Properties - Net | 26,599 | 26,050 | ||||
Investment in Affiliates and Other Companies | 1,228 | 1,206 | ||||
Other Long-term Assets | 565 | 514 | ||||
Total Assets | $ | 30,881 | $ | 30,571 | ||
LIABILITIES AND SHAREHOLDERS' EQUITY | ||||||
Current Maturities of Long-term Debt | $ | 564 | $ | 780 | ||
Other Current Liabilities | 1,854 | 1,847 | ||||
Long-term Debt | 8,811 | 9,052 | ||||
Deferred Income Taxes | 8,313 | 8,096 | ||||
Other Long-term Liabilities | 1,677 | 1,794 | ||||
Total Liabilities | 21,219 | 21,569 | ||||
Total Shareholders' Equity | 9,662 | 9,002 | ||||
Total Liabilities and Shareholders' Equity | $ | 30,881 | $ | 30,571 | ||
4
CSX Corporation
CONDENSED CONSOLIDATED CASH FLOW STATEMENTS (Unaudited)
(Dollars in millions)
Six Months Ended | ||||||
Jun. 28, 2013 | Jun. 29, 2012 | |||||
OPERATING ACTIVITIES | ||||||
Net Earnings | $ | 994 | $ | 961 | ||
Depreciation | 546 | 520 | ||||
Deferred Income Taxes | 172 | 300 | ||||
Contributions to Qualified Pension Plans | — | (275 | ) | |||
Other Operating Activities - Net | (133 | ) | (215 | ) | ||
Net Cash Provided by Operating Activities | 1,579 | 1,291 | ||||
INVESTING ACTIVITIES | ||||||
Property Additions | (1,085 | ) | (1,223 | ) | ||
Purchase of Short-term Investments | (690 | ) | (58 | ) | ||
Proceeds from Sales of Short-term Investments | 904 | 546 | ||||
Other Investing Activities | (50 | ) | 6 | |||
Net Cash Used in Investing Activities | (921 | ) | (729 | ) | ||
FINANCING ACTIVITIES | ||||||
Long-term Debt Issued | — | 300 | ||||
Long-term Debt Repaid | (455 | ) | (455 | ) | ||
Dividends Paid | (296 | ) | (270 | ) | ||
Shares Repurchased (b) | (95 | ) | (300 | ) | ||
Other Financing Activities - Net | 18 | 22 | ||||
Net Cash Used in Financing Activities | (828 | ) | (703 | ) | ||
Net Decrease in Cash and Cash Equivalents | (170 | ) | (141 | ) | ||
CASH AND CASH EQUIVALENTS | ||||||
Cash and Cash Equivalents at Beginning of Period | 784 | 783 | ||||
Cash and Cash Equivalents at End of Period | $ | 614 | $ | 642 | ||
Certain prior year data has been reclassified to conform to the current presentation.
5
CSX Corporation
NOTES TO CONSOLIDATED FINANCIAL STATEMENTS (Unaudited)
Income Statement
a) | Income Tax Expense: During second quarter 2013, the Company recorded an income tax benefit of $17 million, or $0.02 per share, as a result of a deferred tax adjustment, the resolution of certain tax matters and a change in state tax legislation. During second quarter 2012, the Company recorded an income tax benefit of $9 million, or $0.01 per share, as a result of the resolution of certain tax matters as well as changes in state tax legislation. |
Cash Flow Statement
b) | Share repurchases: There were 4 million shares repurchased for $95 million and 14 million shares repurchased for $300 million during the six months of 2013 and 2012, respectively. |
6
CSX Corporation
VOLUME AND REVENUE (Unaudited) | |||||||||||||||||||||||||||
Volume (Thousands of units); Revenue (Dollars in millions); Revenue Per Unit (Dollars) | |||||||||||||||||||||||||||
Quarters Ended June 28, 2013 and June 29, 2012 | |||||||||||||||||||||||||||
Volume | Revenue | Revenue Per Unit | |||||||||||||||||||||||||
2013 | 2012 | % Change | 2013 | 2012 | % Change | 2013 | 2012 | % Change | |||||||||||||||||||
Agricultural | |||||||||||||||||||||||||||
Agricultural Products | 95 | 101 | (7 | )% | $ | 248 | $ | 261 | (5 | )% | $ | 2,611 | $ | 2,584 | 2 | % | |||||||||||
Phosphates and Fertilizers | 86 | 79 | 9 | 135 | 125 | 8 | 1,570 | 1,582 | (1 | ) | |||||||||||||||||
Food and Consumer | 25 | 25 | (1 | ) | 69 | 68 | 1 | 2,760 | 2,720 | 2 | |||||||||||||||||
Industrial | |||||||||||||||||||||||||||
Chemicals | 133 | 120 | 11 | 476 | 430 | 11 | 3,579 | 3,583 | — | ||||||||||||||||||
Automotive | 113 | 111 | 2 | 318 | 302 | 5 | 2,814 | 2,721 | 3 | ||||||||||||||||||
Metals | 66 | 67 | (2 | ) | 163 | 163 | — | 2,470 | 2,433 | 2 | |||||||||||||||||
Housing and Construction | |||||||||||||||||||||||||||
Forest Products | 74 | 71 | 3 | 195 | 184 | 6 | 2,635 | 2,592 | 3 | ||||||||||||||||||
Minerals(a) | 75 | 70 | 7 | 115 | 107 | 7 | 1,533 | 1,529 | — | ||||||||||||||||||
Waste and Equipment(a) | 35 | 36 | (2 | ) | 63 | 71 | (11 | ) | 1,800 | 1,972 | (10 | ) | |||||||||||||||
Total Merchandise | 702 | 680 | 3 | 1,782 | 1,711 | 4 | 2,538 | 2,516 | 1 | ||||||||||||||||||
Coal | 310 | 331 | (6 | ) | 770 | 820 | (6 | ) | 2,484 | 2,477 | — | ||||||||||||||||
Intermodal | 644 | 629 | 2 | 425 | 408 | 4 | 660 | 649 | 2 | ||||||||||||||||||
Other | — | — | — | 92 | 73 | 25 | — | — | — | ||||||||||||||||||
Total | 1,656 | 1,640 | 1 | % | $ | 3,069 | $ | 3,012 | 2 | % | $ | 1,853 | $ | 1,837 | 1 | % | |||||||||||
Six Months Ended June 28, 2013 and June 29, 2012 | |||||||||||||||||||||||||||
Volume | Revenue | Revenue Per Unit | |||||||||||||||||||||||||
2013 | 2012 | % Change | 2013 | 2012 | % Change | 2013 | 2012 | % Change | |||||||||||||||||||
Agricultural | |||||||||||||||||||||||||||
Agricultural Products | 190 | 209 | (10 | )% | $ | 489 | $ | 536 | (9 | )% | $ | 2,574 | $ | 2,565 | 1 | % | |||||||||||
Phosphates and Fertilizers | 170 | 159 | 7 | 279 | 256 | 9 | 1,641 | 1,610 | 2 | ||||||||||||||||||
Food and Consumer | 49 | 50 | (2 | ) | 137 | 135 | 1 | 2,796 | 2,700 | 3 | |||||||||||||||||
Industrial | |||||||||||||||||||||||||||
Chemicals | 263 | 237 | 11 | 944 | 845 | 12 | 3,589 | 3,565 | 1 | ||||||||||||||||||
Automotive | 218 | 216 | 1 | 611 | 583 | 5 | 2,803 | 2,699 | 4 | ||||||||||||||||||
Metals | 132 | 139 | (5 | ) | 324 | 334 | (3 | ) | 2,455 | 2,403 | 2 | ||||||||||||||||
Housing and Construction | |||||||||||||||||||||||||||
Forest Products | 147 | 144 | 2 | 384 | 365 | 5 | 2,612 | 2,535 | 3 | ||||||||||||||||||
Minerals(a) | 132 | 127 | 4 | 211 | 201 | 5 | 1,598 | 1,583 | 1 | ||||||||||||||||||
Waste and Equipment(a) | 67 | 70 | (4 | ) | 120 | 131 | (9 | ) | 1,791 | 1,871 | (5 | ) | |||||||||||||||
Total Merchandise | 1,368 | 1,351 | 1 | 3,499 | 3,386 | 3 | 2,558 | 2,506 | 2 | ||||||||||||||||||
Coal | 607 | 662 | (8 | ) | 1,496 | 1,652 | (9 | ) | 2,465 | 2,495 | (1 | ) | |||||||||||||||
Intermodal | 1,259 | 1,229 | 2 | 829 | 797 | 4 | 658 | 648 | 2 | ||||||||||||||||||
Other | — | — | — | 203 | 143 | 42 | — | — | — | ||||||||||||||||||
Total | 3,234 | 3,242 | — | % | $ | 6,027 | $ | 5,978 | 1 | % | $ | 1,864 | $ | 1,844 | 1 | % | |||||||||||
(a) Prior periods have been reclassified to conform to current presentation.
7
CSX Corporation
Volume and Revenue
Volume increased 1% year-over-year as growth in merchandise and intermodal more than offset lower coal volume. Total revenue increased by 2% year-over-year driven by volume growth and higher revenue per unit resulting from pricing gains across most markets.
Merchandise
Agricultural Sector
Agricultural Products - Volume decreased due to lower shipments of feed grain, soybeans and ethanol. Feed grain and soybean shipments were impacted by low supplier inventories caused by last year's drought and increased competition from imports. Ethanol shipments declined as a result of lower gasoline demand in the U.S. and reduced production.
Phosphates and Fertilizers - Volume increased as the reopening of a customer mine and higher demand led to more short haul phosphate rock shipments to fertilizer production facilities. Fertilizer volume also grew as low crop inventories and strong crop prices led to an increase in application by farms to improve crop yields.
Food and Consumer - Volume declined due to a reduction in alcoholic beverage shipments. This reduction was primarily driven by consolidation within a customer's distribution network that resulted in lower shipments for CSX.
Industrial Sector
Chemicals - Volume growth was driven by an increase in energy-related shipments that include crude oil, liquefied petroleum gas (LPG) and frac sand. The rise in crude oil shipments was due to increased supply of low-cost crude from shale drilling activity, resulting in new shipments to east coast refineries.
Automotive - Automotive volume grew as North American light vehicle production increased 5% year-over-year. This increase was partially offset by competitive losses that occurred earlier this year in both automotive parts and finished vehicles.
Metals - Volume decreased due to lower shipments of sheet steel that were negatively impacted by competitive losses that occurred earlier this year and capacity reductions from mill closures.
Housing and Construction Sector
Forest Products - Volume growth was led by an increase in building product shipments due to the continued recovery of the residential housing market.
Minerals - Volume increased in aggregates (which include crushed stone, sand and gravel) due to the continued recovery in construction activity and modal conversion growth with an existing customer.
Waste and Equipment - Volume decreased as military and machinery shipments were negatively impacted by government budget constraints and the expiration of the federal tax credit on the production of wind energy machinery. Partially offsetting these decreases was growth in waste shipments which was driven by an increase in construction debris due to the continued recovery in construction activity and environmental remediation projects.
Coal
Export declines were driven by decreased shipments of U.S. thermal coal, primarily to Europe, and increased competition from other countries due to global oversupply. Partially offsetting this decrease, shipments of domestic coal increased due to higher coal generation as natural gas prices increased.
Intermodal
Domestic volume growth was driven by highway-to-rail conversions, expanded service offerings and growth with existing customers. International volume was up slightly as new services were partially offset by volume lost as a result of carrier port shifts.
Other
Other revenue increased year over year primarily due to higher revenue of $16 million from customers who did not meet minimum contractual volumes.
8
CSX Corporation
EXPENSE
Expenses in the second quarter 2013 increased $37 million from the prior year's second quarter. Significant variances are described below.
Labor and Fringe expense increased $33 million due to the following:
• | Incentive compensation costs were $24 million higher reflecting higher expected award payouts. |
• | Efficiencies, despite volume growth, reduced labor costs $19 million due to the year-over-year improvement in crew starts and overtime, reduced headcount, as well as training savings due to lower hiring. |
• | Wage expense increased $18 million as a result of inflation. |
• | Various other costs increased $10 million during the quarter. |
Materials, Supplies and Other expense increased $10 million due to the following:
• | Gains on operating rail properties increased year-over-year by $16 million. During the quarter, a gain of $22 million was recognized due to a non-monetary exchange of easements and rail assets. Additionally, the recognition of the deferred gain from the 2011 sale of an operating rail corridor to the state of Florida decreased $6 million year-over-year. |
• | Inflation increased $10 million. |
• | Train accidents and various other costs increased $16 million during the quarter, primarily driven by costs related to derailments, despite the improvement of the FRA train accident frequency rate. |
Fuel expense decreased $13 million due to improved efficiency and a lower average price per gallon of 2% for locomotive fuel. (See Fuel Statistics table below)
Depreciation expense increased $13 million due to larger asset base.
FUEL STATISTICS | ||||||||||||||||||||
Quarters Ended | Six Months Ended | |||||||||||||||||||
Jun. 28, 2013 | Jun. 29, 2012 | Change | Jun. 28, 2013 | Jun. 29, 2012 | Change | |||||||||||||||
Estimated Locomotive Fuel Consumption (Millions of gallons) | 118.8 | 120.0 | 1.2 | 244.1 | 250.0 | 5.9 | ||||||||||||||
Price per Gallon (Dollars) | $ | 3.08 | $ | 3.14 | $ | 0.06 | $ | 3.17 | $ | 3.14 | $ | (0.03 | ) | |||||||
Total Locomotive Fuel Expense (Dollars in millions) | $ | 366 | $ | 377 | $ | 11 | $ | 774 | $ | 786 | $ | 12 | ||||||||
Total Non-Locomotive Fuel Expense (Dollars in millions) | 31 | 33 | 2 | 67 | 68 | 1 | ||||||||||||||
Total Fuel Expense (Dollars in millions) | $ | 397 | $ | 410 | $ | 13 | $ | 841 | $ | 854 | $ | 13 | ||||||||
EMPLOYEE COUNTS (Estimated) | ||||||||
2013 | 2012 | Change | ||||||
April | 31,187 | 32,365 | (1,178 | ) | ||||
May | 31,308 | 32,457 | (1,149 | ) | ||||
June | 31,370 | 32,445 | (1,075 | ) | ||||
Average | 31,288 | 32,422 | (1,134 | ) | ||||
9
CSX Corporation
OPERATING STATISTICS (Estimated)
Quarters Ended | Six Months Ended | |||||||||||||
Jun. 28, 2013 | Jun. 29, 2012 | Improvement (Decline) % | Jun. 28, 2013 | Jun. 29, 2012 | Improvement (Decline) % | |||||||||
Coal (Millions of Tons) | ||||||||||||||
Domestic | ||||||||||||||
Utility | 17.0 | 15.6 | 9 | % | 33.2 | 34.4 | (3 | )% | ||||||
Coke, Iron Ore and Other | 6.4 | 6.7 | (4 | ) | 11.1 | 12.4 | (10 | ) | ||||||
Total Domestic | 23.4 | 22.3 | 5 | 44.3 | 46.8 | (5 | ) | |||||||
Export | ||||||||||||||
Metallurgical | 6.4 | 5.9 | 8 | 13.4 | 12.2 | 10 | ||||||||
Thermal | 5.1 | 8.8 | (42 | ) | 10.4 | 15.0 | (31 | ) | ||||||
Total Export | 11.5 | 14.7 | (22 | ) | 23.8 | 27.2 | (13 | ) | ||||||
Total Coal | 34.9 | 37.0 | (6 | )% | 68.1 | 74.0 | (8 | )% | ||||||
Revenue Ton-Miles (Billions) | ||||||||||||||
Merchandise | 34.2 | 33.3 | 3 | % | 67.5 | 67.1 | 1 | % | ||||||
Coal | 16.9 | 16.9 | — | 33.1 | 34.3 | (3 | ) | |||||||
Intermodal | 6.3 | 6.1 | 3 | 12.2 | 11.9 | 3 | ||||||||
Total | 57.4 | 56.3 | 2 | % | 112.8 | 113.3 | — | % | ||||||
Gross Ton-Miles (Billions) | ||||||||||||||
Total Gross Ton-Miles | 105.6 | 103.7 | 2 | % | 207.9 | 208.0 | — | % | ||||||
(Excludes locomotive gross ton-miles) | ||||||||||||||
Safety and Service Measurements | ||||||||||||||
FRA Personal Injury Frequency Index | 0.93 | 0.65 | (43 | )% | 0.81 | 0.72 | (13 | )% | ||||||
(Number of FRA-reportable injuries per 200,000 man-hours) | ||||||||||||||
FRA Train Accident Rate | 1.81 | 1.95 | 7 | % | 1.71 | 2.10 | 19 | % | ||||||
(Number of FRA-reportable train accidents per million train miles) | ||||||||||||||
On-Time Train Originations | 91 | % | 89 | % | 2 | % | 91 | % | 89 | % | 2 | % | ||
On-Time Destination Arrivals | 82 | % | 78 | % | 5 | % | 84 | % | 77 | % | 9 | % | ||
Train Velocity (Miles per hour) | 23.0 | 22.4 | 3 | % | 23.3 | 22.4 | 4 | % | ||||||
Dwell (Hours) | 21.9 | 23.2 | 6 | % | 22.1 | 23.6 | 6 | % | ||||||
Cars-On-Line | 181,929 | 189,974 | 4 | % | 182,572 | 192,214 | 5 | % | ||||||
Resources | Increase(Decrease) % | |||||||||||||
Route Miles | 20,777 | 20,830 | — | % | ||||||||||
Locomotives (Owned and long-term leased) | 4,212 | 4,177 | 1 | % | ||||||||||
Freight Cars (Owned and long-term leased) | 68,983 | 70,000 | (1 | )% | ||||||||||
10
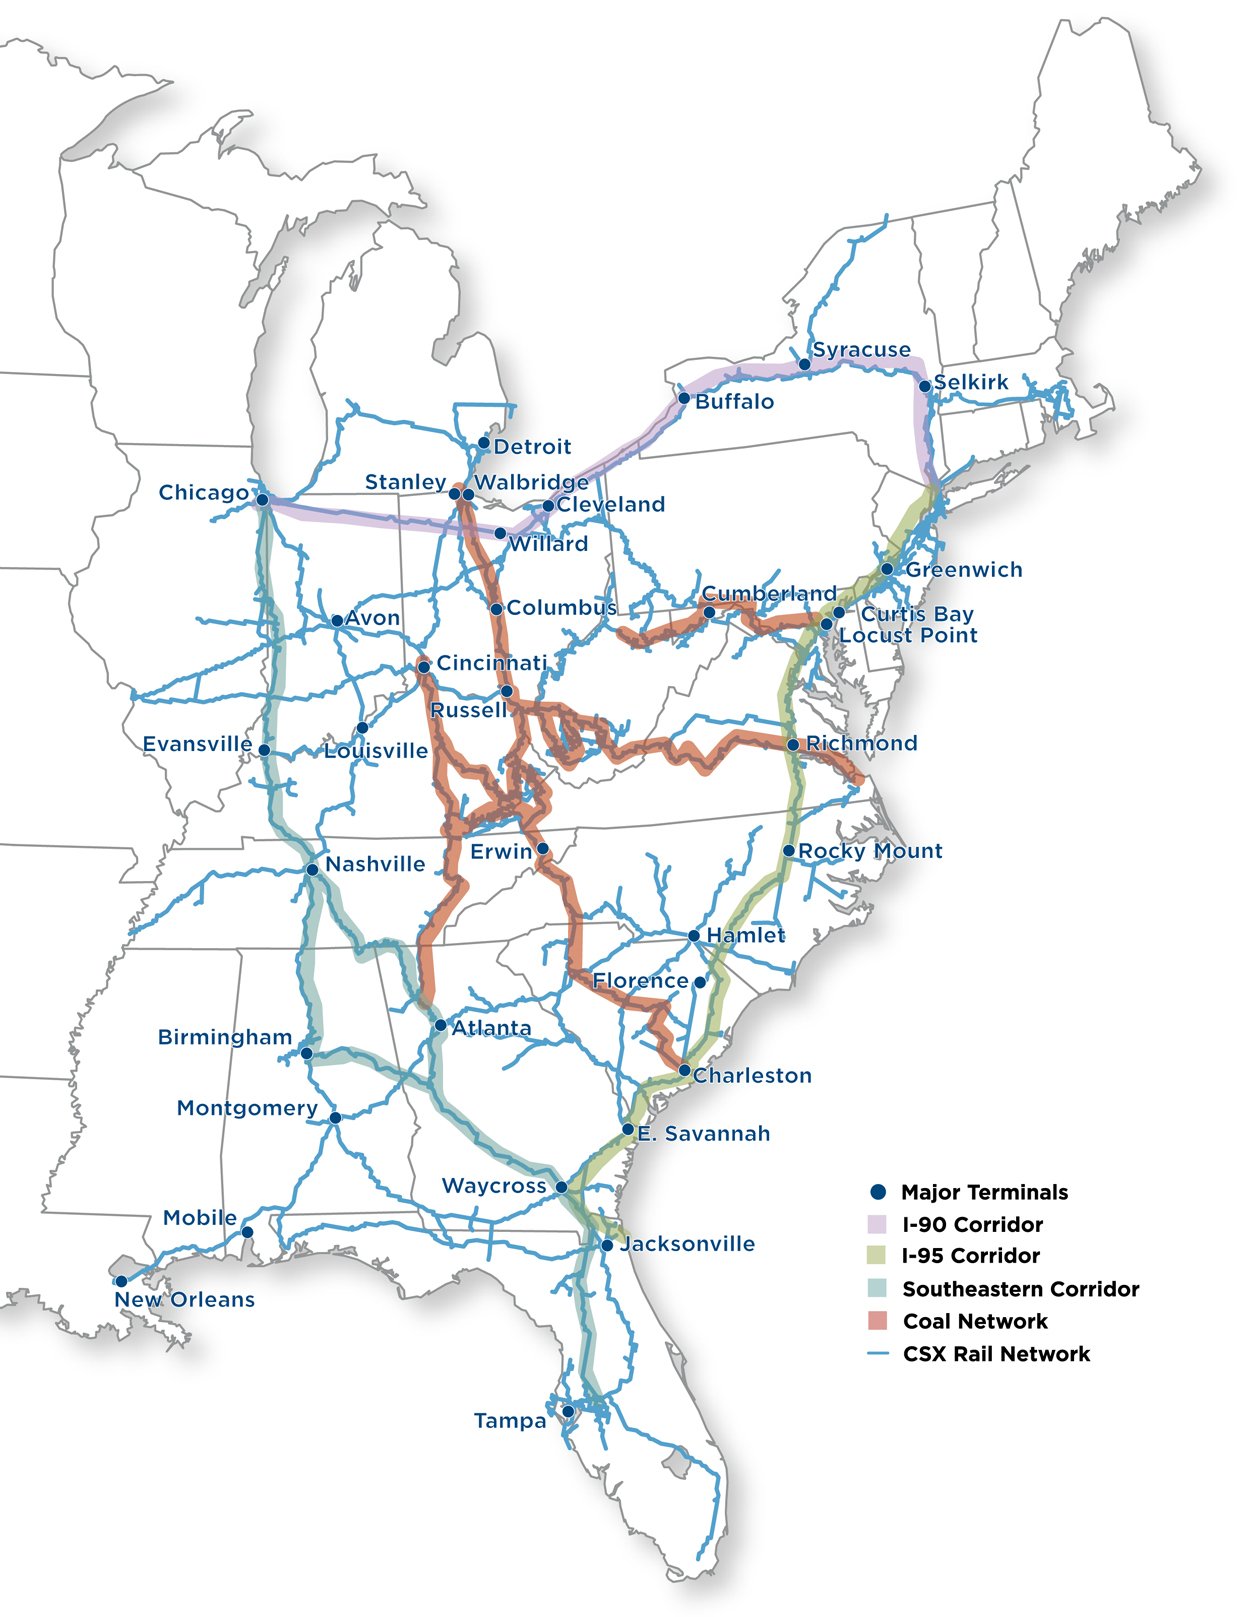
CSX Rail Network
11