Attached files
| file | filename |
|---|---|
| 8-K - FORM 8-K - PETROQUEST ENERGY INC | d565725d8k.htm |
Exhibit 99.1
| July 2013 |

| Company Information 1 Corporate Contact: Matt Quantz - mquantz@petroquest.com This presentation contains "forward-looking statements" within the meaning of Section 27A of the Securities Act of 1933, as amended, and Section 21E of the Securities Exchange Act of 1934, as amended. These forward-looking statements are subject to certain risks, trends and uncertainties that could cause actual results to differ materially from those projected. Among those risks, trends and uncertainties are our ability to successfully complete in the Gulf of Mexico acquisitions and realize the anticipated benefits of from the acquisitions, any unexpected costs or delays in connection with the Gulf of Mexico acquisitions, our ability to find oil and natural gas reserves that are economically recoverable, the volatility of oil and natural gas prices and significantly depressed natural gas prices since the middle of 2008, the uncertain economic conditions in the United States and globally, the decline in the values of our properties that have resulted in and may in the future result in additional ceiling test write-downs, our ability to replace reserves and sustain production, our estimate of the sufficiency of our existing capital sources, our ability to raise additional capital to fund cash requirements for future operations, the uncertainties involved in prospect development and property acquisitions or dispositions and in projecting future rates of production or future reserves, the timing of development expenditures and drilling of wells, hurricanes and other natural disasters, including the impact of the oil spill in the Gulf of Mexico on our present and future operations, the impact of government regulation, and the operating hazards attendant to the oil and gas business. In particular, careful consideration should be given to cautionary statements made in the various reports PetroQuest has filed with the Securities and Exchange Commission. PetroQuest undertakes no duty to update or revise these forward-looking statements.Prior to 2010, the Securities and Exchange Commission generally permitted oil and gas companies, in their filings, to disclose only proved reserves that a company has demonstrated by actual production or conclusive formation tests to be economically and legally producible under existing economic and operating conditions. Beginning with year-end reserves for 2009, the SEC permits the optional disclosure of probable and possible reserves. We have elected not to disclose our probable and possible reserves in our filings with the SEC. We use the terms "reserve inventory," "gross unrisked reserves," "EUR," "inventory" or other descriptions of volumes of hydrocarbons to describe volumes of resources potentially recoverable through additional drilling or recovery techniques that the SEC's guidelines prohibit us from including in filings with the SEC. Estimates of reserve inventory, gross unrisked reserves EUR or inventory do not reflect volumes that are demonstrated as being commercially or technically recoverable. Even if commercially or technically recoverable, a significant recovery factor would be applied to these volumes to determine estimates of volumes of proved reserves. Accordingly, these estimates are by their nature more speculative than estimates of proved reserves and accordingly are subject to substantially greater risk of being actually realized by the Company. The methodology for estimating unrisked inventory, gross unrisked reserves or EUR may also be different than the methodology and guidelines used by the Society of Petroleum Engineers and is different from the SEC's guidelines for estimating probable and possible reserves. 400 East Kaliste Saloom Road, Suite 6000 Lafayette, Louisiana 70508 Phone: (337) 232-7028 Fax: (337) 232-0044www.petroquest.com |

| Acquisition Overview Acquisition Overview PQ will operate 79% of productionUpside: Interest in 7 - 5,000 acre Blocks which our technical team will explore 2 Proved 3P Reserves 5.3 MMBoe 8.5 MMBoe PV10(1) $171 MM $278 MM F&D per BOE $36.41 $22.66 Price/PV10 1.1x 0.7x Price per BOE/D ~$45,000 ~$45,000 Strip pricing averaging $4.37 /Mcf and $92.32 Bbl Attractive Price for Cash Generating Assets $MM $278 |
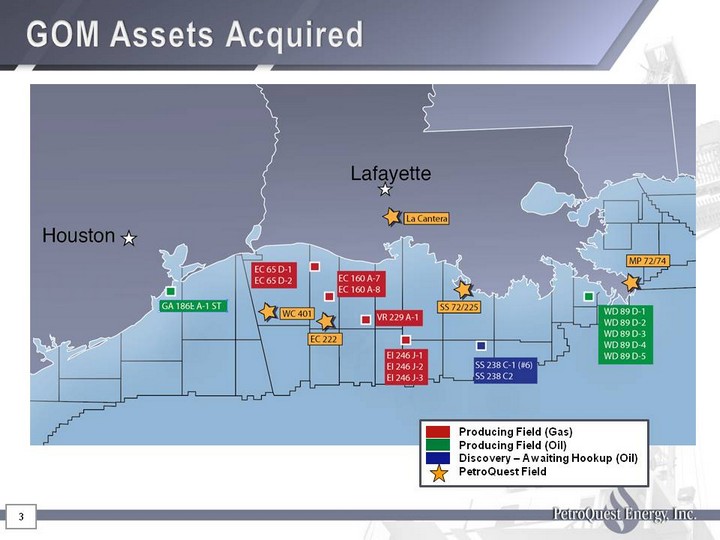
| GOM Assets Acquired 3 Producing Field (Gas)Producing Field (Oil)Discovery - Awaiting Hookup (Oil)PetroQuest Field |

| Acquisition Strategic Rationale Significantly increases oil production and overall cash flowRobust cash flows will be redeployed to onshore assetsAccelerated development of long-lived, low-risk Woodford shale and Cotton Valley assetsWoodford promote structure allows for returns of 80%+ Strong growth and diversification of reserves and productionEnhanced liquids profile meaningfully improves returns and margins Significant experience and proven track record in exploiting Gulf Coast assetsAttractive development prospects with minimal funding requirementsAs has been demonstrated with existing Gulf of Mexico assets, upward reserve revisions likely (CHART) Up 102% 4 (1) Based on mid-point of guidance |
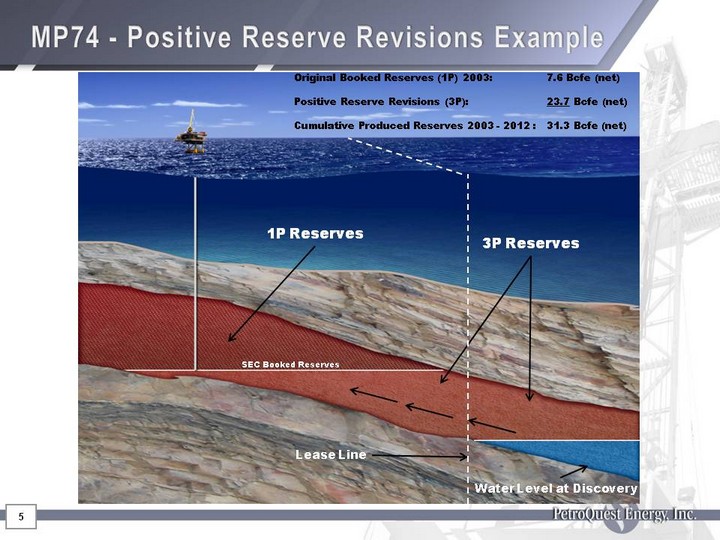
| MP74 - Positive Reserve Revisions Example 5 1P Reserves 3P Reserves Lease Line Water Level at Discovery SEC Booked Reserves Original Booked Reserves (1P) 2003: 7.6 Bcfe (net) Positive Reserve Revisions (3P): 23.7 Bcfe (net)Cumulative Produced Reserves 2003 - 2012 : 31.3 Bcfe (net) |

| Pro Forma Production and Reserves 6 6 (CHART) Up 41% Based upon mid-point of production guidance rangeUsing YE prices of $3.41/Mcf and $91.82/Bbl Production Proved Reserves(2) (CHART) (CHART) 2012 Proved Reserves265 Bcfe Pro Forma2012 Proved Reserves302 Bcfe Up 14% Gulf of Mexico Shelf assets 39 |

| 2012 Pro Forma 2012 Pro Forma Net, unrisked resource potential Our Properties 7 (CHART) PRODUCTION:41.4 Bcfe (2)(59% Long Life)(CHART) RESERVES 302.1 Bcfe (1) (75% Long Life) Gulf Coast Acquired Gulf Coast Legacy (CHART) INVENTORY1.9 Tcfe (3) (84% Long Life) Gulf Coast Acquired Gulf Coast Legacy Legacy Acquired |

| (CHART) 8 Product Diversification - Gas to Liquids Keys Drivers to Liquids TransitionLa Cantera currently producing approximately 110,000 Mcfe/d gross (21% liquids)GOM Shelf acquisition significantly accretive to organic oil productionAcceleration of Woodford Rich and Cotton Valley programs from increased Gulf Coast CF 2013PF 2014PF Gross wells Gross wells Woodford Rich 16 50 Woodford Dry 6 0 Horizontal CV 1 10 - 15 Up 168% (1) (1) (1) Based upon mid-point of guidance range Liquids Production Will Drive Cash Margin Expansion |

| Woodford Position 9 2013 Liquids Rich Leasing Activity~12,000 acres Legacy Liquids Rich Acreage ~3,000 acres Legacy Dry Gas Acreage ~60,000 acres Asset Highlights and Current Liquids Rich Focus:Average IP rate: 2,869 Mcf/d and 275 BOE of NGLs/dAverage EUR: 661 MBOE (59% gas - 41% NGL)Producing over 900 bbls/d net of NGLsRecent leasing adds significant drilling inventoryRecently brought on 8 well pad at gross IP of 29,072 Mcf/d and 1,911 barrels of NGLs/d16 wells planned for 2013 and 50 wells planned for 2014 |

| 10 Continuous Improvement in the Woodford (CHART) |

| Historical Woodford Performance 11 (1) Reserves computed using 12/31/12 pricing of $3.41/Mcf (CHART) (CHART) (CHART) Expect to replicate 8 years of drilling in next 2.5 years |
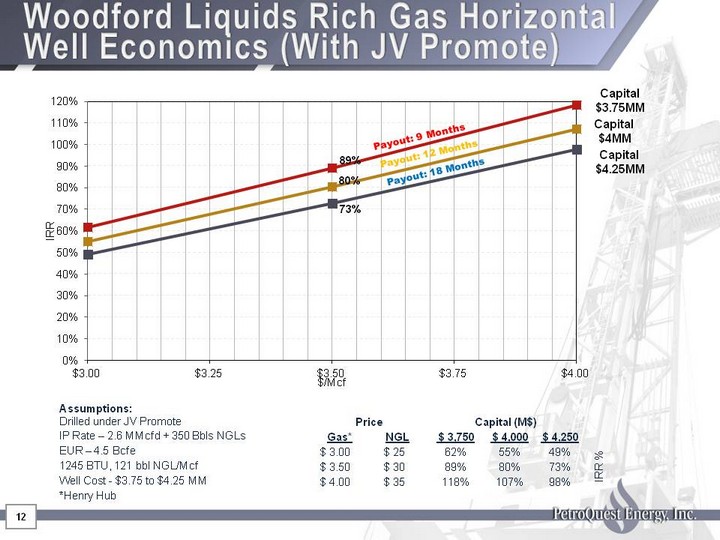
| Woodford Liquids Rich Gas Horizontal Well Economics (With JV Promote) 12 12 Assumptions: Drilled under JV Promote Price Price Capital (M$) Capital (M$) Capital (M$) IP Rate - 2.6 MMcfd + 350 Bbls NGLs Gas* NGL $ 3,750 $ 4,000 $ 4,250 EUR - 4.5 Bcfe $ 3.00 $ 25 62% 55% 49% IRR % 1245 BTU, 121 bbl NGL/Mcf $ 3.50 $ 30 89% 80% 73% IRR % Well Cost - $3.75 to $4.25 MM $ 4.00 $ 35 118% 107% 98% IRR % *Henry Hub Payout: 9 Months Payout: 12 Months |

| Panola County Cotton Valley Production 13 13 LegendCotton Valley Wells PQ CV Vertical Wells PQ CV Horizontal Wells PQ Area of Mutual Interest Carthage Field Area - 4.4 TCF 518 Bcfe CV/BossierPotential |
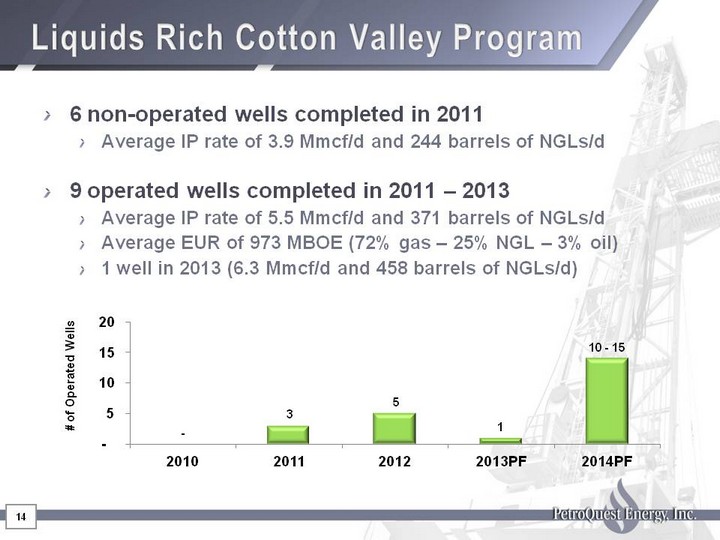
| Liquids Rich Cotton Valley Program 14 6 non-operated wells completed in 2011Average IP rate of 3.9 Mmcf/d and 244 barrels of NGLs/d9 operated wells completed in 2011 - 2013Average IP rate of 5.5 Mmcf/d and 371 barrels of NGLs/dAverage EUR of 973 MBOE (72% gas - 25% NGL - 3% oil)1 well in 2013 (6.3 Mmcf/d and 458 barrels of NGLs/d)(CHART) |
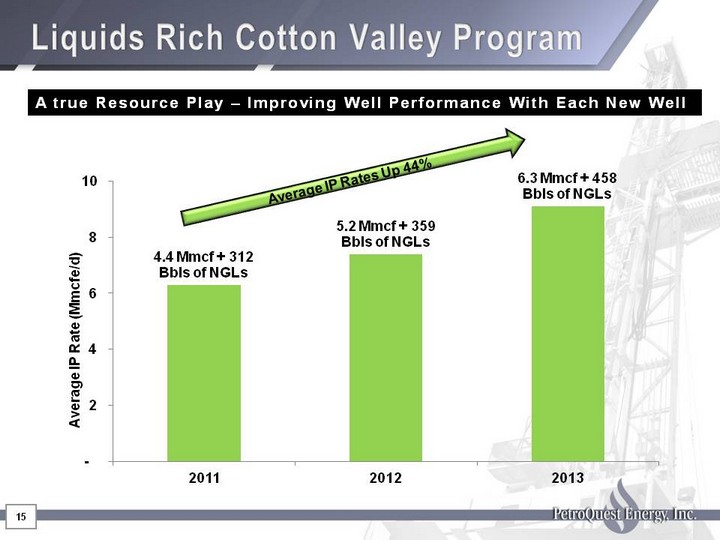
| Liquids Rich Cotton Valley Program 15 (CHART) Average IP Rates Up 44% A true Resource Play - Improving Well Performance With Each New Well |
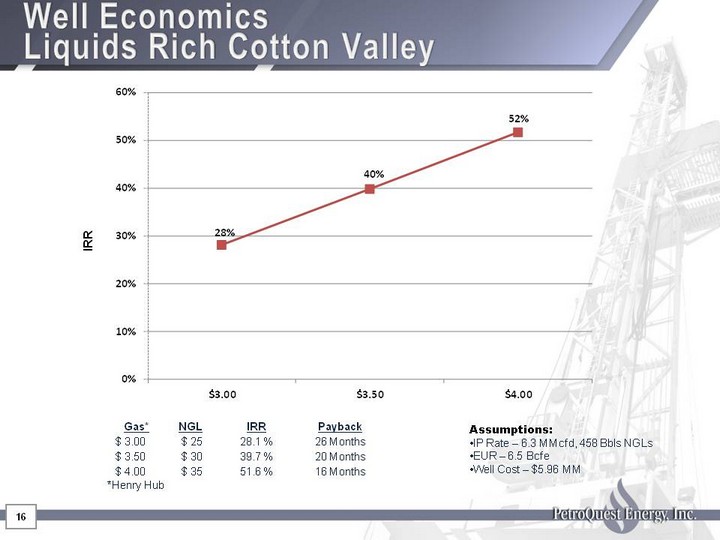
| Well Economics Liquids Rich Cotton Valley 16 Gas* NGL IRR Payback $ 3.00 $ 25 28.1 % 26 Months $ 3.50 $ 30 39.7 % 20 Months $ 4.00 $ 35 51.6 % 16 Months *Henry Hub IRR Assumptions:IP Rate - 6.3 MMcfd, 458 Bbls NGLsEUR - 6.5 Bcfe Well Cost - $5.96 MM |
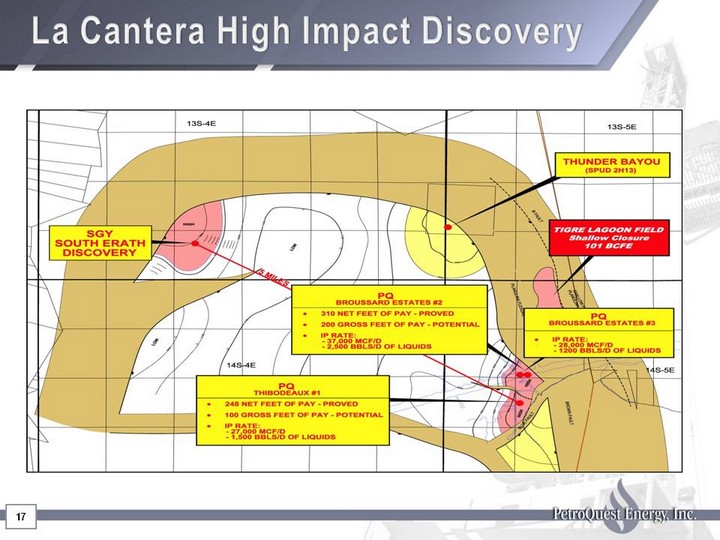
| La Cantera High Impact Discovery 17 |

| La Cantera Development 18 Lower Cris R-1 Lower Cris R-2, Lobe A Lower Cris R-2, Lobe B Lower Cris R-2, Lobe C (CURRENTLY PRODUCING) (CURRENTLY PRODUCING) 40,000 MCF/D + 740 Bbls of oil2-3 Year Reserve Life ~200 feet of potential pay 30,000E MCF/D + 500 Bbls of oil2-3 Year Reserve Life 40,000E MCF/D + 800 Bbls of oil2-3 Year Reserve Life 30,000 MCF/D + 500 Bbls of oil2-3 Year Reserve Life 30,000 MCF/D + 500 Bbls of oil2-3 Year Reserve Life 40,000E MCF/D + 800 Bbls of oil2-3 Year Reserve Life |
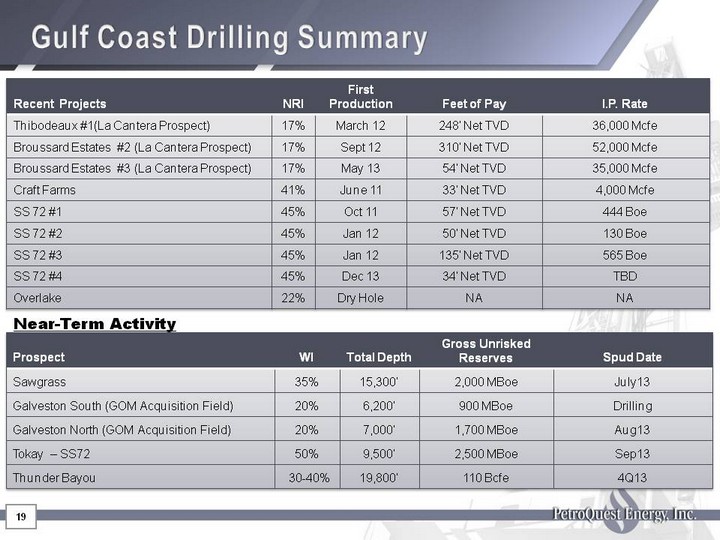
| Gulf Coast Drilling Summary Gulf Coast Drilling Summary 19 Recent Projects NRI First Production Feet of Pay I.P. Rate Thibodeaux #1(La Cantera Prospect) 17% March 12 248' Net TVD 36,000 Mcfe Broussard Estates #2 (La Cantera Prospect) 17% Sept 12 310' Net TVD 52,000 Mcfe Broussard Estates #3 (La Cantera Prospect) 17% May 13 54' Net TVD 35,000 Mcfe Craft Farms 41% June 11 33' Net TVD 4,000 Mcfe SS 72 #1 45% Oct 11 57' Net TVD 444 Boe SS 72 #2 45% Jan 12 50' Net TVD 130 Boe SS 72 #3 45% Jan 12 135' Net TVD 565 Boe SS 72 #4 45% Dec 13 34' Net TVD TBD Overlake 22% Dry Hole NA NA Near-Term Activity |

| Gulf Coast Assets: Free Cash Flow Funds Growth Free Cash Flow Funds Growth Free Cash Flow Funds Growth 20 Revenues less LOE and severance taxes from GCB/GOM divided by Capex |
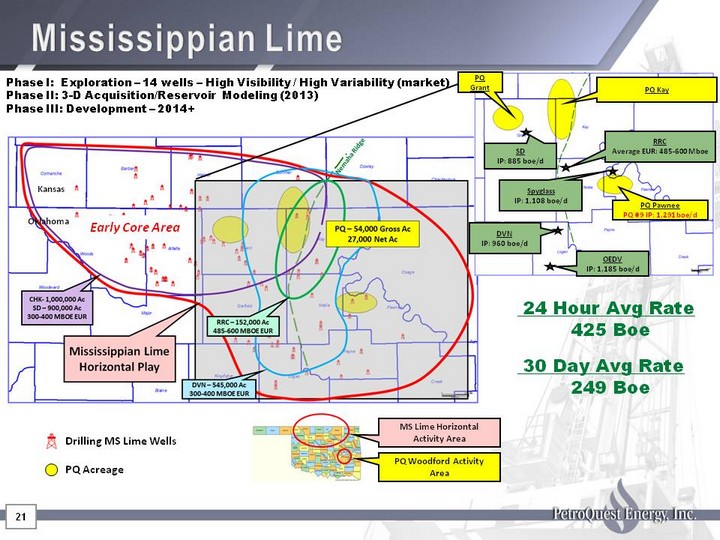
| 21 Drilling MS Lime Wells PQ Acreage Mississippian Lime Early Core Area Kansas Oklahoma PQ Woodford Activity Area MS Lime Horizontal Activity Area PQ Kay PQ PawneePQ #9 IP: 1,291 boe/d RRCAverage EUR: 485-600 Mboe SpyglassIP: 1,108 boe/d DVNIP: 960 boe/d OEDVIP: 1,185 boe/d SDIP: 885 boe/d PQ Grant Phase I: Exploration - 14 wells - High Visibility / High Variability (market)Phase II: 3-D Acquisition/Reservoir Modeling (2013)Phase III: Development - 2014+ 24 Hour Avg Rate 425 Boe 30 Day Avg Rate 249 Boe |

| Balance Sheet and Liquidity 22 Fiscal discipline and Woodford JV have supported balance sheet during low gas price environmentBorrowing base recently increased to $200 million Pro Forma liquidity(1) @ 3/31/13 = $161 million Unused future drilling carry @ 3/31/13 = $60.4 millionNon-core asset sales in Dec and Jan provide ~$20 million in additional capital Liquidity calculated as sum of cash and availability under increased borrowing base Pro Forma for notes offering and GOM shelf acquisition. Reserves as of 12/31/12 (PQ reserves computed using YE 2012 pricing) 22 PF 3/31/13 Balance (2) Maturity Bank Debt $60MM 2016 10% Senior Notes due 2017 350MM 2017 Total Debt $410MM Proved Reserves (2) 302 Bcfe Debt/Proved Mcfe (2) $1.36 |

| Focused Effort to Fund Drilling with Cash Flow 23 MM$ 23 Total Direct CapEx and Cash Flows for the period between 2005 and 2012 PQ has lived within cash flow over the past 8 years (1) (1) Other proceeds include: sale of gathering system, equity proceeds, JV proceeds and other asset sales $1,268 |
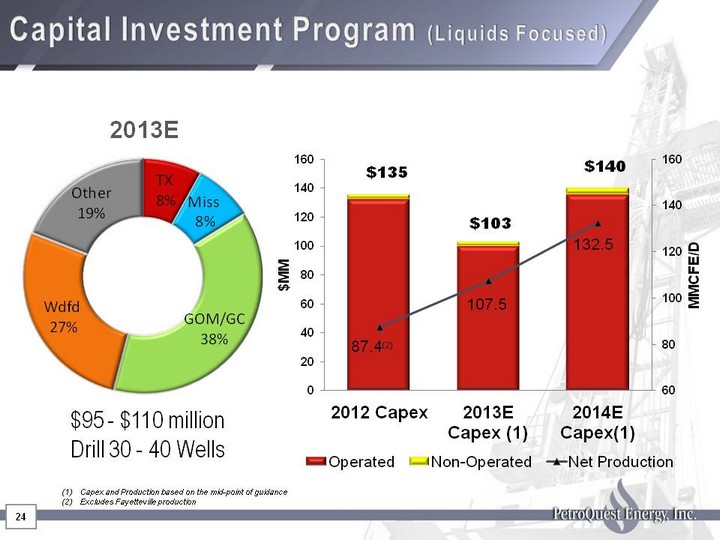
| Capital Investment Program (Liquids Focused) 24 2013E $95 - $110 millionDrill 30 - 40 Wells (CHART) Capex and Production based on the mid-point of guidanceExcludes Fayetteville production $135 |
| Summary Transaction provides increased size and scale while improving credit metrics and liquidity over timeSubstantial low risk drilling inventory available for developmentConsistent strategy to use enhanced Gulf Coast cash flow to accelerate resource developmentConservative financial strategy and proven track record of aligning capex with cash flowExperienced management team with track record of success in the Gulf Coast/GOM 25 |

| Target of hedging 40%-50% of annual productionHedging positions: 26 Natural Gas Daily Hedged Volumes (Mmbtu) Average Price Feb13 - Dec13 10,000 $3.71 Mar13 - Dec13 5,000 $3.50 Apr13 - Dec13 10,000 $3.90 July13 - Dec13 5,000 $4.00 - $4.75 2013 10,000 $2.00 -$3.00 -$4.09 2013 5,000 $4.00 2014 10,000 $4.08 Oil Daily Hedged Volumes (Bbls) Price 2013 250 $104.75 (1) July13 - Dec13 250 $97.00 (2) July13 - Dec13 250 $98.80 (2) 2014 250 $92.50 (2) LLS IndexWTI Index Appendix - 1 Hedging Positions |

| 27 Appendix - 2 Adjusted EBITDA represents net income (loss) before income tax, interest expense (net), dividends, depreciation, depletion, amortization, non-cash stock compensation expense, accretion of asset retirement, non-cash derivative expense, ceiling test writedowns and loss on early extinguishment of debt and non- cash legal settlement. We have reported Adjusted EBITDA because we believe Adjusted EBITDA is a measure commonly reported and widely used by investors as an indicator of a company's operating performance. We believe Adjusted EBITDA assists such investors in comparing a company's performance on a consistent basis without regard to depreciation, depletion and amortization, which can vary significantly depending upon accounting methods or nonoperating factors such as historical cost. Adjusted EBITDA is not a calculation based on generally accepted accounting principles, or GAAP, and should not be considered an alternative to net income in measuring our performance or used as an exclusive measure of cash flow because it does not consider the impact of working capital growth, capital expenditures, debt principal reductions and other sources and uses of cash which are disclosed in our consolidated statements of cash flows. Investors should carefully consider the specific items included in our computation of Adjusted EBITDA. While Adjusted EBITDA has been disclosed herein to permit a more complete comparative analysis of our operating performance relative to other companies, investors should be cautioned that Adjusted EBITDA as reported by us may not be comparable in all instances to Adjusted EBITDA as reported by other companies. Adjusted EBITDA amounts may not be fully available for management's discretionary use, due to certain requirements to conserve funds for capital expenditures, debt service and other commitments, and therefore management relies primarily on our GAAP results.Adjusted EBITDA is not intended to represent net income as defined by GAAP and such information should not be considered as an alternative to net income, cash flow from operations or any other measure of performance prescribed by GAAP in the United States. The above table reconciles net income (loss) to Adjusted EBITDA for the periods presented. ($ in thousands) 2008 2009 2010 2011 2012 LTM 3/31/13 Net Income (Loss) ($102,100) ($95,330) $41,987 $5,409 ($137,218) ($116,003) Income tax expense (benefit) (55,581) (14,635) 1,630 (1,810) 1,636 2,973 Interest expense & dividends 14,467 17,754 15,091 14,787 14,947 15,539 Depreciation, depletion, and amortization 134,340 84,772 59,326 58,243 60,689 58,330 Loss on early extinguishment of debt - - 5,973 - - - Gain on sale of gas gathering assets (26,812) - - - - - Non cash stock compensation 9,582 6,328 7,137 4,833 6,910 5,543 Non cash gain on legal settlement - - (4,164) - - - Accretion of asset retirement obligation 1,317 2,452 1,306 2,049 2,078 1,910 Derivative Expense - - - - 233 670 Ceiling test writedown 266,156 156,134 - 18,907 137,100 116,989 Adjusted EBITDA $241,372 $157,475 $128,286 $102,418 $86,375 $85,951 27 |
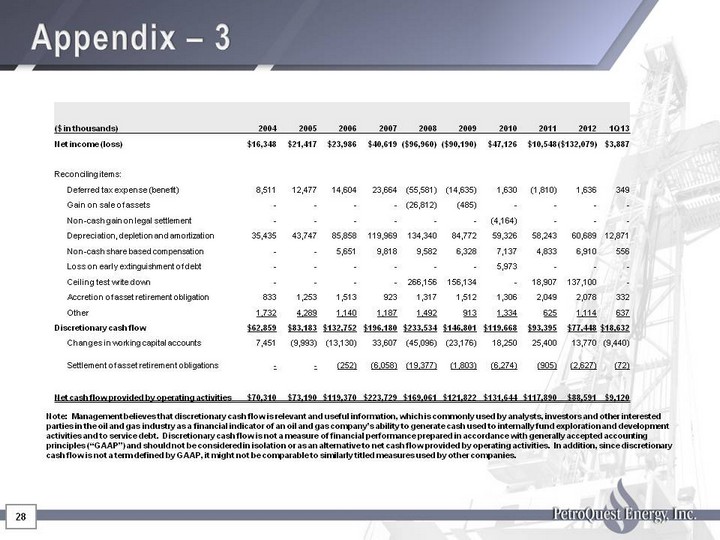
| 28 Appendix - 3 ($ in thousands) 2004 2005 2006 2007 2008 2009 2010 2011 2012 1Q13 Net income (loss) $16,348 $21,417 $23,986 $40,619 ($96,960) ($90,190) $47,126 $10,548 ($132,079) $3,887 Reconciling items: Deferred tax expense (benefit) 8,511 12,477 14,604 23,664 (55,581) (14,635) 1,630 (1,810) 1,636 349 Gain on sale of assets - - - - (26,812) (485) - - - - Non-cash gain on legal settlement - - - - - - (4,164) - - - Depreciation, depletion and amortization 35,435 43,747 85,858 119,969 134,340 84,772 59,326 58,243 60,689 12,871 Non-cash share based compensation - - 5,651 9,818 9,582 6,328 7,137 4,833 6,910 556 Loss on early extinguishment of debt - - - - - - 5,973 - - - Ceiling test write down - - - - 266,156 156,134 - 18,907 137,100 - Accretion of asset retirement obligation 833 1,253 1,513 923 1,317 1,512 1,306 2,049 2,078 332 Other 1,732 4,289 1,140 1,187 1,492 913 1,334 625 1,114 637 Discretionary cash flow $62,859 $83,183 $132,752 $196,180 $233,534 $146,801 $119,668 $93,395 $77,448 $18,632 Changes in working capital accounts 7,451 (9,993) (13,130) 33,607 (45,096) (23,176) 18,250 25,400 13,770 (9,440) Settlement of asset retirement obligations - - (252) (6,058) (19,377) (1,803) (6,274) (905) (2,627) (72) Net cash flow provided by operating activities $70,310 $73,190 $119,370 $223,729 $169,061 $121,822 $131,644 $117,890 $88,591 $9,120 Note: Management believes that discretionary cash flow is relevant and useful information, which is commonly used by analysts, investors and other interested parties in the oil and gas industry as a financial indicator of an oil and gas company's ability to generate cash used to internally fund exploration and development activities and to service debt. Discretionary cash flow is not a measure of financial performance prepared in accordance with generally accepted accounting principles ("GAAP") and should not be considered in isolation or as an alternative to net cash flow provided by operating activities. In addition, since discretionary cash flow is not a term defined by GAAP, it might not be comparable to similarly titled measures used by other companies. 28 |

| 29 Appendix - 4 Horizontal Cotton Valley |

| Appendix - 5 Woodford JV Transaction Summary Woodford JV closed May 2010 whereby partner received 29 Bcfe of PUD reserves and right to earn 50% of Woodford acreageReceived cash payments totaling $88.0 millionThrough 3/31/13 have utilized drilling carry totaling $86.0 millionAt 3/31/13 - $60.4 million of drilling carry remains whereby partner pays 75% of well costs for a 50% ownershipUnder accelerated program all wells drilled in 2013 and 2014 are expected to benefit from promoteEnables all liquids rich acreage to be HBP with promoted dollars 30 30 |
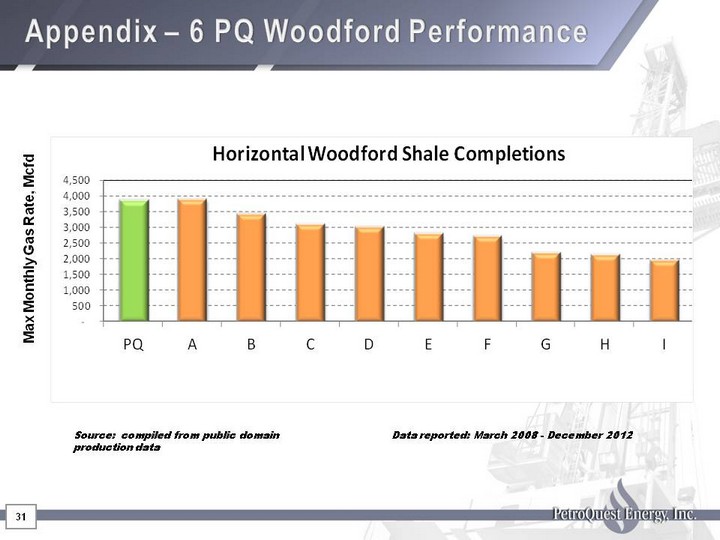
| 31 Source: compiled from public domain production data Data reported: March 2008 - December 2012 Max Monthly Gas Rate, Mcfd 31 Appendix - 6 PQ Woodford Performance |

| 400 East Kaliste Saloom Road, Suite 6000 Lafayette, Louisiana 70508 Phone: (337) 232-7028 Fax: (337) 232-0044 www.petroquest.comNYSE: PQ 32 |