Attached files
| file | filename |
|---|---|
| 8-K - FORM 8-K - CAMDEN NATIONAL CORP | v347627_8k.htm |
June 12, 2013 NASDAQ: CAC

Safe Harbor Statement The information presented may contain forward - looking statements within the meaning of the Private Securities Litigation Reform Act of 1995. These statements are based upon current beliefs and expectations and are subject to significant risks and uncertainties some of which are beyond Camden National Corporation’s control. Actual results may differ materially from the results discussed in these forward - looking statements . Factors that could cause Camden Nationa l Corporation’s results to differ materially can be found n i the risk factors set forth n i Camden National Corporation’s Annual Report on Form 10- K for the year ended December 31, 2012, as updated by Camden National Corporation’s Quarterly Reports on Form 10- Q and other filings with the SEC. 1

Camden National Corporation Corporate Snapshot Financial Overview • Headquartered in Camden, ME; Founded 1875 (in 000's) 1st Q 2013 2012 2011 • Subsidiaries: Loans $1,578 $1,564 $1,520 • Camden National Bank - $2.6B Assets Assets $2,591 $2,565 $2,303 Deposits $1,952 $1,929 $1,591 • Acadia Trust - $758MM AUM Equity $236 $234 $219 • Over 500 Employees ROA 0.90% 0.98% 1.13% • 49 Branch Locations ROE 9.81% 10.31% 12.16% Efficiency Ratio 63.88% 57.45% 54.68% Shareholder Profile Highlights • Shares Outstanding 7.6 million • Announced sale of 5 Franklin County branches - • Institutional 26% / Mutual Funds 13%, $87 million of deposits (May 2013) • • Acquired 14 branches from Bank of America - Insiders 2% / Other 59% $287 million of deposits (October 2012) • Tangible Book Value per Share $23.91 • Named by Forbes as one of “America’s Most • Tangible Common Equity/Tangible Assets 7.19% Trustworthy Companies” (2013 & 2012 ) • Stock Price/Tangible Book Value 157% (CAC stock • Named “Financial Institution of the Year” by closed at $37.65 on 6/10/13) Finance Authority of Maine (2012, 2011 & 2009 ) • Dividend Yield of 2.87% 2
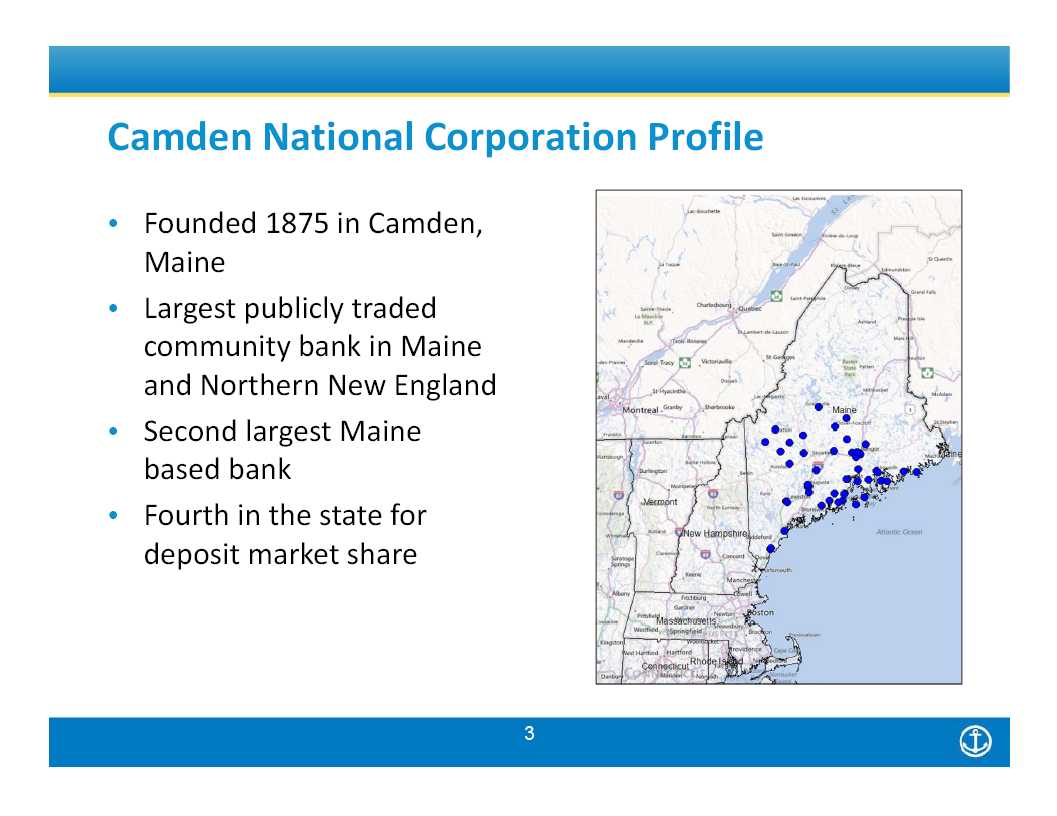
Camden National Corporation Profile • Founded 1875 n i Camden, Maine • Largest publicly traded community bank n i Maine and Northern New England • Second largest Maine based bank • Fourth n i the state for deposit market share 3

Core Strengths • Above peer earnings performance • Disciplined risk management culture • Consistent shareholder returns • Solid track record of organic and acquired growth 4

Above Peer Earnings Performance Highlights Return on Average Assets • Consistent, top- quartile 1.13% 1.20% 1.09% performance against Northeast and 1.00% 0.98% 1.00% 0.90% National peer groups 0.80% • Driven to create consistent returns 0.60% for our shareholders 0.40% • Efficient operations focused on 0.20% revenue generation 0.00% 2009 2010 2011 2012 1Q13 Return on Average Equity Efficiency Ratio (FTE) 14.00% 12.81% 12.42% 80.00% 12.16% 12.00% 10.31% 9.81% 70.00% 10.00% 63.88% 8.00% 60.00% 57.45% 55.74% 54.68% 6.00% 54.26% 4.00% 50.00% 2.00% 0.00% 40.00% 2009 2010 2011 2012 1Q13 2009 2010 2011 2012 1Q13 Proxy Peer – Average of 21 publicly traded commercial and savings banks in the Northeast (as of 3/31/13) BHCPR Peer – Average of 352 bank holding companies with consolidated assets between $1 and $3 billion (as of 3/31/13) Source: SNL Financial 5

Disciplined Risk Management Culture Highlights Total Risk Based Capital • Strong capital growth to support 18.00% 15.95% 15.56% 15.60% future loan growth 16.00% 15.05% 13.49% • Credit quality consistent with 14.00% Northeast peer group 12.00% • Stable asset quality through 10.00% economic downturn 8.00% 2009 2010 2011 2012 1Q13 NPAs to Total Assets Net Charge Offs to Average Loans 4.00% 1.40% 1.20% 3.00% 1.00% 2.00% 0.80% 1.26% 0.60% 1.07% 1.05% 1.11% 1.12% 0.37% 1.00% 0.40% 0.28% 0.26% 0.24% 0.20% 0.09% 0.00% 0.00% 2009 2010 2011 2012 1Q13 2009 2010 2011 2012 1Q13 Proxy Peer – Average of 21 publicly traded commercial and savings banks n i the Northeast (as of 3/31/13) BHCPR Peer – Average of 352 bank holding companies with consolidated assets between $1 and $3 billion (as of 3/31/13) Source: SNL Financial 6

Consistent Shareholder Returns Earnings Per Share $4.50 $4.00 $3.50 $3.23 $3.41 $3.09 $3.05 • Earnings per share $2.98 $3.00 $2.80 $2.93 $2.38 $2.53 compound annual $2.50 $2.11 $2.00 growth of 6. 01% over $2.00 $1.69 $1.89 $1.50 $1.27 $1.38 $1.27 a 15- year period $1.00 $0.50 $0.00 1997 1998 1999 2000 2001 2002 2003 2004 2005 2006 2007 2008 2009 2010 2011 2012 Tangible Book Value $25.00 $22.66$23.68 • Tangible book value $20.91 $20.00 $18.86 compound annual $17.79 $15.65$16.40$15.40 $15.62 growth of 6. 68% over $15.00 $13.77$14.48 $11.81 $10.34 a 15- year period $10.00 $8.98 $8.54 $8.57 $5.00 $0.00 1997 1998 1999 2000 2001 2002 2003 2004 2005 2006 2007 2008 2009 2010 2011 2012 Source: SNL Financial 7

Solid Track Record of Organic and Acquired Growth Asset Growth History Total Assets (in millions) $3,000 Over 18 year period $2,500 Organic growth $ 969 million Acquired growth 1,140 million Total growth $2,109 million $2,000 Bank of America 14 Branches $287 million $1,500 Union Bankshares $565 million United Corp. $54 million $1,000 KSB Bancorp $179 million $500 Key Bank 4 Branches $54 million $0 1994 1995 1996 1997 1998 1999 2000 2001 2002 2003 2004 2005 2006 2007 2008 2009 2010 2011 2012 Source: SNL Financial 8
Branch Strategy Focus on Growth Markets Franklin County Branch Divestiture ($87MM Deposits) I- 95 Corridor BofA Branch Acquisition ($287MM Deposits) Mid- Coast Region ($864MM Deposits) Source: SNL Financial 9
Branch Strategy Preparing for the Future • Acquisitions • Acquisition of 14 branches from Bank of America resulted n i $287 million n i core deposits • Increased our market share in Maine and improved presence n i growth markets • Earn back of Tangible Book Value within four years • Divestitures • Sale of five branches n i Franklin County by fourth quarter of 2013, pending regulatory approval • $87 million of deposits and $45 million of loans at deposit premium of 3.5% • 2014 EPS dilution of 3% will be mitigated by stock repurchases • Consolidation • Combined Kennebunk branches during 2nd quarter 2013 10
Deposit Market Share - ProForma Maine 2012 2012 Number 2012 Total Deposits in 2012 Total Rank Institution of Branches Market ($000) Market Share (%) 1 TD Bank 55 3,708,955 16.23 2 Key Bank 60 2,662,362 11.65 3 Bangor Savings Bank 60 2,019,820 8.84 4 Camden National Bank 44 1,892,879 8.28 5 Bank of America 19 1,351,013 5.91 6 The First 16 1,035,688 4.53 7 Machias Savings Bank 14 812,367 3.55 8 People's United Bank 28 802,083 3.51 9 Bar Harbor Bank & Trust 16 777,602 3.40 10 Norway Savings Bank 21 727,967 3.19 All Others in State (22) 187 7,065,003 30.91 Total For Institutions In Market 520 22,855,739 100.00 Source: SNL Financial FDIC Deposit Market Share data as of 6/30/12 . Proforma results include adjustment for 2012 branch acquisition and proposed 2013 branch sale. 11
Deposit Market Share 41% 6% 12% 6% 16% 26% 7% 10% 7% 61% 2% Source: SNL Financial FDIC Deposit Market Share data as of 6/30/12 . Proforma results include adjustment for 2012 branch acquisition and proposed 2013 branch sale. 12
Financial Overview • Financial Highlights for past five years • Loans, Investments and Funding Mix • Recent Recognitions 13
Financial Highlights As of 3/31/13 (in 000’s) 3/31/13 2012 2011 2010 2009 2008 Loans $1,578 $1,564 $1,520 $1,530 $1,527 $1,501 Investment Securities 823 802 613 612 540 670 Total Assets 2,591 2,565 2,303 2,306 2,235 2,341 Deposits (a) 1,952 1,929 1,591 1,516 1,496 1,490 Borrowings 366 360 456 560 527 662 Shareholders’ Equity 236 234 219 206 191 166 (a) 2012 includes $287 million of acquired deposits 14
Financial Highlights As of 3/31/13 1Q 2013 2012 2011 2010 2009 2008 (a) (a) Net Income (in millions) $5.7 $23.4 $26.2 $24.8 $22.8 $15.3 Diluted Earnings per $0.74 $3.05 $3.40 $3.23 $2.97 $2.00 Share Return on Tangible 12.69% 12.95% 15.42% 16.15% 17.38% 12.86% Equity Return on Assets 0.90% 0.98% 1.13% 1.09% 1.00% 0.67% Efficiency Ratio 63.88% 57.45% 54.68% 55.74% 54.26% 52.44% Net Interest Margin 3.27% 3.36% 3.57% 3.60% 3.53% 3.37% (a) Includes one - time branch acquisition costs of $161,000 in 2013 and $2.3 million in 2012 15
Financial Highlights As of 3/31/13 1Q 2013 2012 2011 2010 2009 2008 Tangible Common 7.19% 7.19% 7.69% 7.09% 6.59% 5.20% Equity Ratio Total Risk- Based Capital 15.60% 15.56% 15.95% 15.05% 13.49% 12.32% Ratio Leverage Ratio 8.95% 8.94% 9.59% 8.77% 7.80% 7.28% Net charge- offs to 0.09% 0.24% 0.26% 0.28% 0.37% 0.31% Average Loans Non- performing Assets 1.12% 1.13% 1.27% 1.08% 1.13% 0.71% to Total Assets 16
Loans As of 3/31/13 Loan Portfolio Stats Commercial NPLs as % of Total Loans 1.72% Home Equity/ 12% Consumer 19% Annualized Net Charge- offs 0.09% ALL to Total Loans 1.48% Residential Mortgages Lodging Concentration to Total Commercial 10% 36% Loans Real Estate 32% Large Relationships to Total Loans (relationships over $3 22% million) Total Loans: $1.58 billion Yield: 4.56% 17
Investment Portfolio As of 3/31/13 Municipals Non- 4% Agency 1% Portfolio Stats Market Value $804 Million Average Yield 2.31% Agency MBS CMO Duration 3.8 Years 43% 52% Premium $8.1 Million Premium as % of Portfolio 1.0% Investment Book Value of $788 million Excludes FRB/FHLB stock of $20 million 18

Funding As of 3/31/13 Portfolio Stats Cost of Funds 0.58% Deposit Cost of Funds 0.33% Borrowing Cost of Funds 1.50% Loan-to-Deposit Ratio 81% Core Deposits as % of Total Funding now 59% compared to 49% a year ago Borrowings/Brokered 23% Checking 29% Savings/Money Market 30% CD's 18% Deposits and Borrowings of $2.32 billion 19
One of “America’s Most “Financial Institution KBWs Trustworthy Companies” of the Year” “Bank Honor Roll” by Forbes by Finance Authority 2011 and 2012 of Maine 20

Proxy Peer Group Alliance Financial Corporation - NY Independent Bank Corp. - MA Arrow Financial Corporation - NY Merchants Bancshares, Inc. - VT Bar Harbor Bankshares -ME Meridian Interstate Bancorp, Inc. (MHC) - MA Berkshire Hills Bancorp, Inc. - MA Provident New York Bancorp - NY Brookline Bancorp, Inc. - MA Rockville Financial, Inc. (MHC) - CT Canandaigua National Corporation - NY Tompkins Financial Corporation - NY Century Bancorp, Inc. - MA TrustCo Bank Corp NY - NY Enterprise Bancorp, Inc. - MA United Financial Bancorp, Inc. - MA Financial Institutions, Inc. - NY Washington Trust Bancorp, Inc. - RI First Bancorp, Inc. - ME Westfield Financial, Inc. - MA Hingham Institution for Savings - MA 21