Attached files
| file | filename |
|---|---|
| 8-K - FORM 8-K - HOME LOAN SERVICING SOLUTIONS, LTD. | d548742d8k.htm |
 Investor Presentation
June 2013
Exhibit 99.1 |
 2
FORWARD-LOOKING STATEMENT:
This presentation contains forward-looking statements that involve substantial
risks and uncertainties. All statements, other than statements of historical
facts, included in this presentation, including, without limitation,
statements regarding the assumptions we make about our business and economic model, our
dividend policy, including expected yields, business strategy and other plans and
objectives for our future operations, are forward looking statements. These
forward-looking statements are subject to inherent risks and
uncertainties in predicting future results and conditions that could cause the actual results to differ
materially from those projected in these forward-looking statements. We have
included important factors in the cautionary statements made in our Annual
Report on Form 10-K, particularly under the headings “Risk
Factors”
and “Management’s Discussion and Analysis of Financial Condition and
Results of Operations,” that we believe could cause actual results or
events to differ materially from those expressed or implied by the forward
looking statements that we make in this presentation. In light of the significant uncertainties in
these forward-looking statements, you should not regard these statements as a
representation or warranty by us or any other person that we will achieve
our objectives and plans in any specified time frame, or at all. Unless
required by law, we undertake no obligation to publicly update or revise any forward-looking
statements to reflect new information or future events or otherwise.
NON-GAAP MEASURES:
In addition to financial measures prepared in accordance with generally accepted
accounting principles (“GAAP”), this presentation also contains
references to cash generated available for distribution, servicing revenue
and servicing expense, which are non-GAAP performance measures. We
believe these non-GAAP performance measures may provide additional
meaningful comparisons between current results and results in prior periods.
Non-GAAP performance measures should be viewed in addition to, and not as an
alternative for, the Company’s reported results under accounting principles
generally accepted in the United States. |
 3
Leadership Team
William C. Erbey
Chairman of the Board
John P. Van Vlack
President and Director
James E. Lauter
Chief Financial Officer
Richard Delgado
Treasurer
Michael J. McElroy
General Counsel
Bryon E. Stevens
Investor Relations & Capital Markets |
 4
HLSS is an independent acquirer of high-quality mortgage servicing
assets Mortgage servicing advances
Fees from servicing non-agency mortgage loans (Rights to MSRs)
Objective is to generate a stable, recurring, fee-based earnings stream
Low
fixed
infrastructure
costs
given
all
key
servicing
functions
performed
by
Ocwen
Equity
market
capitalization
has
grown
from
~$200
million
at
IPO
in
March
2012
to
$1.3 billion¹
today
Conservative leverage and robust cash flow
HLSS Overview
Current
Ocwen
portfolio
includes
over
$100
billion
UPB
available
for
purchase
Demonstrated ability to close purchases simultaneous to funding prevents
earnings drag
WKSI eligibility simplifies future equity offerings and facilitates access to
capital Focused on adding similar non-agency mortgage assets (subprime
and Alt-A) HLSS's assets represent a 5% first-priority claim against
residential real estate $4.1 billion of assets collateralized by $92.5
billion UPB of loans serviced Opportunity to invest in stable non-agency
mortgage assets largely inaccessible to debt and equity investors
Unique business model with downside protection and potential to increase earnings
Liquidity
risk
mitigated
by
match
funded
capital
structure
–
assets
self-liquidate
at
par
1
Based on the closing share price of $22.84 per share on May 31, 2013
Business
Value
Proposition
Growth Plan |
 5
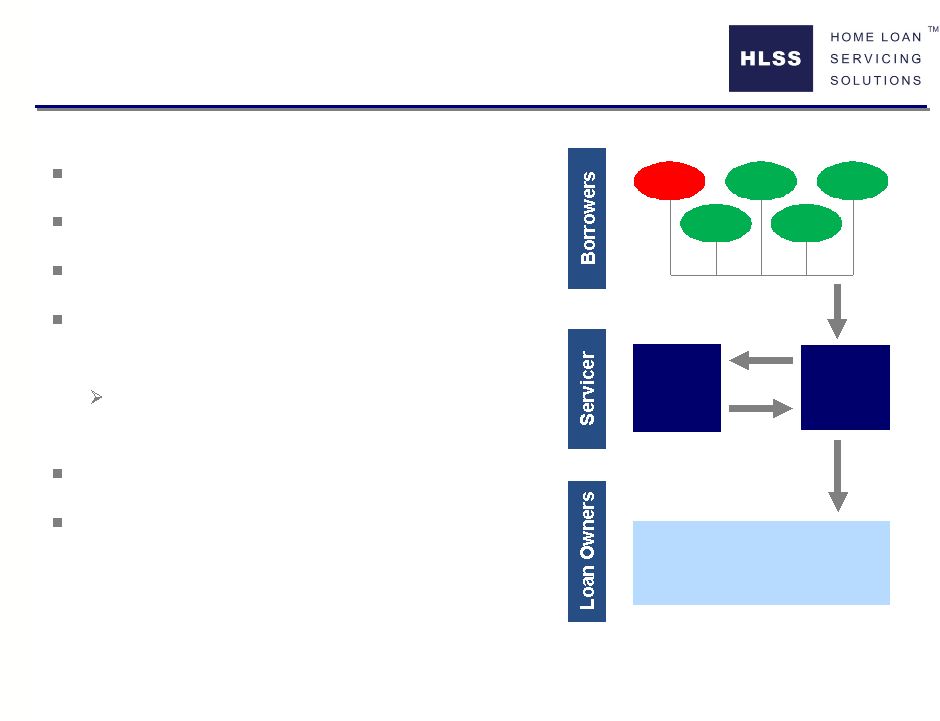
Mortgage Servicing
Back office for non-agency mortgage market
Receives payments from homeowner
Distributes payments to loan owner
Advance payments for delinquent borrowers
(Servicing Advances)
Repaid from borrower payments and
liquidation proceeds
Paid fixed fee (MSR Asset)
No exposure to mortgage credit losses
Borrower
Borrower
Borrower
Borrower
Borrower
Monthly P&I
+Liquidation Proceeds
Monthly P&I
+ Liquidation Proceeds
–
Servicing Fees
–
Advances Repaid
Bond Holders
Servicer
Servicing
Advances
New
Repaid |
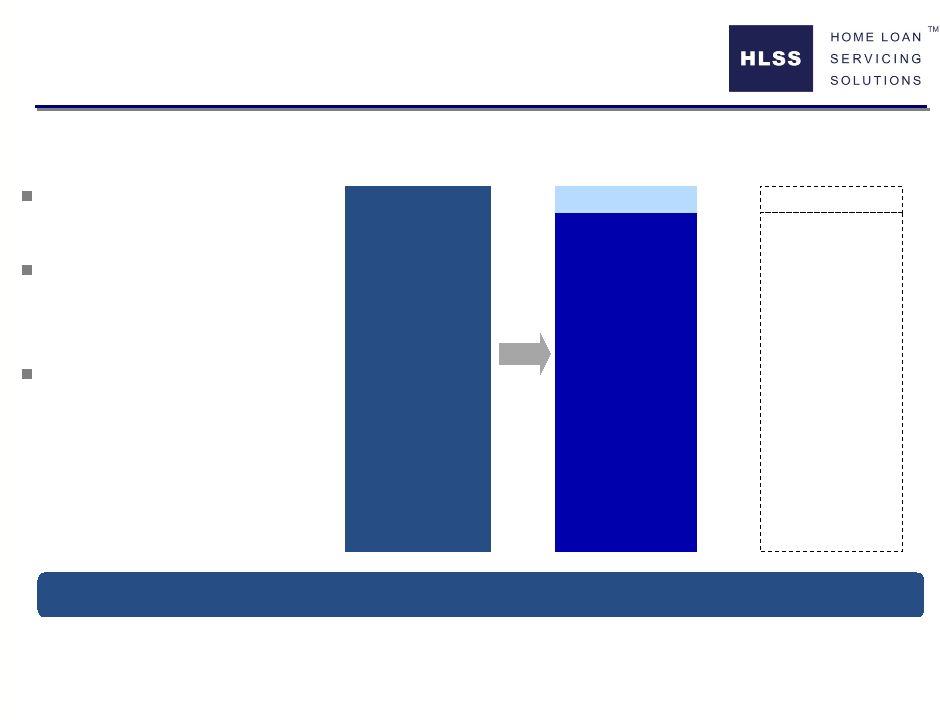 6
$92.5 Billion
UPB
$88.4 Billion
$4.1 Billion
~95% decline in real estate value would be required to impair HLSS's assets
95.6%
Downside
Protection
HLSS Assets
Minimal credit risk due to over
collateralization
Advances recovered at “top-
of-the-waterfall”
from loan
proceeds
If loan proceeds are ever
insufficient, recovery is from
collections on other loans in
RMBS trust
Assets Are a 5% First-Priority Claim |
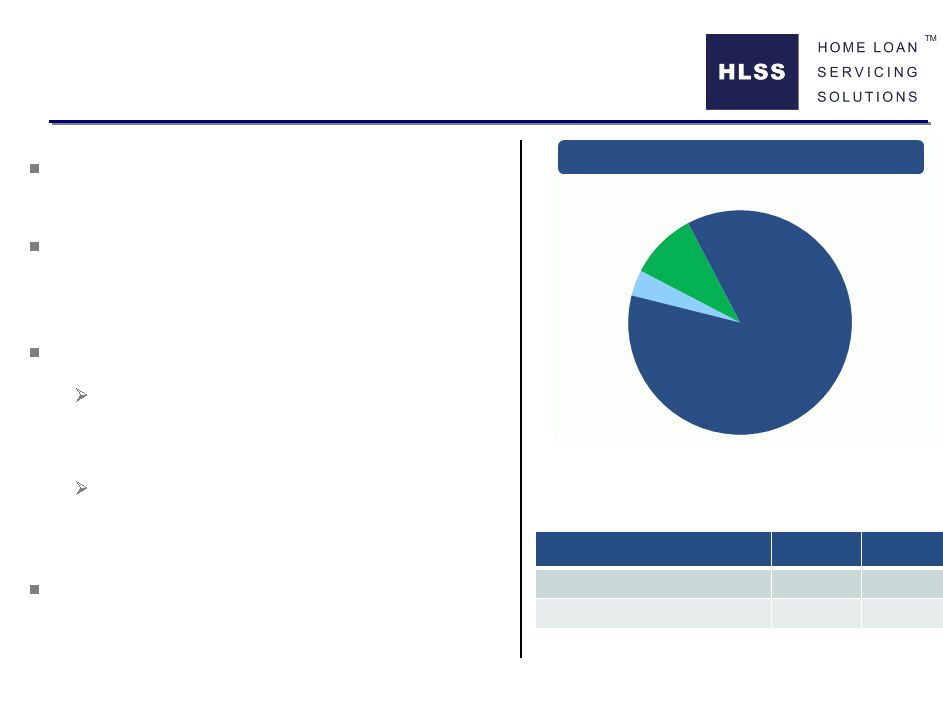 7
Limited Valuation Risk
Cash &
Reserves
$151.7
Total Assets of $4.1 billion are 23 times over-
collateralized by ending UPB of $92.5 billion
90% of assets are Servicing Advances or
Cash which are carried at par and have no
valuation risk
10% of assets have a stable valuation history
Rights to MSRs represent the present
value of future servicing fees, less
expenses
Low prepayment rate that is not
correlated with interest rates for this
portfolio of non-agency mortgages
No change in servicing asset valuations since
inception
($ in Millions)
1
Rights to
MSRs
$393.8
Total Assets
$4,069.8
100%
Servicing Advances & Cash
$3,676.0
90%
MSRs
393.8
10%
1
Reserves associated with the Advance Financing Facility
Servicing
Advances
$3,524.3
March 31, 2013 |
 8
Stable Revenue and Expenses
Predictable Revenue Stream
Known Expense Structure
Hedged Financing Cost
Fixed rate notes with maturities matched to expected borrowing needs
Variable rate exposure hedged via LIBOR swaps extending 60 months
Stability
of
revenue,
borrowing
cost
and
asset
valuations
result
in
predictable
earnings
MSR amortization is based on prepayment speeds which have decreased
Ocwen bears operational risk and servicing cost volatility
Expenses based on asset value
Sub-servicing fees paid to Ocwen also based on UPB
Revenues based on asset value
Contractual annual revenue based on UPB |
 9
23 bps
Subservicing
Fee paid to
Ocwen
17 bps
Incentive Fee
6 bps
Base Fee
~74%
Downside
Protection
~26%
Base Fee
HLSS's largest expense can be
reduced by up to ~74% to
stabilize earnings
Protects against higher interest
expense if Servicing Advances
increase
HLSS benefits from lower
interest expense if Servicing
Advances decrease
Incentive fee exceeds interest
expense, allowing HLSS's
earnings to withstand outsized
stress scenarios
Subservicing Fee Adjusts to
Support Targeted Yield
Note: Amounts based on 50bps servicing fee earned and 27 bps retained fee in Q1
2013. The incentive fee is the servicing fee minus the base fee and the retained fee |
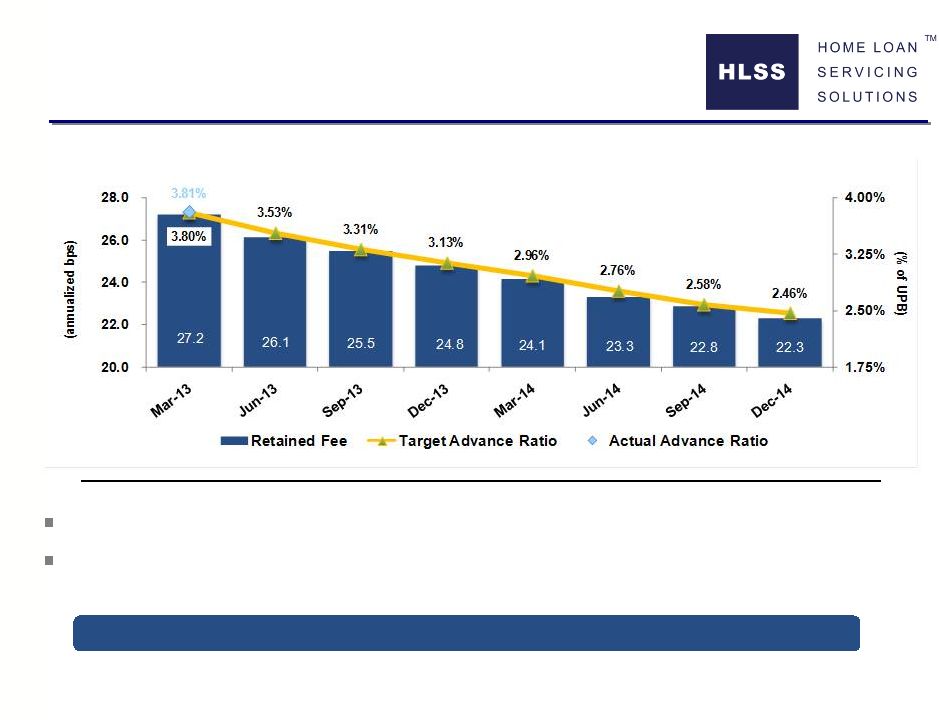 10
Ocwen Contract Ties Servicing
Fees to Advance Ratio
Scheduled step-downs in the retained fee and advance ratio
Fee split constructed to achieve a targeted yield at HLSS
Retained fees are servicing fees net of subservicing expenses paid to Ocwen
If the advance ratio is exceeded in any month, the performance-based incentive
fee is reduced at the annual rate of 5.33% on excess servicing
advances |
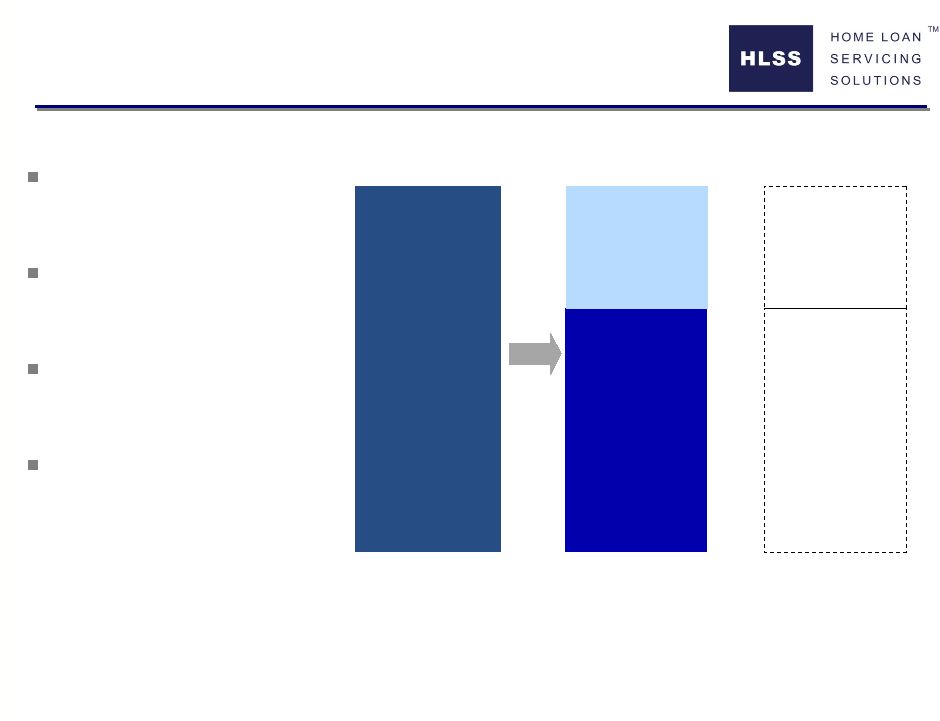
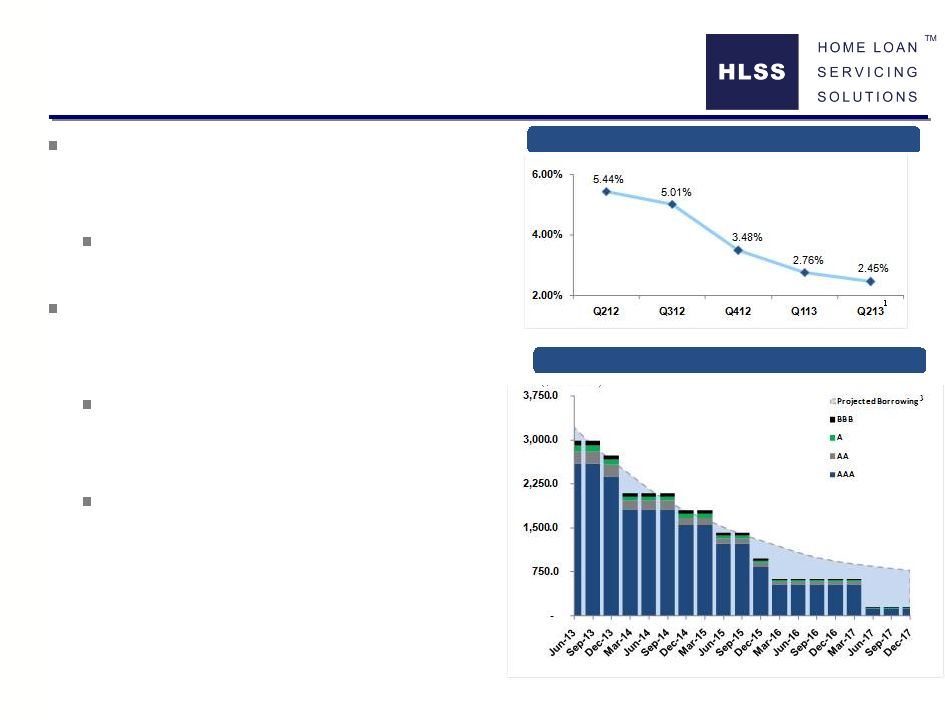 Fixed Rate Financing Stabilizes
Earnings
($ in Millions)
Financing costs have decreased as
lenders have come to recognize the credit
quality and stability of HLSS’s assets
Decreased financing costs have
contributed to increased earnings
HLSS seeks to lock-in interest expense by
financing servicing advances under fixed
rate ABS notes with terms up to 5-years
Additional variable funding note
capacity from banks with LIBOR swaps
to hedge interest rate exposure
Each acquisition is an opportunity to
dynamically rebalance fixed rate notes,
variable capacity and hedges
Fixed
Rate
Term
Note
Capacity
Lower Effective Interest Rate
1
Estimate based on March 31, 2013 borrowing adjusted for the issuance of $850 million
in term
notes
and
$346
million
in
incremental
borrowing
for
the
May
21,
2013
flow
purchase
2
Excludes VFN Capacity
3
Projected borrowing is calculated based on a 91% borrowing rate on projected
servicing advances for the current portfolio, assuming the targeted advance
ratios in the respective subservicing supplements and an annual prepayment
speed of 13.5% 1
11
2 |
 12
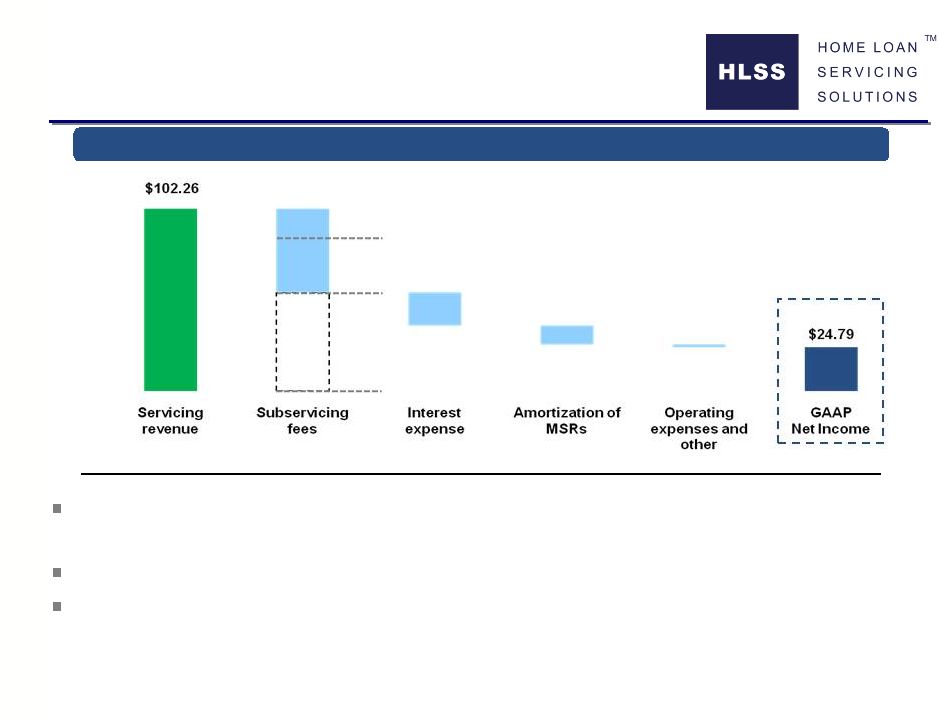
Components of Income
Incentive
Results for the first quarter include a $0.03 per share impact due to a lower
amortization rate of 12.7% versus the 15.0% expected rate
The
incentive
fee
represents
74%
of
total
subservicing
fees
paid
to
Ocwen
Earnings exceeded dividends declared during the quarter by $3.2 million
First Quarter 2013 Earnings
2
($ in Millions)
47.05
Basis points
per UPB¹
(Annualized):
1
Calculated using average UPB for 1Q 2013
2
Operating expenses and taxes, net of interest income and related party
revenue Retained Fee
50 bps
23 bps
9 bps
5 bps
1 bps
12 bps
Base
18.24
10.64
1.54 |
 13
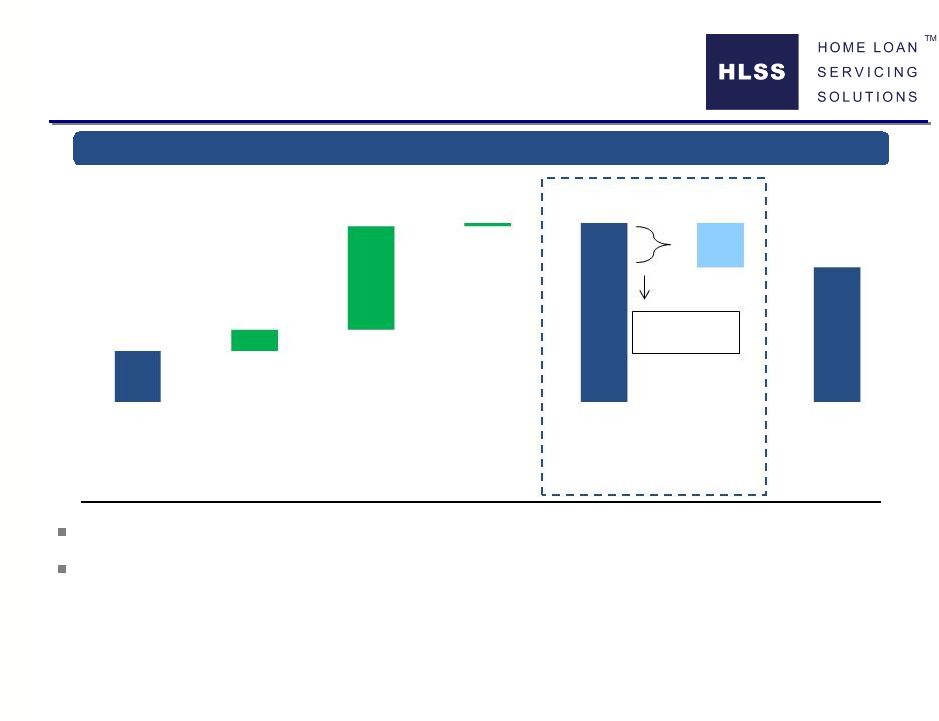
Cash generated available for distribution is 4x dividend declared during Q1
Cash
available
for
reinvestment
of
$65.89
million
allows
HLSS
to
replenish
and
grow
its servicing portfolio through additional purchases from Ocwen
($ in Millions)
First Quarter 2013 Cash Flow
Components of Cash Flow
Servicing
advances
decreased
by
$307.1
million,
excluding
the
most
recent
purchase,
freeing
up
the
cash
“haircut”
component
of
financing
1
$24.79
$87.50
$65.89
10.64
50.34
1.73
21.61
Net Income
Amortization of
MSRs
Decrease in
advance haircut
Changes in
other assets /
liabilities
Cash generated
available for
distribution
Dividends
declared
Cash
available for
reinvestment
4x Dividend
Coverage
1 |
 14
600bps Increase in LIBOR
HLSS Expects to Maintain Yield
Under Economic “Shocks”
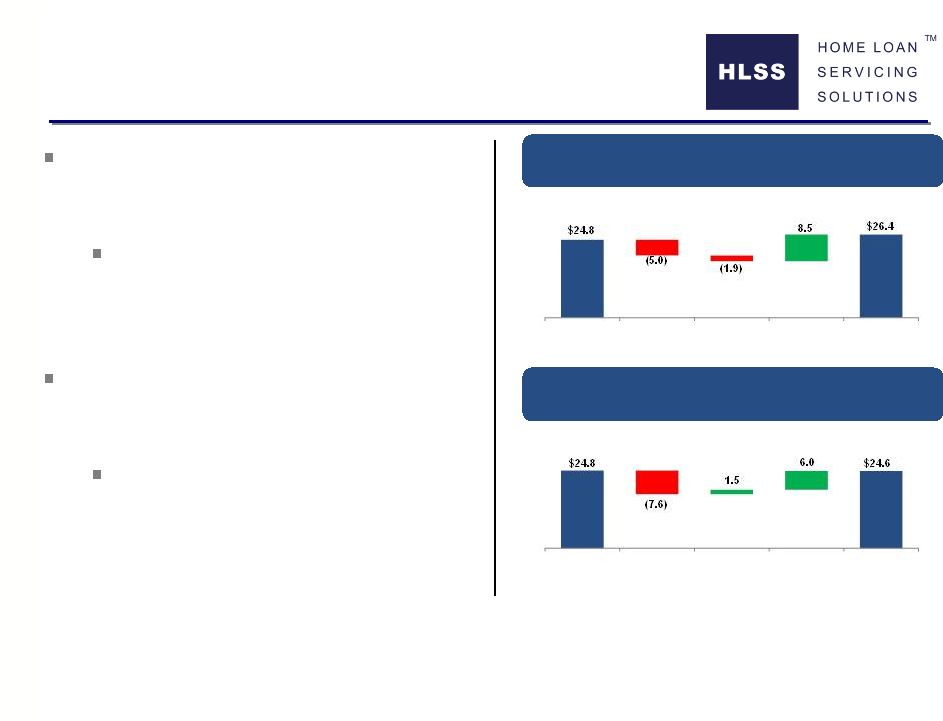
Estimated Impact of a Spike in Delinquencies
and Advances on Net Income
1
Estimated Impact of a Spike in
LIBOR on Net Income
2
($ in Millions)
($ in Millions)
20% Increase in Servicing Advance Ratio
Q1 2013
Net Income
Equity Yield
on Advance
Haircut
Reduction of
Subservicing
Fee
Q1 2013
Adjusted Net
Income
Increase in
Interest
Expense
Q1 2013
Net Income
Increase in
Interest
Income
Realized
Gain on
LIBOR
Swaps
Q1 2013
Adjusted Net
Income
Increase in
Interest
Expense
HLSS’s contract with Ocwen is designed to
stabilize earnings if delinquencies and
servicing advances increase
20% increase in Servicing Advance
Ratio resulting from a severe economic
environment not expected to reduce
earnings
Fixed rate term borrowing and interest rate
hedges are designed to stabilize earnings if
interest rates increase
600bps LIBOR spike on variable
borrowing largely offset by realized
gains on interest rate swaps
This analysis is based on results for the quarter ended March 31, 2013. Results for prior periods
and the estimated adjustments are not necessarily indicative of results or the impact of adjustments for future periods.
1
“
Increase in Interest Expense” reflects estimated increase in borrowing cost to finance higher
Servicing Advances assuming no changes in interest rates or prepayment speeds. “Equity Yield on Advance Haircut”
reflects the foregone earnings (based on current earnings yield) resulting from the reduction in
income-earning MSR assets as more capital is invested in the equity component of Servicing Advances. “Reduction
in Subservicing Fee” reflects the amount the Performance Fee (a component of the Subservicing Fee)
would be reduced pursuant to arrangements in place.
2
“Increase in Interest Expense” reflects impact of rate increase on variable rate borrowing on
Servicing Advances based on the current note structure and assumes no change in asset values. “Increase in Interest
Income“ reflects the increase in interest earned on reserve accounts and corporate cash.
“Realized Gain on LIBOR Swaps” is based on swaps in place during Q1 2013 and assumes hedge accounting; it does not
include the change in swap deposits.
|
 15
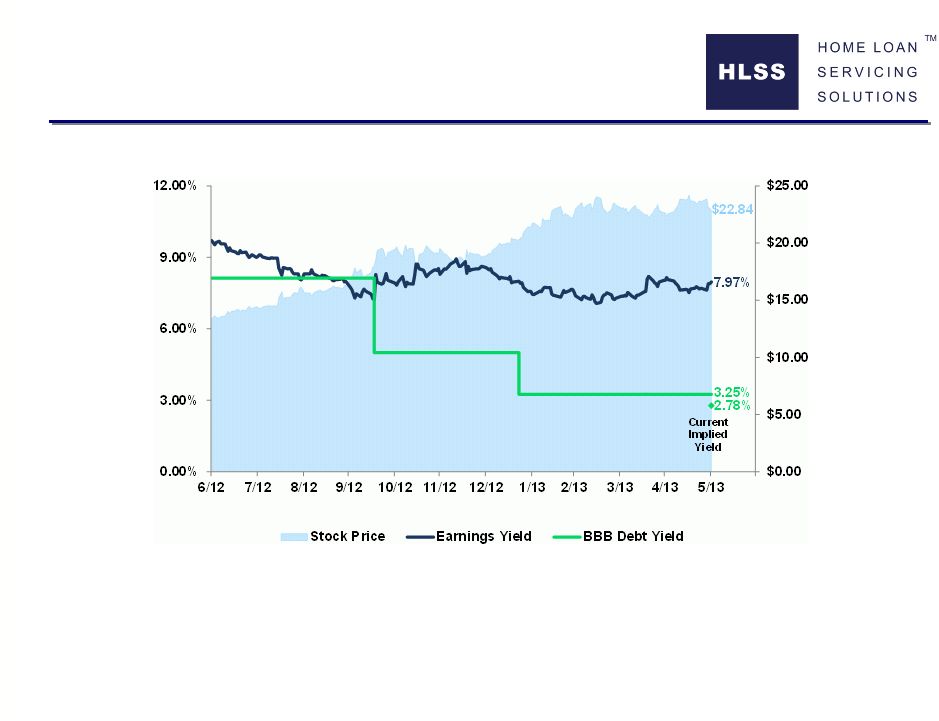
Equity and Debt Yields
Note: Earnings yields based on annualized per-share earnings guidance of $0.325 (Q1 2012 earnings
transcript), $0.325 (Q2 2012 earnings transcript), $0.385 (Q3 2012 earnings transcript), $0.405
(11/15/2012 press release), $0.425 (Q4 2012 earnings transcript) and $0.455 (Q1 2013 earnings transcript); calculation at a given date
contains most recent guidance divided by the share price. Debt yields based on
the most recent, 3-year BBB-rated servicing advance securitization at each respective date. Current implied yield point based on interpolation of
recently priced 2-year BBB-rated and 4-year BBB-rated servicing advance
securitizations. Prospective purchasers should not place undue reliance on expectations or guidance shown above, and
the presentation of guidance and results from prior periods should not be regarded as a representation that similar or better results will be achieved in future periods. |
 16
Investment Highlights
Attractive risk-adjusted returns relative to other yield oriented
investments 7.4%
annualized
dividend
yield
based
on
current
share
price
23 times over-collateralization virtually eliminates credit risk
Asset
composition
–
90%
servicing
advances
and
cash
–
mitigates
valuation
risk
Profits purchased up front –
targeted return not dependent on asset appreciation or
valuations
Ocwen retains all operating risk under an incentive contract designed to stabilize
HLSS earnings
Solid downside protection with limited exposure to a down economy but opportunity
to increase dividend in an improving economy with rising interest
rates Cash flow in excess of dividend used to replenish and increase asset
base in accretive flow transactions
High Quality Assets
Stable Earnings Stream
Large Positive Alpha
Based on the closing share price of $22.84 per share on May 31, 2013.
1
1 |