Attached files
| file | filename |
|---|---|
| 8-K - 8-K - Inland Diversified Real Estate Trust, Inc. | q12013earningswebcast.htm |
Inland Diversified Real Estate Trust, Inc. First Quarter 2013 Earnings Webcast Thursday, May 30, 2013 2:00 PM (Central) Barry Lazarus, President & Chief Operating Officer Inland Diversified Real Estate Trust, Inc. Larry Sajdak, Vice President Inland Diversified Real Estate Services, LLC Steven Hippel, Chief Financial Officer & Treasurer Inland Diversified Real Estate Trust, Inc. Audio is available via webcast – dial in number not required.
Disclaimer 2 This is neither an offer to sell nor a solicitation of an offer to buy any security, which can be made only by a prospectus which has been filed or registered with appropriate state and federal regulatory agencies and sold only by broker dealers authorized to do so. Past performance is not a guarantee of future results. When making an investment decision in Inland Diversified Real Estate Trust, Inc. (“Inland Diversified”) investors should not rely on past performance of the REITs or real estate programs sponsored by Inland Real Estate Investment Corporation (“Inland Investments”) to predict future results. An investment in Inland Diversified will not entitle an investor to ownership in any other REIT or investment program sponsored by Inland Investments. All of the properties represented in photos herein are owned by Inland Diversified or its subsidiaries. The companies depicted in the photographs herein may have proprietary interests in their trade names and trademarks and nothing herein shall be considered to be an endorsement, authorization or approval of Inland Diversified or its subsidiaries. Furthermore, none of these companies are affiliated with Inland Diversified or its subsidiaries in any manner. The Inland name and logo are registered trademarks being used under license. This material has been distributed by Inland Securities Corporation, dealer manager for Inland Diversified. Inland Securities Corporation member FINRA/SIPC. Inland Diversified is a part of The Inland Real Estate Group of Companies, Inc., a group of independent legal entities some of which may be affiliates, share some common ownership or have been sponsored and managed by Inland Investments or its subsidiaries. Date first published: 12/1/11 Current publication date: 5/30/13
Risk Factors 3 An investment in Inland Diversified Real Estate Trust, Inc. (“Inland Diversified” or the “Company”) involves a high degree of risk. You should purchase Inland Diversified’s common stock only if you can afford a complete loss of your investment. Please consult the “Risk Factors” and “Conflicts of Interest” sections of the prospectus, as supplemented, for a more detailed discussion. Material risks on an investment in Inland Diversified’s common stock include, but are not limited to, the following: The Company has a limited operating history and is subject to all of the business risks and uncertainties associated with any new business; the Company’s investment policies and strategies are very broad and permit it to invest in numerous types of commercial real estate; the number and type of real estate assets the Company acquires will depend on the proceeds raised in its public offering; the amount and timing of distributions may vary, and there is no assurance that the Company will be able to continue paying distributions in any particular amount, if at all; no public market currently exists, and one may never exist, for the Company’s shares, and it is not required to liquidate; the Company may borrow up to 300% of its net assets, and principal and interest payments will reduce the funds available for distribution; the Company does not have employees and relies on its business manager and real estate managers to manage its business and assets; employees of the Company’s business manager, two of the Company’s directors, and two of the Company’s officers are also employed by its sponsor or its affiliates and face competing demands for their time and service and may have conflicts in allocating their time to the Company’s business and assets; the Company does not have an arm’s length agreements with its business manager, real estate managers or any other affiliates of its sponsor; the Company pays significant fees to its business manager, real estate managers and other affiliates of its sponsor; the Company’s business manager could recommend investments in an attempt to increase its fees which are generally based on a percentage of the Company’s invested assets and, in certain cases, the purchase price for the assets; and the Company may fail to continue to qualify as a REIT.
Strategic Plan Update 1. Successfully complete offering with $1.1 billion in raised capital 2. Invest all capital proceeds by year-end 2012 3. Carry momentum from 2012 into 2013 4. Pay monthly dividends from income sources other than investors’ capital 5. Maintain economic occupancy rate above 97% 6. Keep overhead (G&A) costs to a minimum level 7. Achieve lease renewal rate above 85% 8. Continue earnout closings or lease space as we gain control 9. Begin development activities 10. Establish joint venture relationship 11. Pursue liquidity event 4
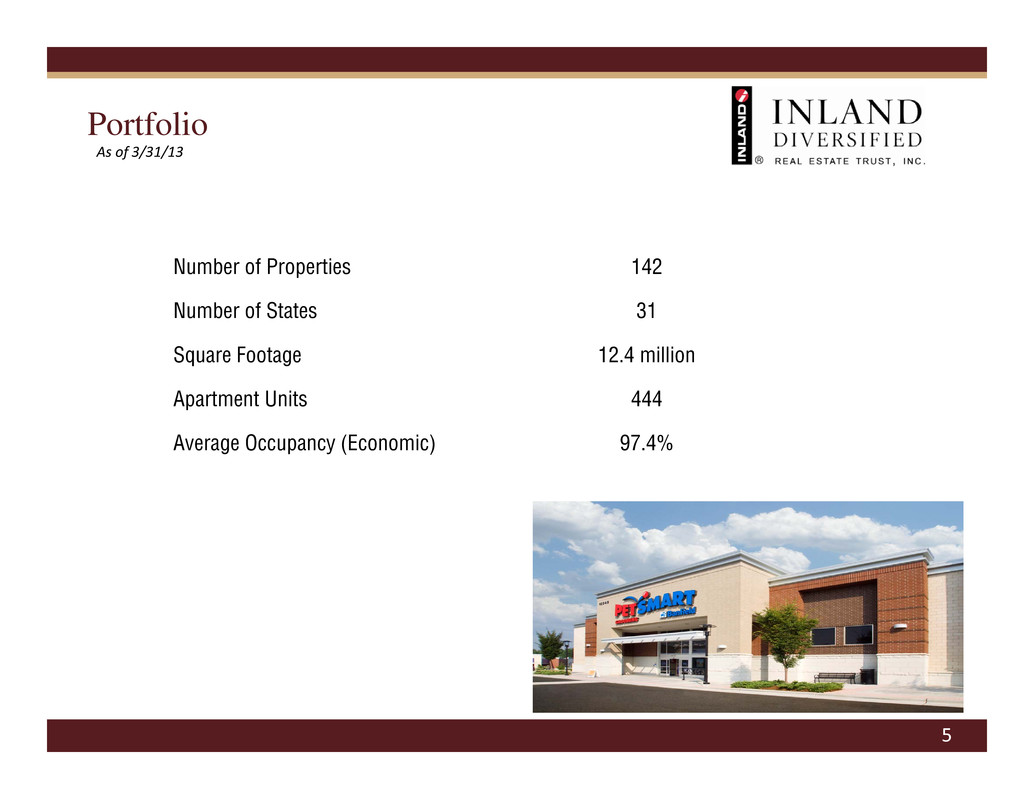
Portfolio 5 Number of Properties 142 Number of States 31 Square Footage 12.4 million Apartment Units 444 Average Occupancy (Economic) 97.4% As of 3/31/13
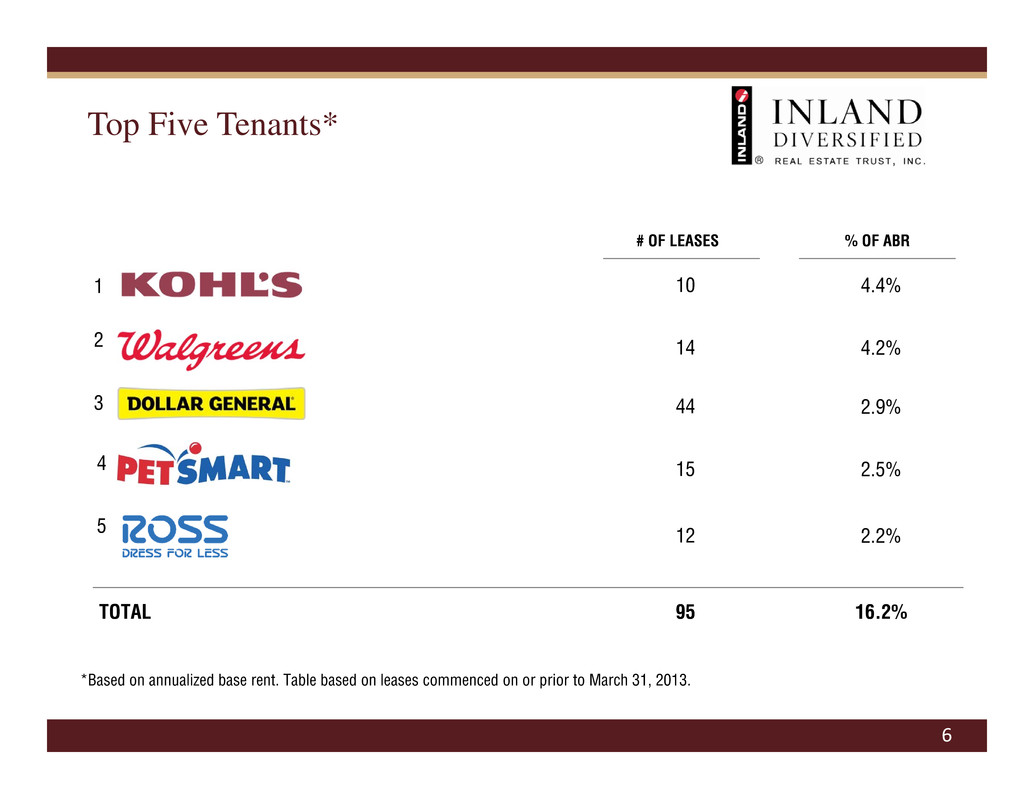
Top Five Tenants* 6 *Based on annualized base rent. Table based on leases commenced on or prior to March 31, 2013. # OF LEASES 10 14 44 15 12 % OF ABR 4.4% 4.2% 2.9% 2.5% 2.2% TOTAL 95 16.2% 1 2 3 4 5
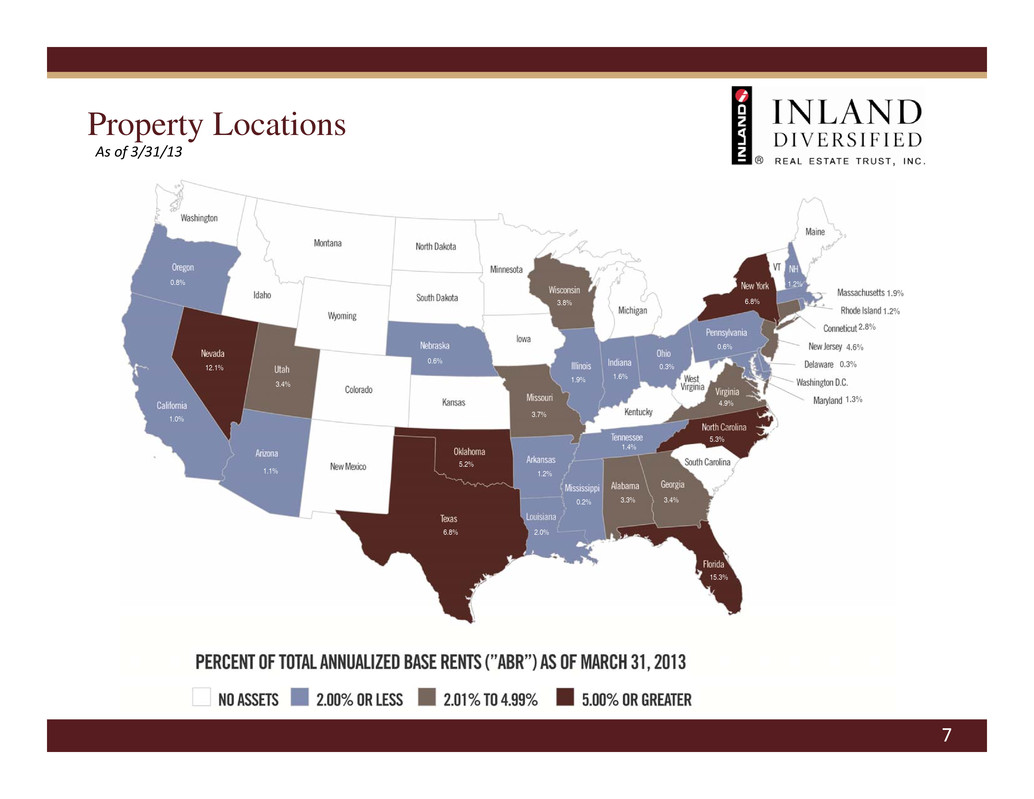
Property Locations 7 As of 3/31/13 1.0% 3.3% 1.2% 1.1% 2.8% 0.3% 15.3% 3.4% 1.9% 1.6% 2.0% 1.9% 1.3% 3.7% 0.2% 5.3% 0.6% 1.2% 4.6% 12.1% 6.8% 0.3% 5.2% 0.8% 0.6% 1.2% 1.4% 6.8% 3.4% 4.9% 3.8%
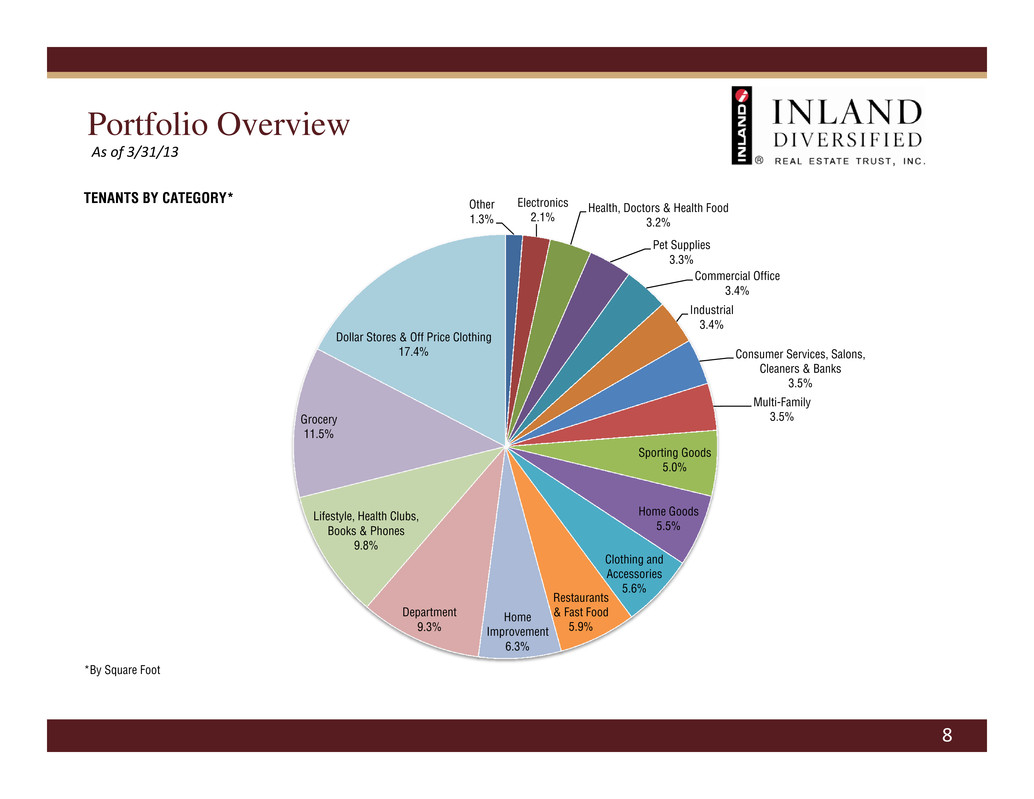
Portfolio Overview As of 3/31/13 8 TENANTS BY CATEGORY* *By Square Foot Other 1.3% Electronics 2.1% Health, Doctors & Health Food 3.2% Pet Supplies 3.3% Commercial Office 3.4% Industrial 3.4% Consumer Services, Salons, Cleaners & Banks 3.5% Multi-Family 3.5% Sporting Goods 5.0% Home Goods 5.5% Clothing and Accessories 5.6% Restaurants & Fast Food 5.9% Home Improvement 6.3% Department 9.3% Lifestyle, Health Clubs, Books & Phones 9.8% Grocery 11.5% Dollar Stores & Off Price Clothing 17.4%
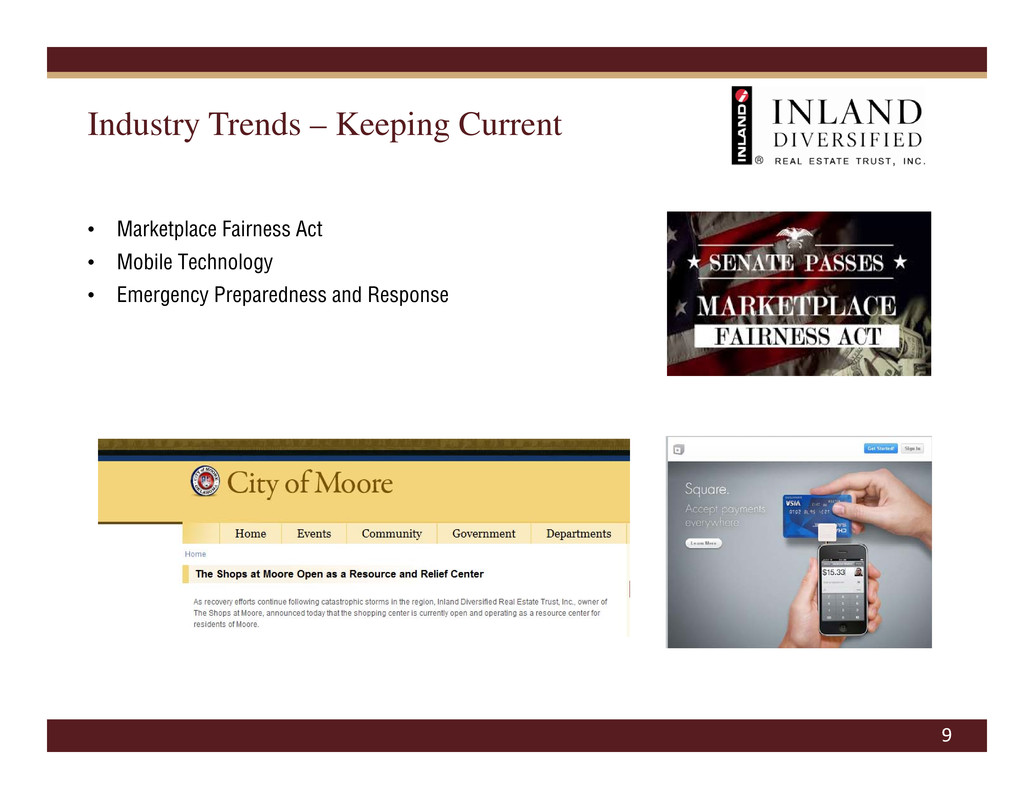
9 Industry Trends – Keeping Current • Marketplace Fairness Act • Mobile Technology • Emergency Preparedness and Response
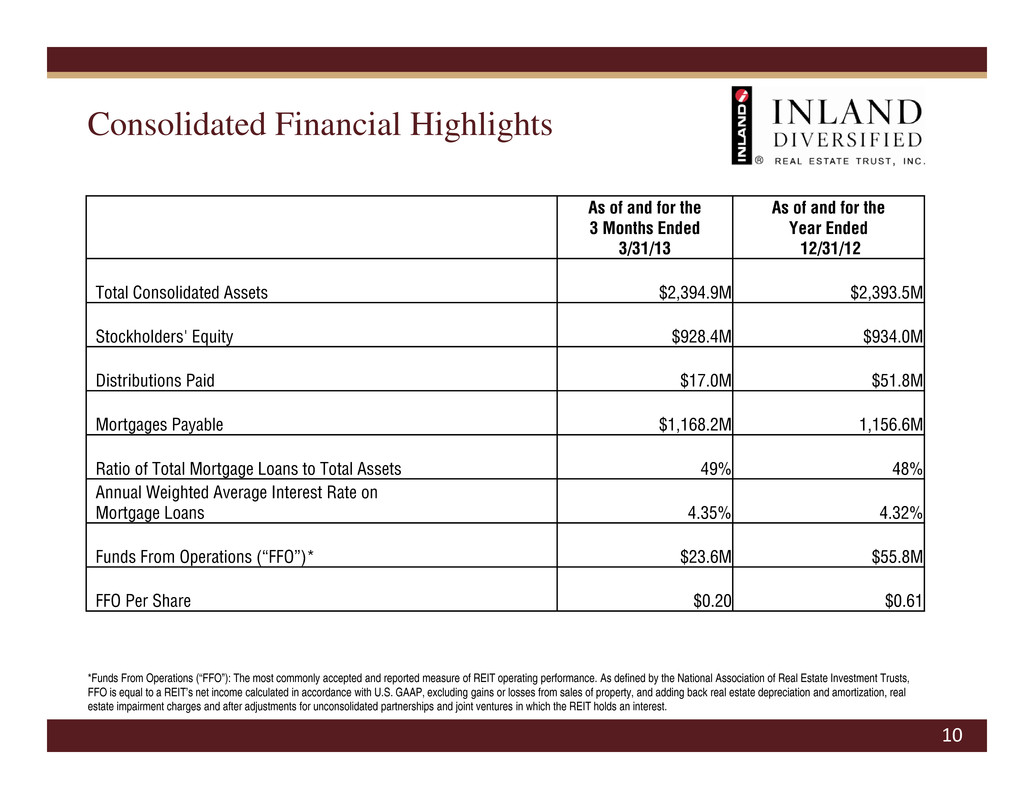
Consolidated Financial Highlights 10 As of and for the 3 Months Ended 3/31/13 As of and for the Year Ended 12/31/12 Total Consolidated Assets $2,394.9M $2,393.5M Stockholders' Equity $928.4M $934.0M Distributions Paid $17.0M $51.8M Mortgages Payable $1,168.2M 1,156.6M Ratio of Total Mortgage Loans to Total Assets 49% 48% Annual Weighted Average Interest Rate on Mortgage Loans 4.35% 4.32% Funds From Operations (“FFO”)* $23.6M $55.8M FFO Per Share $0.20 $0.61 *Funds From Operations (“FFO”): The most commonly accepted and reported measure of REIT operating performance. As defined by the National Association of Real Estate Investment Trusts, FFO is equal to a REIT’s net income calculated in accordance with U.S. GAAP, excluding gains or losses from sales of property, and adding back real estate depreciation and amortization, real estate impairment charges and after adjustments for unconsolidated partnerships and joint ventures in which the REIT holds an interest.
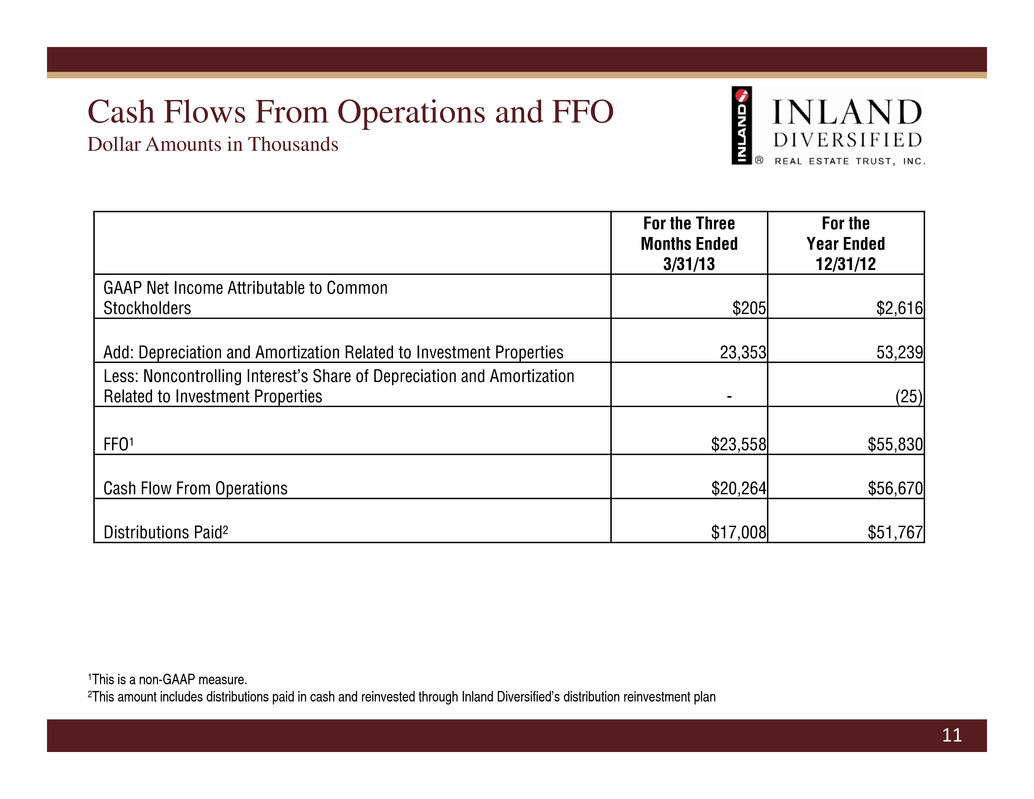
Cash Flows From Operations and FFO Dollar Amounts in Thousands 11 For the Three Months Ended 3/31/13 For the Year Ended 12/31/12 GAAP Net Income Attributable to Common Stockholders $205 $2,616 Add: Depreciation and Amortization Related to Investment Properties 23,353 53,239 Less: Noncontrolling Interest’s Share of Depreciation and Amortization Related to Investment Properties - (25) FFO1 $23,558 $55,830 Cash Flow From Operations $20,264 $56,670 Distributions Paid2 $17,008 $51,767 1This is a non-GAAP measure. 2This amount includes distributions paid in cash and reinvested through Inland Diversified’s distribution reinvestment plan
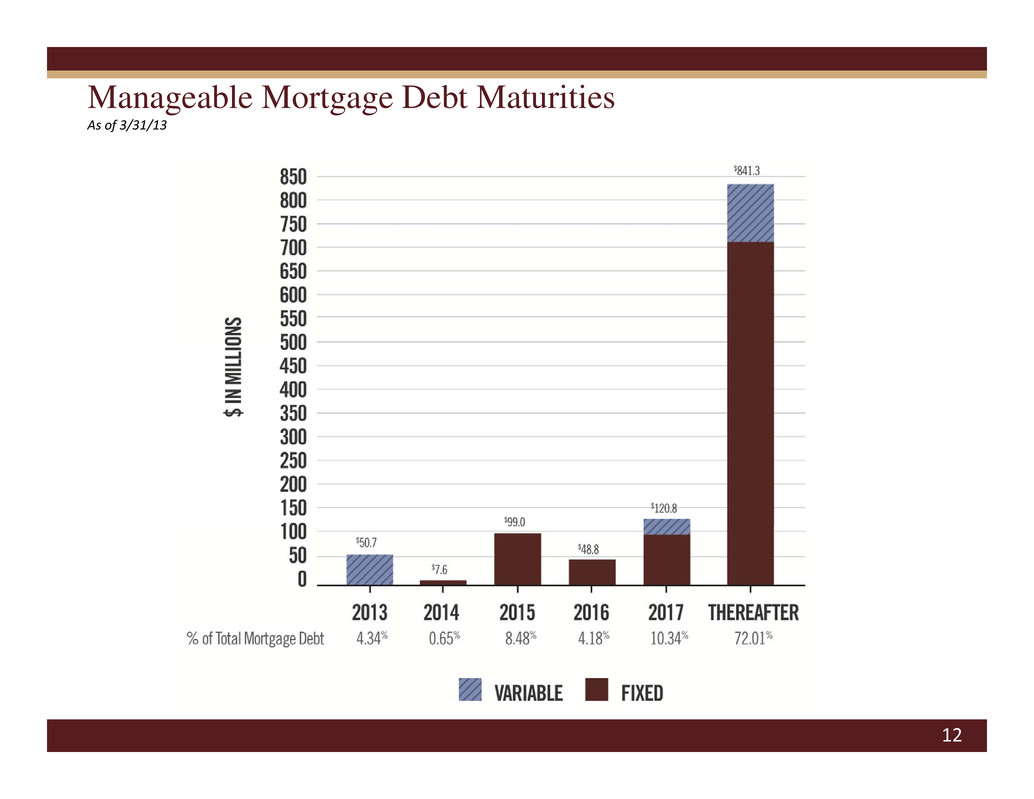
Manageable Mortgage Debt Maturities As of 3/31/13 12

13 Questions?
