Attached files
| file | filename |
|---|---|
| 8-K - FORM 8-K - Mondelez International, Inc. | d545685d8k.htm |
| EX-99.1 - EX-99.1 - Mondelez International, Inc. | d545685dex991.htm |
 Citi
Global Consumer Conference
May 29, 2013
Exhibit 99.2 |
 Forward-looking statements
2
This slide presentation contains a number of forward-looking statements.
The words “will,”
“expect,”
“opportunity,”
“growth,”
“reinvent,”
“reaffirm,”
and similar expressions are
intended to identify our forward-looking statements. Examples of
forward-looking statements include, but are not limited to, statements
we make about our future growth and expansion, including growth or expansion
in organic net revenue, operating income, operating EPS, operating income
margin, and gross margin; our plans for achieving such growth and expansion;
our expenditures for emerging markets investments and funding ongoing
restructuring and the results of such expenditures; and our 2013 guidance.
These forward-looking statements involve risks and uncertainties, many of which
are beyond our control, and important factors that could cause actual
results to differ materially from those in our forward-looking
statements include, but are not limited to, continued global economic
weakness, increased competition, continued volatility of commodity and other
input costs, pricing actions, risks from operating globally, and tax law
changes. For additional information on these and other factors that could affect our
forward-looking
statements,
see
our
risk
factors,
as
they
may
be
amended
from
time
to
time, set forth in our filings with the SEC, including our most recently filed
Annual Report on
Form
10-K.
We
disclaim
and
do
not
undertake
any
obligation
to
update
or
revise
any
forward-looking
statement
in
this
slide
presentation,
except
as
required
by
applicable
law
or regulation. |
 Irene
Rosenfeld Chairman & CEO |
 Mondelez
International
is
a
unique
investment vehicle…
Advantaged
Geographic
Footprint
Fast-
Growing
Categories
Favorite
Snacks
Brands
Strong
Routes-to-
Market
Proven
Innovation
Platforms
World-Class
Talent &
Capabilities
4 |
 …with top-tier revenue and earnings
potential
Operating EPS Growth
5%-7%
Double-Digit
(constant FX)
Organic Net Revenue Growth
Long-Term Targets
Operating Income Growth
High Single-Digit
(constant FX)
5 |
 Double Digit
Growth
Low-to-Mid
Single Digit
Growth
$35B
Developed
Markets
Emerging
Markets
By Geography
$35B
Low-to-Mid
Single Digit
Growth
Mid-to-High
Single Digit
Growth
Chocolate
Biscuits
Gum &
Candy
Beverages
Ch./Groc.
By Category
5% -
7%
Organic Growth
6
Top-tier revenue growth is clearly achievable |
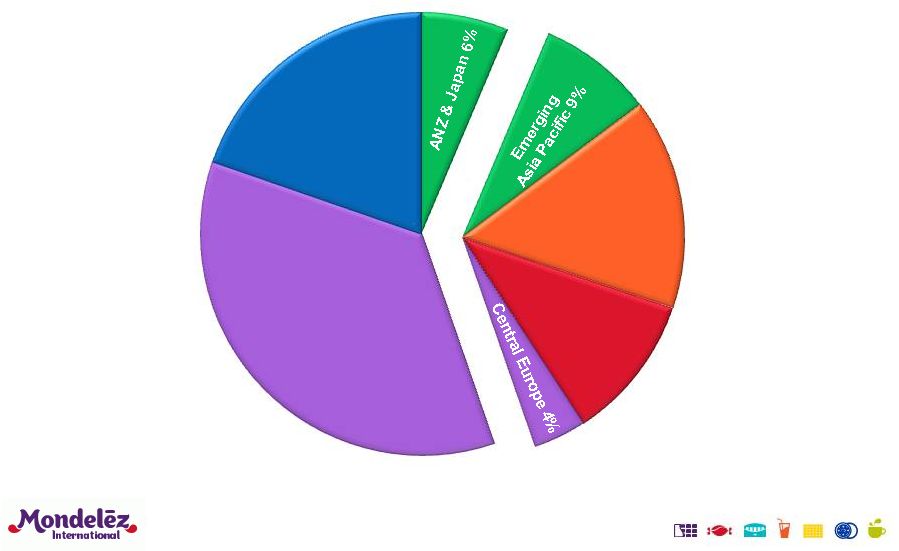 Latin America
15%
EEMEA
11%
Europe,
excluding
Central Europe
35%
North America
20%
Nearly 40% of portfolio in emerging
markets
7
Developed
Markets
~60%
Emerging
Markets
~40%
$35 Billion in
2012 Net Revenues |
 Emerging markets are highly attractive
8
GDP per Capita
($ in thousands)
GDP per Capita
($ in thousands)
Consumption vs. GDP per Capita
Source: Euromonitor 2011
Snacks
categories
growing
at
high
single
digits
/
double
digits
Rising GDP fuels rapidly growing per capita snacks consumption
Opportunity for high rates of return
Chocolate
Biscuits |
 Race is
on to secure and expand positions in emerging markets
9
Companies that fortify strong positions over the next
3 to 5 years will win
Nestle statement on 9/25/12
Hershey statement on 2/20/13
Kellogg statement on 2/20/13
“We're placing a big bet in China
and anticipate it will be Hershey's
number two market, behind only the
US in the coming five years”
“Russia has the potential to be the number
one consumer market in Europe by 2020…
Adding in Pringles …
provides a fantastic
platform for us to capitalize on growth in this
market in the years ahead”
“Africa and Middle East are growth
engines for the future. Nestle’s
objective is to triple the business
by 2020 at constant currency” |
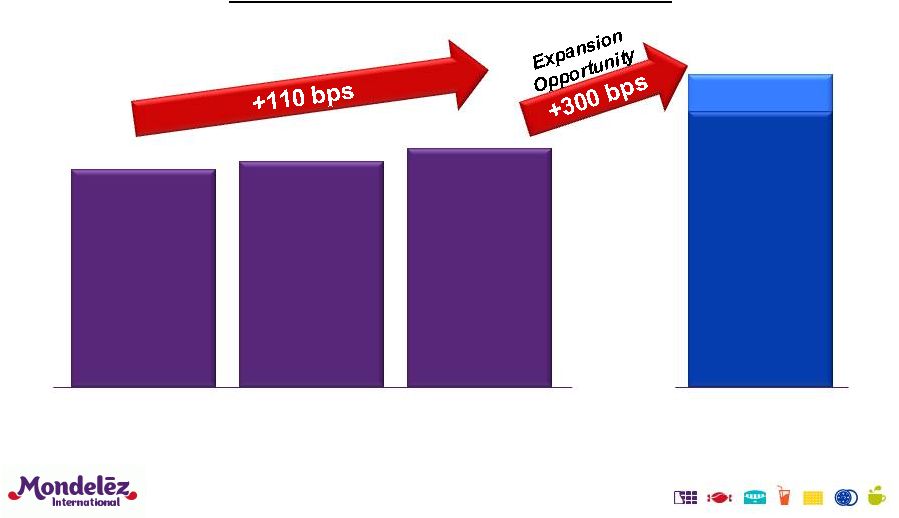 Steady
improvement in OI margin with significant expansion opportunity
Adjusted
Operating
Income
Margin
2011
2012
11.5%
12.2%
2010
11.1%
Peer Average
14%-16%
10
Note: Please see the GAAP to non-GAAP reconciliations provided at the end of
this presentation. |
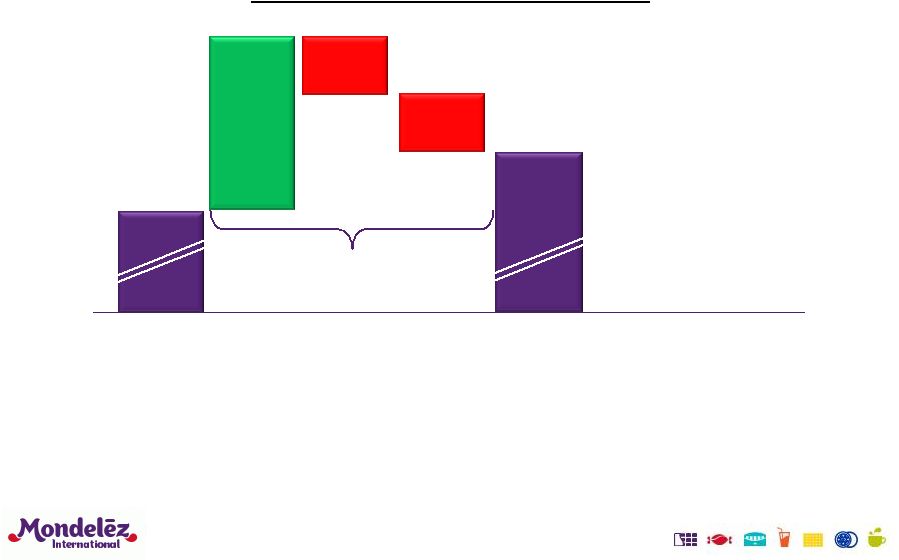
 11
Significant base margin expansion
opportunity
(1) Please see the GAAP to non-GAAP reconciliations provided at the end
of this presentation. Adjusted Operating Income Margin
2012
Base
Margin
Expansion
+60 to
+90 bps
Annually
12.2%
(1) |
 Opportunity is largely in North America
and Europe
12
Adjusted Operating Income Margin
13.9%
18%-21%
2012
Peer Average
North America
Europe
13.0%
13%-16%
2012
Peer Average
LA, AP, EEMEA
Combined
14.3%
12%-14%
2012
Peer Average
Note: Please see the GAAP to non-GAAP reconciliations provided at the end of
this presentation. |
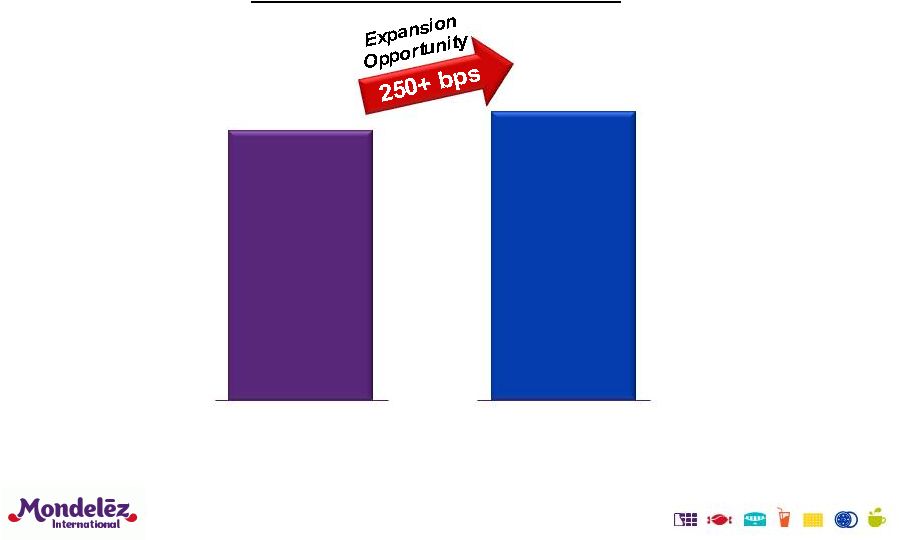 Gross
margin is our biggest opportunity Peer Average
40%+
2012
37.6%
Adjusted
Gross
Profit
Margin
13
Note: Please see the GAAP to non-GAAP reconciliations provided at the end of
this presentation. |
 NORTH
AMERICA: Significant opportunity for margin expansion
13.8%
13.9%
18%-21%
2011
2012
Peer Average
Adjusted Segment
Operating Income Margin
14
14.0%
2010
Drive Power Brands and
product mix
Cost Management and Overheads
•
Target 4%+ COGS productivity
•
Remove dis-synergies
Reinvent Supply Chain
•
Install new technology
•
Repatriate production
Key Drill Sites
Note: Please see the GAAP to non-GAAP reconciliations provided at the end of
this presentation. |
 NORTH AMERICA: Cost
management and overhead reduction opportunities
l
Cost Management
–
Lean Six Sigma productivity
–
Increase procurement savings
l
Overhead Reduction
–
Reduce/eliminate dis-synergies
–
Capture synergies between U.S. and Canada
–
Leverage SAP; eliminate redundant systems
15 |
 NORTH AMERICA: Reinventing
the supply chain drives gross margin expansion
l
Introduce new technology to improve throughput
l
Repatriate production from co-manufacturers
l
Complete closure of Lakeshore Bakery (Toronto)
16 |
 EUROPE: Continue steady margin progress
12.3%
13.0%
13%-16%
2011
2012
Peer Average
Adjusted Segment
Operating Income Margin
17
11.8%
2010
Expand Gross Margin
•
Drive Power Brands and
product mix
•
Target 4%+ COGS productivity
•
Streamline supply chain
Reduce overheads
•
Integrate Central Europe into
category model
•
Leverage service centers in
low cost locations
Key Drill Sites
Note: Please see the GAAP to non-GAAP reconciliations provided at the end of
this presentation. |
 EUROPE:
Significant supply chain optimization
opportunity
18
Net Revenue Per Plant
($ millions)
All Other
Plants
Average
% of plants
A Plants
15%
85%
Peer Average
$400
$200
$390
$150
$180 |
 EUROPE: Continue to drive overhead
efficiencies
19
Overhead reductions primary driver of margin
improvement since 2009
Unlocked scale through category model
Achieved synergies integrating LU and Cadbury
Consolidated business on fully-harmonized SAP system
Integrating Central European countries into category model
Deliver best-in-class cost by leveraging low cost locations
Aiming to further optimize overhead structure |
 20
Stepping up investments in emerging
markets to create value
(1) Please see the GAAP to non-GAAP reconciliations provided at the end
of this presentation. Adjusted Operating Income Margin
2012
Base
Margin
Expansion
Emerging
Markets
Investments
+60 to
+90 bps
Annually
(20) to
(30) bps
Annually
12.2%
(1) |
 Focused emerging markets investments
provide growth and attractive returns
Opportunities:
Disciplined approach with attractive
returns
IRR well in excess of cost of capital
21
$200
$200-
$300
2014
2015+
$100
2013
Payback
Boost Power Brand Support
~1 year
RTM, Sales Expansion
1-2 years
White Space Entries
3-5 years
($ millions)
Incremental Investments
in Emerging Markets |
 22
Funding ongoing restructuring to improve
long-term cost structure
(1) Please see the GAAP to non-GAAP reconciliations provided at the end
of this presentation. Adjusted Operating Income Margin
2012
Base
Margin
Expansion
Emerging
Markets
Investments
Ongoing
Restructuring
+60 to
+90 bps
Annually
(20) to
(30) bps
Annually
(20) to
(30) bps
Annually
12.2%
(1) |
 Ongoing restructuring will continue to
drive long-term efficiency
23
$100
$200-
$300
2014
2015+
2013
•
Moving to “Pay as You Go”
model once 2012–2014
program completed
•
Included in long-term growth
algorithm and guidance
($ millions)
Ongoing
Restructuring Investments
$100 |
 Expect
moderate margin expansion over the next three years …
24
(1) Please see the GAAP to non-GAAP reconciliations provided at the end
of this presentation. Adjusted Operating Income Margin
2012
Base
Margin
Expansion
Emerging
Markets
Investments
Ongoing
Restructuring
+60 to
+90 bps
Annually
(20) to
(30) bps
Annually
(20) to
(30) bps
Annually
~13%
2015
+20 to +30 bps
Annual Average
12.2%
(1) |
 …
with more significant opportunities
longer term
25
Adjusted Operating Income Margin
2012
Base
Margin
Expansion
Emerging
Markets
Investments
Ongoing
Restructuring
+60 to
+90 bps
Annually
(20) to
(30) bps
Annually
(20) to
(30) bps
Annually
~13%
2015
Target
14-16%
Base
Margin
Expansion
+40 to
+60 bps
Annually
+20 to +30 bps
Annual Average
12.2%
(1)
* On a constant currency basis
(1) Please see the GAAP to non-GAAP reconciliations provided at the end
of this presentation. Double Digit EPS Growth* |
 Reaffirming 2013 guidance
•
Organic revenue growth at the low end of 5-7% range
–
Coffee pricing and capacity constraints tempering 1H growth by ~1.5 pp
–
Revenue growth in 2H expected to accelerate
•
On
track
to
deliver
Operating
EPS
of
$1.55
to
$1.60
(+14%
-
18%
on
a
constant currency basis)
–
1H margin tempered versus year-ago
•
Negative impact of Venezuela devaluation and PY one-time items
•
Dis-synergies and stepped up emerging markets investments
•
Q2 cycling a difficult PY comparison
–
Stronger 2H margin
•
Revenue growth increases leverage
•
Lower impact of dis-synergies
–
Full year margin likely to be flat
–
Tax favorabilities enable head start on investment
26 |
 Delivering significant shareholder value
27
Operating EPS Growth
5%-7%
Double-Digit
(constant FX)
Organic Net Revenue Growth
Long-Term Targets
Operating Income Growth
High Single-Digit
(constant FX)
Targeting
14%
–
16%
Margins |
 28 |
 Appendix: Operating Income Margin –
Total Company
29
Total
Company
Operating
Income
Margins
(fiscal year 2012)
(1)
1)
Reflects trading operating profit ex asset impairments
* Please see the GAAP to non-GAAP reconciliations provided at the end of this
presentation. Source: Company Reports.
23.5%
23.4%
18.6%
18.5%
16.1%
15.9%
15.3%
14.9%
14.4%
14.2%
12.2%*
CL
KO
PG
HSY
GIS
CPB
NESN
PEP
K
HNZ
BN
ULVR
MDLZ
14.7%
13.8% |
 Appendix: Operating Income Margin –
North America
30
North
America
Operating
Income
Margins
(fiscal year 2012)
(1)
(2)
(3)
(4)
(5)
(10)
1)
Reflects PepsiCo NA Food.
2)
Reflects North America, excluding CIS. Reflects deduction for partial
corporate expense. 3)
Reflects North America.
4)
Reflects US.
5)
Reflects Global, which is about 99% North America.
6)
Reflects US Simple Meals, US Beverages, North America Foodservice and half of
Global Baking & Snacking. 7)
Reflects North America and Latin America, excluding globally managed businesses
(mainly Water, Nutrition, Nespresso, Professional). Reflects trading
operating profit ex asset impairments 8)
Reflects Global, which is about 90% North America. Reflects deduction for corporate
expense. 9)
Reflects North America. Excludes Pringles integration costs.
10)
Reflects
North
America
and
Latin
America.
Reflects
deduction
for
partial
corporate
expense.
(6)
(7)
(8)
(9)
* Please see the GAAP to non-GAAP reconciliations provided at the end of this
presentation. Source: Company Reports.
27.1%
22.5%
21.0%
20.7%
20.0%
19.9%
18.6%
18.2%
16.6%
14.2%
13.9%*
PEP
BN
HNZ
GIS
SJM
CPB
NESN
HSY
K
ULVR
MDLZ |
 Appendix: Operating Income Margin –
Europe
31
Europe
Operating
Income
Margins
(fiscal
year
2012)
(1)
(2)
(5)
(4)
(3)
(6)
1)
Reflects Europe, including Russia.
2)
Reflects Europe, including Central Europe, Russia and Turkey, but excluding
globally managed businesses (mainly Water, Nutrition, Nespresso,
Professional). Reflects trading operating profit ex asset impairments.
3)
Reflects Europe, including Central Europe. Reflects deduction for partial
corporate expense. 4)
Reflects
Europe,
including
Central
Europe.
Reflects
deduction
for
partial
corporate
expense.
5)
Reflects
Europe,
including
Russia.
Excludes
Pringles
integration
costs.
6)
Reflects Europe, including Russia and South Africa.
* Please see the GAAP to non-GAAP reconciliations provided at the end of this
presentation. Source: Company Reports.
17.7%
16.0%
15.7%
14.2%
13.0%*
11.3%
10.3%
HNZ
NESN
BN
ULVR
MDLZ
K
PEP |
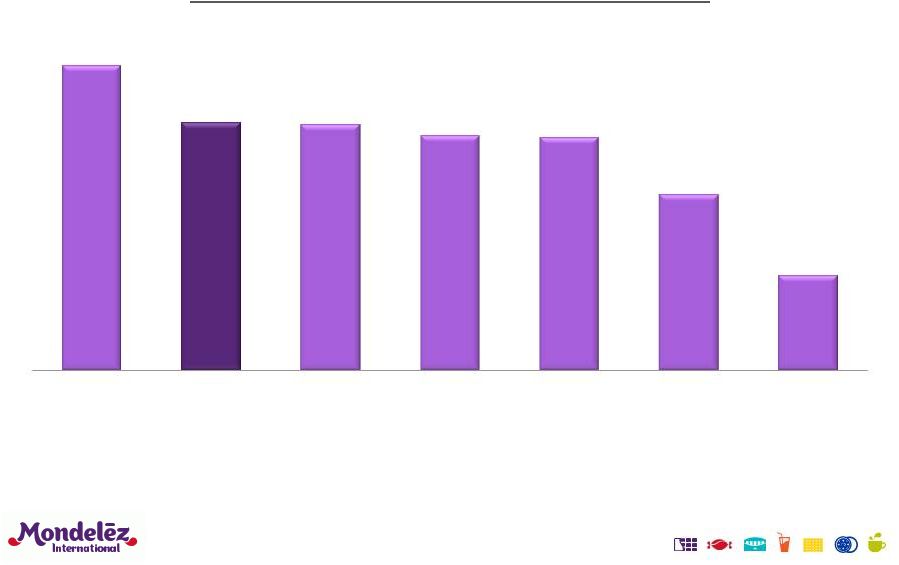 Appendix: Operating Income Margin –
Latin America
32
Latin
America
Operating
Income
Margins
(fiscal
year
2012)
(1)
(2)
(5)
(3)
(4)
(6)
1)
Reflects North America and Latin America, excluding globally managed businesses
(mainly Water, Nutrition, Nespresso, Professional). Reflects trading
operating profit ex asset impairments. 2)
Reflects Latin America. Excludes Pringles integration costs.
3)
Reflects Latin America Foods.
4)
Reflects
North
America
and
Latin
America.
Reflects
decision
for
partial
corporate
expense.
5)
Reflects Rest of World (Latin America, Middle East and Africa).
6)
Reflects Latin America, Middle East and Africa, and CIS. Reflects decision for
partial corporate expense.
* Please see the GAAP to non-GAAP reconciliations provided at the end of this
presentation. Source: Company Reports.
18.6%
15.1%*
15.0%
14.3%
14.2%
10.7%
5.8%
NESN
MDLZ
K
PEP
ULVR
HNZ
BN |
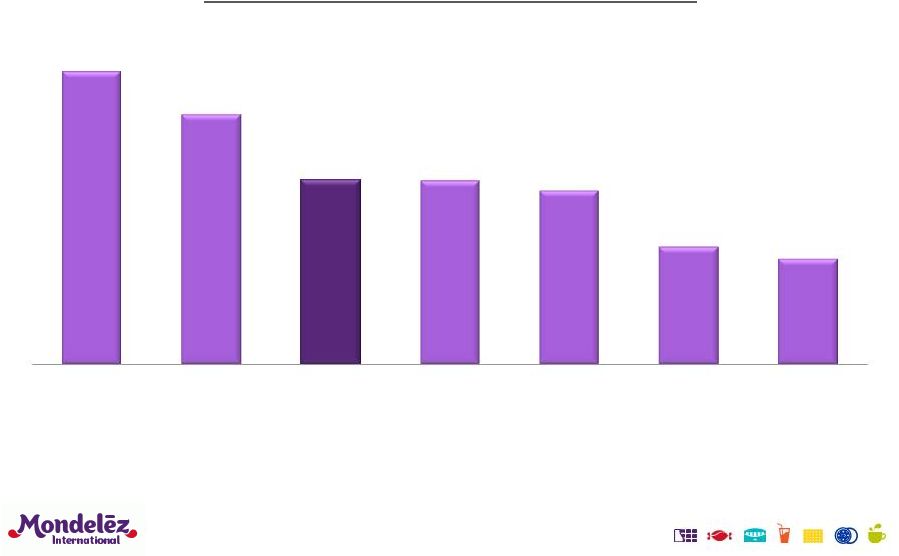 Appendix: Operating Income Margin –
Asia Pacific
33
Asia
Pacific
Operating
Income
Margins
(fiscal
year
2012)
1)
Reflects Asia. Reflects deduction for partial corporate expense.
2)
Reflects Asia, Oceania, Africa, excluding globally managed businesses (mainly
Water, Nutrition, Nespresso, Professional). Reflects trading operating
profit ex asset impairments. 3)
Reflects Asia, Middle East and Africa, excluding South Africa.
4)
Reflects Asia, Africa, Middle East, Turkey, Russia, Ukraine and Belarus.
Reflects deduction for partial corporate expense.
5)
Reflects Asia Pacific. Excludes Pringles integration costs.
6)
Reflects Asia Pacific.
(1)
(2)
(5)
(3)
(4)
(6)
* Please see the GAAP to non-GAAP reconciliations provided at the end of this
presentation. Source: Company Reports.
22.1%
18.9%
13.9%*
13.9%
13.1%
8.9%
8.0%
BN
NESN
MDLZ
PEP
ULVR
K
HNZ |
 Appendix: Operating Income Margin –
EEMEA
34
EEMEA
Operating
Income
Margins
(fiscal year 2012)
(1)
(2)
(5)
(4)
1)
Reflects Asia, Oceania, Africa, excluding globally managed businesses (mainly
Water, Nutrition, Nespresso, Professional). Reflects trading operating
profit ex asset impairments. 2)
Reflects Asia, Middle East and Africa, excluding South Africa.
3)
Reflects Asia, Africa, Middle East, Turkey, Russia, Ukraine and Belarus.
Reflects deduction for partial corporate expense.
4)
Reflects Rest of World (Latin America, Middle East and Africa).
5)
Reflects Latin America, Middle East, Africa and CIS. Reflects deduction for
partial corporate expense.
(3)
* Please see the GAAP to non-GAAP reconciliations provided at the end of this
presentation. Source: Company Reports.
18.9%
13.9%*
13.9%
13.1%
10.7%
5.8%
NESN
MDLZ
PEP
ULVR
HNZ
BN |
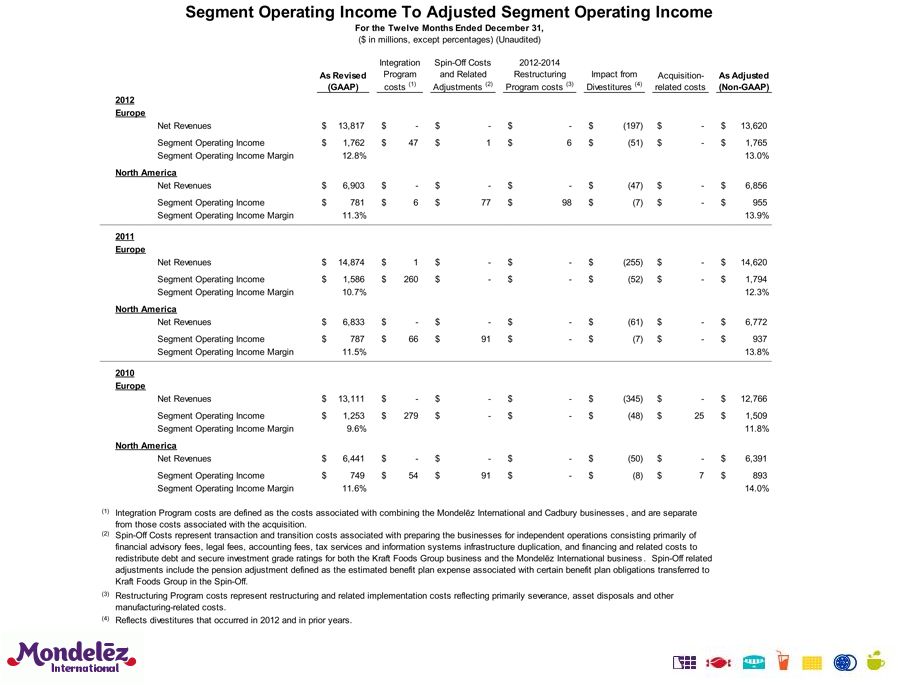
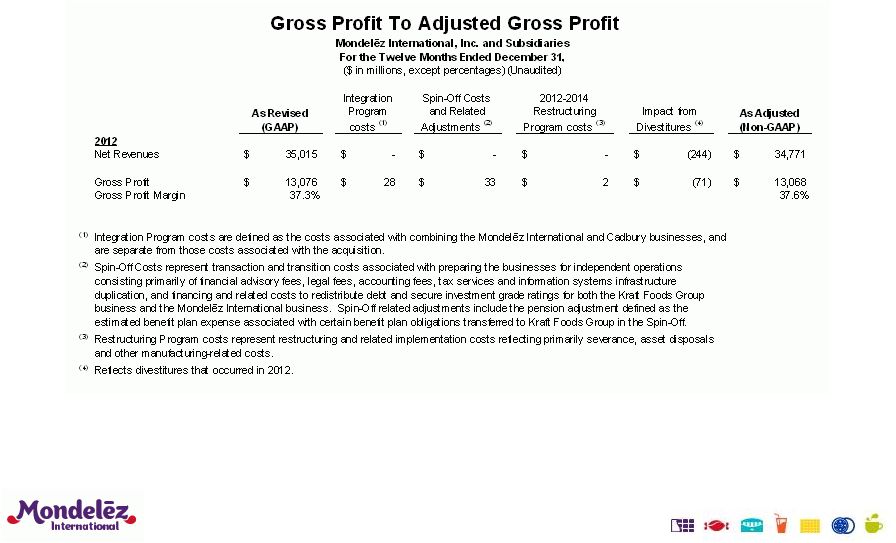 GAAP
to Non-GAAP Reconciliation 35 |
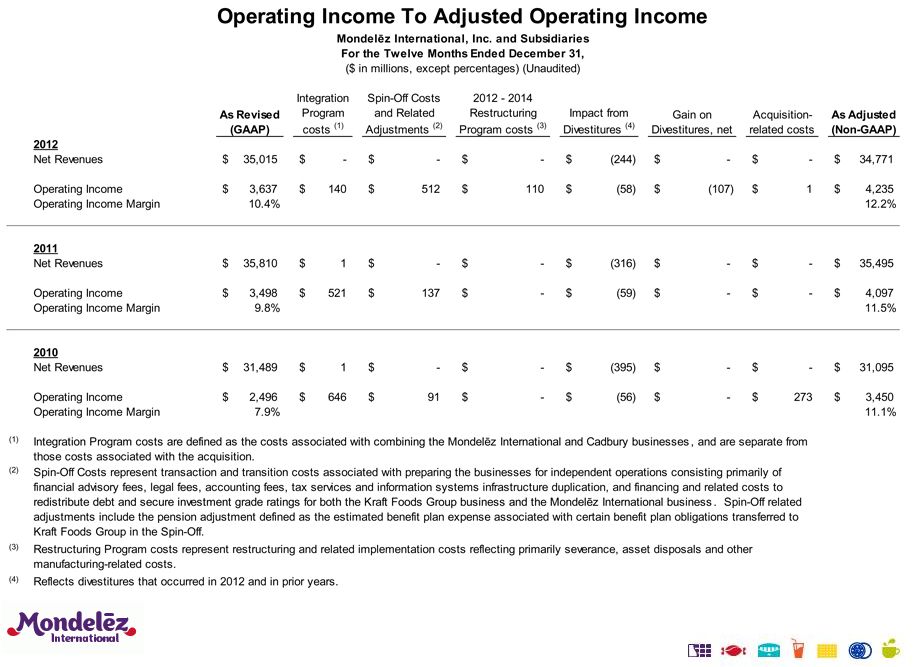 GAAP
to Non-GAAP Reconciliation 36 |
 GAAP
to Non-GAAP Reconciliation 37 |
 GAAP
to Non-GAAP Reconciliation 38 |