Attached files
| file | filename |
|---|---|
| 8-K - CUSTOMERS BANCORP, INC. FORM 8-K - Customers Bancorp, Inc. | customers8k.htm |
Exhibit 99.1

2013 Annual Shareholders Meeting
Effortless Banking

2
This presentation as well as other written or oral communications made from time to time by us, may contain certain forward-looking
information within the meaning of the Securities Act of 1933, as amended, and the Securities Exchange Act of 1934, as amended. These
statements relate to future events or future predictions, including events or predictions relating to our future financial performance, and
are generally identifiable by the use of forward-looking terminology such as “believes,” “expects,” “may,” “will,” “should,” “plan,” “intend,”
“target,” or “anticipates” or the negative thereof or comparable terminology, or by discussion of strategy or goals or other future events,
circumstances or effects. These forward-looking statements regarding future events and circumstances involve known and unknown
risks, uncertainties and other factors that may cause our actual results, levels of activity, financial condition, performance or
achievements to be materially different from any future results, levels of activity, financial condition, performance or achievements
expressed or implied by such forward-looking statements. This information is based on various assumptions, estimates or judgments by
us that may not prove to be correct.
Important factors to consider and evaluate in such forward-looking statements include:
· changes in competitive and market factors that might affect our results of operations;
· changes in laws and regulations, including without limitation changes in capital requirements under the Basel III capital
proposals;
· changes in our business strategy or an inability to execute our strategy due to the occurrence of unanticipated events;
· our ability to identify potential candidates for, and consummate, acquisition or investment transactions;
· the timing of acquisition or investment transactions;
· our failure to complete any or all of the transactions described herein on the terms currently contemplated;
· local, regional and national economic conditions and events and the impact they may have on us and our customers;
· targeted or estimated returns on assets and equity, growth rates and future asset levels
· our ability to attract deposits and other sources of liquidity and capital;
· changes in the financial performance and/or condition of our borrowers;
· changes in the level of non-performing and classified assets and charge-offs;
· changes in estimates of future loan loss reserve requirements based upon the periodic review thereof under relevant regulatory
and accounting requirements, as well as changes in borrowers payment behavior and creditworthiness;
and accounting requirements, as well as changes in borrowers payment behavior and creditworthiness;
· changes in our capital structure resulting from future capital offerings or acquisitions;
· inflation, interest rate, securities market and monetary fluctuations;
· the affects on our mortgage warehouse lending and retail mortgage businesses of changes in the mortgage origination
markets, including changes due to changes in monetary policies, interest rates and the regulation of mortgage originators, services
and securitizers;
markets, including changes due to changes in monetary policies, interest rates and the regulation of mortgage originators, services
and securitizers;
Forward Looking Statements

3
Forward Looking Statements
· timely development and acceptance of new banking products and services and perceived overall value of these products and
services by users;
services by users;
· changes in consumer spending, borrowing and saving habits;
· technological changes;
· our ability to grow, increase market share and control expenses, and maintain sufficient liquidity;
· volatility in the credit and equity markets and its effect on the general economy;
· the potential for customer fraud, especially in our mortgage warehouse lending business;
· effects of changes in accounting policies and practices, as may be adopted by the regulatory agencies, as well as the Public
Company Accounting Oversight Board, the Financial Accounting Standards Board and other accounting standard setters;
Company Accounting Oversight Board, the Financial Accounting Standards Board and other accounting standard setters;
· the businesses of the Bank and any acquisition targets or merger partners and subsidiaries not integrating successfully or such
integration being more difficult, time-consuming or costly than expected;
integration being more difficult, time-consuming or costly than expected;
· our ability to integrate currently contemplated and future acquisition targets may be unsuccessful, or may be more
difficult, time-consuming or costly than expected; and
difficult, time-consuming or costly than expected; and
· material differences in the actual financial results of merger and acquisition activities compared with expectations.
These forward-looking statements are subject to significant uncertainties and contingencies, many of which are beyond our control.
Although we believe that the expectations reflected in the forward-looking statements are reasonable, we cannot guarantee future
results, levels of activity, financial condition, performance or achievements. Accordingly, there can be no assurance that actual results
will meet our expectations or will not be materially lower than the results contemplated in this presentation. You are cautioned not to
place undue reliance on these forward-looking statements, which speak only as of the date of this document or, in the case of
documents referred to or incorporated by reference, the dates of those documents. We do not undertake any obligation to release
publicly any revisions to these forward-looking statements to reflect events or circumstances after the date of this document or to reflect
the occurrence of unanticipated events, except as may be required under applicable law.
4
Investment Highlights
§ Profitable, well-capitalized $3.5 billion bank in attractive markets in New
England, New York, New Jersey, and Pennsylvania
England, New York, New Jersey, and Pennsylvania
§ Clean bank with Non-Covered NPAs of 0.77%
§ 10.0% - 12.0% ROE driven by prudent organic loan growth, increased revenue
and stable noninterest expense
and stable noninterest expense
§ Strong organic growth and acquisition opportunities in current markets
§ Management team with extensive community banking and M&A experience
§ Significant management and Board ownership
§ Recognized as #1 ranked bank by Bank Director Magazine in the 2013 Growth
Leader Rankings
Leader Rankings
§ NASDAQ listing

5
Timeline of Recent Events
§ $100 million of capital raised in early September 2012 has been deployed to profitably grow
loan portfolio
loan portfolio
§ Strong first quarter 2013 earnings results with core ROAA of 1.15%(1), core ROAE of
12.4%(1)
12.4%(1)
§ Hired a team of 6 bankers and plan on hiring 2 more in New York to run Private Banking
operations at 99 Park Avenue
operations at 99 Park Avenue
– Targeted to bring in ~$700 million in deposits and a sizable middle market lending book
within 24 months
within 24 months
§ Acquired a team of 15 bankers, a $157 million loan portfolio (and $200 million in loan
commitments), as well as a market presence in Boston and Providence from a deal with
Flagstar
commitments), as well as a market presence in Boston and Providence from a deal with
Flagstar
– Targeted to grow to ~$1.0 billion loan portfolio over 5 years
§ Opening office in low to moderate income neighborhood of Philadelphia
Source: SNL Financial and Company data.
(1) Core ROAA and ROAE excludes after tax impact of $2 million charge for warehouse fraud (tax rate of 35%). Including $2 million charge, reported ROAA of 0.98% and ROAE of 10.6%.

6
Key Profitability Targets
|
Criteria
|
Target
|
Mar 31,
2013 |
|
MRQ Peer
Median(3) |
|
Delta
|
|
Return on Assets
|
0.90% to 1.00%
|
1.15%(1)
|
|
1.07%
|
|
7.5% Higher
|
|
Return on Equity
|
10% or greater
|
12.4%(1)
|
|
10.3%
|
|
20.4%
Higher |
|
Net Interest
Margin |
3.00% to 3.25%
|
3.26%
|
|
3.55%
|
|
8.2%
Lower
|
|
Efficiency Ratio
|
50%
|
51%
|
|
62%
|
|
18.1%
Lower |
|
|
|
|
|
|
|
|
|
Current P/TBV(2)
|
1.10x
|
|
1.62x
|
|
47.3%
Upside |
|
Source: SNL Financial and Company data.
(1)Core ROAA and ROAE excludes after tax impact of $2 million charge for warehouse fraud (tax rate of 35%). Including $2 million charge, reported ROAA of 0.98% and ROAE of 10.6%.
(2)P/TBV as of 5/6/13.
(3)Peers consists of Northeast and Mid-Atlantic banks and thrifts with assets between $2.0 billion and $6.0 billion and most recent quarter core ROAA greater than 90bps. Excludes merger targets and MHCs. Please see
appendix for more information.
appendix for more information.

7
Customers Bancorp
Providence
Boston
CMS
New York
Philadelphia
Loan Production Offices
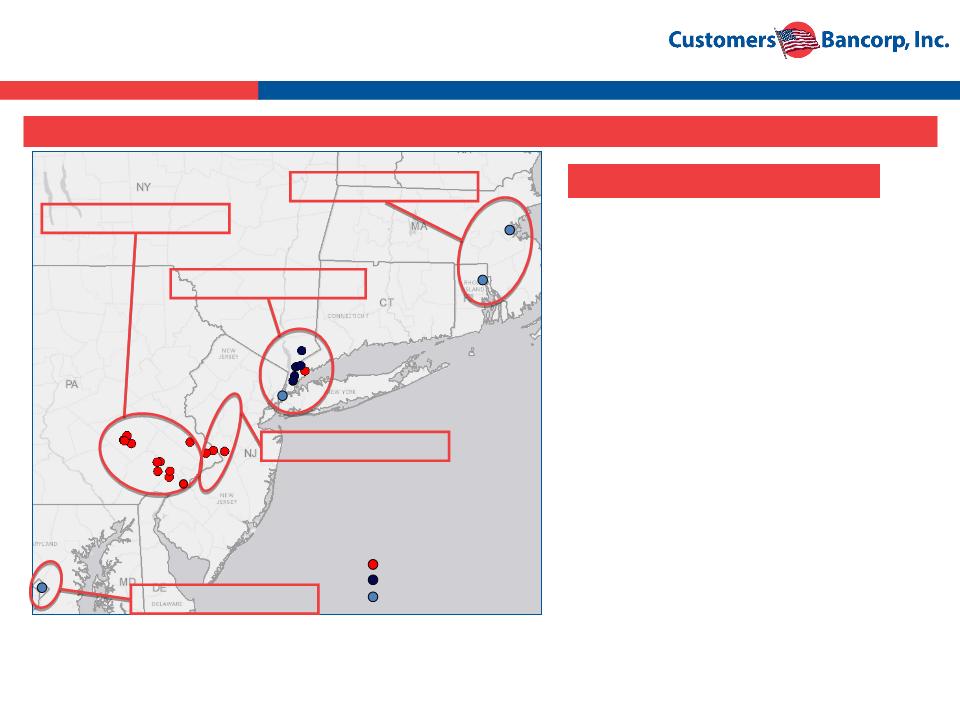
Current Company Overview
Source: SNL Financial and Company data. Note: Loan production office in Washington D.C. scheduled to open June 1, 2013. Branch in northeastern Philadelphia scheduled to open in Q3 2013.
*Source: SNL Financial as of 6/30/2012. Represents deposits pro forma for the acquisition of CMS Bancorp (expected to close in Q1 2014). Actual deposits transferred may be different.
§ $3.5 billion institution with 14 branches with a target market
from Boston to Washington D.C.
from Boston to Washington D.C.
– New York City area (Westchester County and Manhattan)
– Philadelphia area (Bucks, Berks, Chester, Delaware and
Philadelphia Counties in southeastern Pennsylvania and
Mercer county in New Jersey)
Philadelphia Counties in southeastern Pennsylvania and
Mercer county in New Jersey)
– Boston area (Operations in Boston and Providence)
– Pending CMS bank acquisition would add 6 branches in New
York MSA
York MSA
§ Unique “high-touch, high-tech” value proposition to
customer base
customer base
– Exceptional customer service supported by state-of-the-art
technology
technology
§ Operates a national mortgage warehouse business as well
as multifamily real estate lending in the New York City area
as multifamily real estate lending in the New York City area
Reading
Current Markets
Washington D.C.
Manhattan
8
Illustrative Five-Year Strategic Plan Envisions a
$8-$10bn Asset Bank in Target Markets
$8-$10bn Asset Bank in Target Markets
Source: SNL Financial and Company data. Note: Loan production office in Washington D.C. scheduled to open June 1, 2013. Branch in northeastern Philadelphia scheduled to open in Q3 2013.
5 Year Targets
~$1.0 billion in assets
~$3.0 billion in assets
Trenton
~$1.0 billion in assets
~$4.0 billion in assets
~$1.0 billion in assets
CMS
Customers Bancorp
Loan Production Offices
Providence
Reading
Washington D.C.
Philadelphia
|
Region
|
|
Target Asset Size
(in billions)
|
|
Pennsylvania
|
|
$4.0
|
|
New England
|
|
$0.5-$1.0
|
|
New York
|
|
$1.0-$2.0
|
|
Connecticut / White Plains
|
|
$1.0
|
|
New Jersey
|
|
$0.5-$1.0
|
|
Washington DC
|
|
$1.0
|
|
Total
|
|
~$8.0-$10.0
|
Boston

9
Seasoned Management Team
§ Experienced and cohesive management team with an average of 30 years experience
– 9 out of 15 senior executives previously worked at Sovereign
§ Significant management and Board ownership (~20% as of March 31, 2013)
*Indicates joined management team since last capital raise in September 2012

10
Source: Company documents.
Cash
Management
Residential
Real Estate
Credit
Cards
Commercial
Real Estate
Commercial
Banking
Private
Banking
Retail
Branches
Cash
Management
Residential
Real Estate
Credit
Cards
Commercial
Real Estate
Commercial
Banking
Private
Banking
Retail
Branches
Banking
Group
Group
Client
Makes
One Call
Makes
One Call
Client
Client
Makes
Many Calls
Makes
Many Calls
Call
Center
Center
Customers
“Only Client” Model
Other Banks
“Traditional Service”
Model
Model
Single Point of
Contact
Contact
Multiple Points of
Contact
Contact
Single Point of Contact - Our Advantage

11
Deposit Strategy - High Touch, High Tech
Concierge Banking
§ Takes banker to the
customer’s home or
office, 12 hours a day,
7 days a week
customer’s home or
office, 12 hours a day,
7 days a week
§ Appointment banking
approach
approach
§ Customer access to
private bankers
private bankers
§ “Virtual Branches” out
of sales offices
of sales offices
Sales Force
§ Experienced
bankers who own
a portfolio of
customers
bankers who own
a portfolio of
customers
§ Customer
acquisition &
retention strongly
incentivized
acquisition &
retention strongly
incentivized
Pricing
§ Low cost banking model
allows for more pricing
flexibility
allows for more pricing
flexibility
§ Significantly lower
overhead costs vs. a
traditional branch
overhead costs vs. a
traditional branch
§ Pricing/profitability
measured across
relationship
measured across
relationship
Technology
§ Implementation of
technology suite allows
for unique product
offerings:
technology suite allows
for unique product
offerings:
§ Remote account
opening & deposit
capture
opening & deposit
capture
§ Internet/mobile
banking
banking
§ Free ATM deployment
in U.S.
in U.S.
§ Deposit generation greatly driven by hiring teams of private bankers and providing
them with cutting edge technology and flexible pricing authority
them with cutting edge technology and flexible pricing authority
§ A business model designed to attract and retain top talent
Cost of Funds
Plus: Branch Operating Expense
Less: Fees
= All-in Cost < Competitors
Goal: All-in cost less than wholesale funding cost over the long-term

12
Delivering Organic Growth - Deposits
Source: Company data.
CAGR: 91%
CAGR: 65%
CAGR: 34%
Branch Deposit Growth
Average DDA Growth
Cost of Deposits
Deposits per Branch
CAGR: -22%

13
Lending Strategy - Local Lending Plus
Specialty Niche
Specialty Niche
Commercial Lending
Small Business
§ Target companies with less than
$5.0 million annual revenue
$5.0 million annual revenue
§ Loans (incl. SBA loans) originated
by branch network and specialist
small business relationship
managers
by branch network and specialist
small business relationship
managers
§ Top 10 in Delaware Valley for SBA
loans
loans
§ Warehouse Lending
§ Diversify earning assets and
revenue stream
revenue stream
§ Lower interest rate and credit risk
line of business
line of business
Business Banking
§ Target companies with up to $100
million annual revenues
million annual revenues
§ Very experienced teams
Multifamily & CRE
§ Focus Markets: New York &
Philadelphia MSAs
Philadelphia MSAs
§ Average Loan Size: $7.0 million
Real Estate Secured Lending
§ Select home equity and residential
mortgage
mortgage
§ Conservative underwriting
standards
standards
§ No indirect auto, unsecured loans
or credit cards
or credit cards
Consumer Lending
Specialty Lending
§ Mortgage Banking(1)
§ Diversified revenue source
(1) Business unit expected to begin generating revenues in Q3 2013.

14
Delivering Organic Growth - Loans
($ in millions)
Loans Held for Investment (excludes Warehouse Loans)
Source: Company documents.
(1)Consists of C&I and owner occupied CRE.
(2)Consists of non-owner occupied CRE.
§ Experienced C&I team acquired from local and regional banks; centralized credit
committee approval for all loans
committee approval for all loans

15
Significant Warehouse Lender
§ Exit by larger mortgage warehouse lenders has created opportunity to provide credit at attractive spreads
§ Warehouse segment led by professionals with over 25+ years experience in the sector
§ Generally low-risk lending business due to high quality collateral, historically quick turnover of originated loans
and no put-back risk to Customers
and no put-back risk to Customers
– Customers has no credit losses since inception in 2009
– Recent possible fraud loss due to suspected collusion between closing agent and mortgage banker; $2
million charge taken against fraud with potential for recovery through liens and court orders
million charge taken against fraud with potential for recovery through liens and court orders
– Additional checks and procedures added to further enhance risk management process
§ Strong growth over the past two years; currently have approximately 80-85 clients nationwide
– Deposit relationship and source of fee income
§ Warehouse lending currently comprises approximately 38% of average assets. Longer term goal (2-3 years)
for warehouse lending to comprise 25% or less
for warehouse lending to comprise 25% or less
Source: Company documents.
(1) Average outstanding for the respective quarter.

16
§ No charge-offs on loans originated since 2009
§ Less than 0.8% of NPAs from non-FDIC covered and acquired loans
§ Strong credit and risk management cultures
Minimal Credit Issues
Source: Company documents.
*Excludes accruing TDRs and loans 90 days+ past due and still accruing.
($ in millions)
Non-covered Nonperforming Assets
17
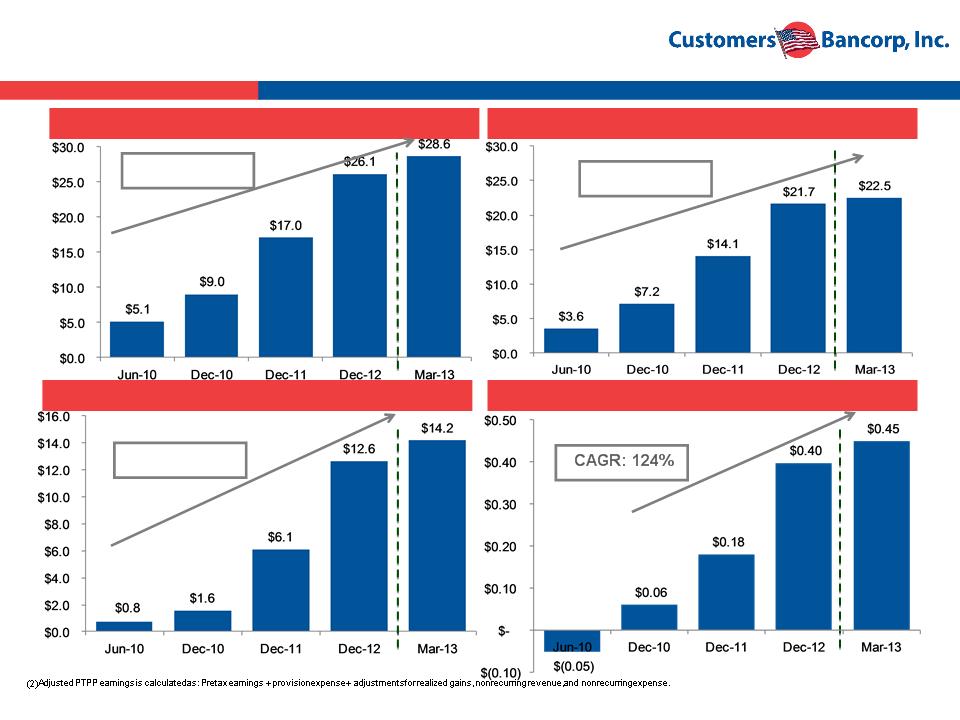
Disciplined and Profitable Growth
Revenue ($mm) (1)
Adjusted PTPP Earnings ($mm) (2)
Core EPS (3)
Source: SNL Financial and Company data.
(1)Revenue equals net interest income plus noninterest income.
(3)Core income, on a diluted per-share basis. Core income is net income before extraordinary items, less net income attributable to noncontrolling interest, the after-tax portion of income from investment (non-trading)
securities and nonrecurring items. The assumed tax rate was the effective tax rate for the respective quarter. CAGR calculated from Dec-10 to Mar-13.
securities and nonrecurring items. The assumed tax rate was the effective tax rate for the respective quarter. CAGR calculated from Dec-10 to Mar-13.
Net Interest Income ($mm)
CAGR: 87%
CAGR: 94%
CAGR: 190%
18
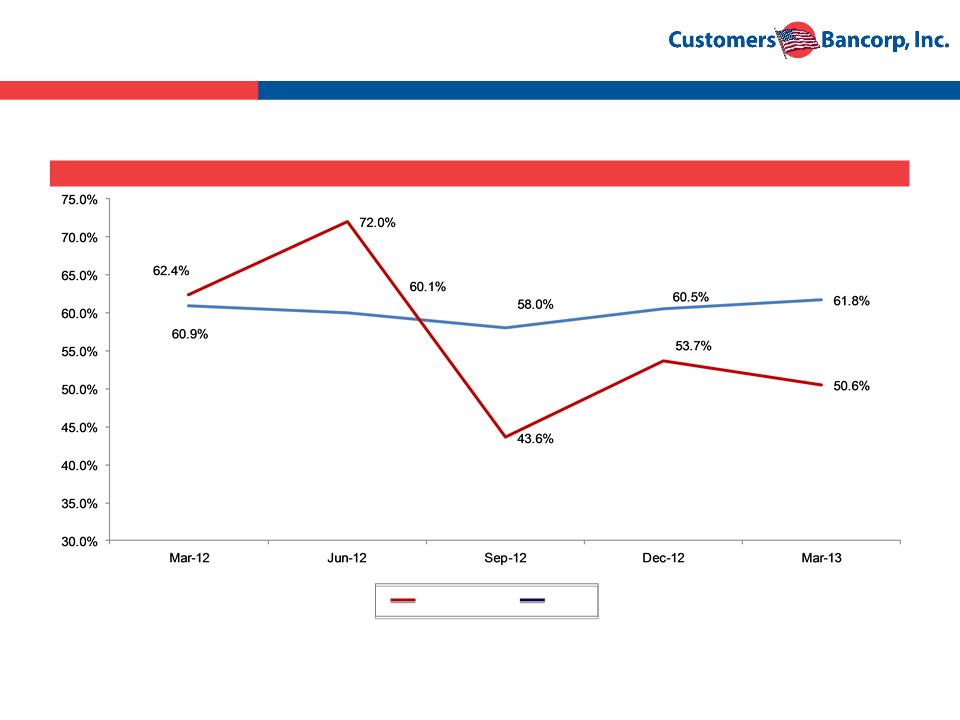
Efficient Cost Structure
Customers
Peers
Source: SNL Financial and Company data.
Peers consists of Northeast and Mid-Atlantic banks and thrifts with assets between $2.0 billion and $6.0 billion and most recent quarter core ROAA greater than 90bps. Excludes merger targets and MHCs. Please see
appendix for more information.
appendix for more information.
Efficiency ratio calculated as noninterest expense before foreclosed property expense, amortization of intangibles, and goodwill impairments as a percent of net interest income (fully taxable equivalent, if available) and
noninterest revenues, excluding only gains from securities transactions and nonrecurring items.
noninterest revenues, excluding only gains from securities transactions and nonrecurring items.
(1)Efficiency ratio excludes impact of $2 million charge for warehouse fraud. Including $2 million charge, efficiency ratio would be 57.5%.
§ 18% more efficient than peers leading to higher ROAE vs. peers
Efficiency Ratio: Customers Bancorp vs. Peers
(1)
19
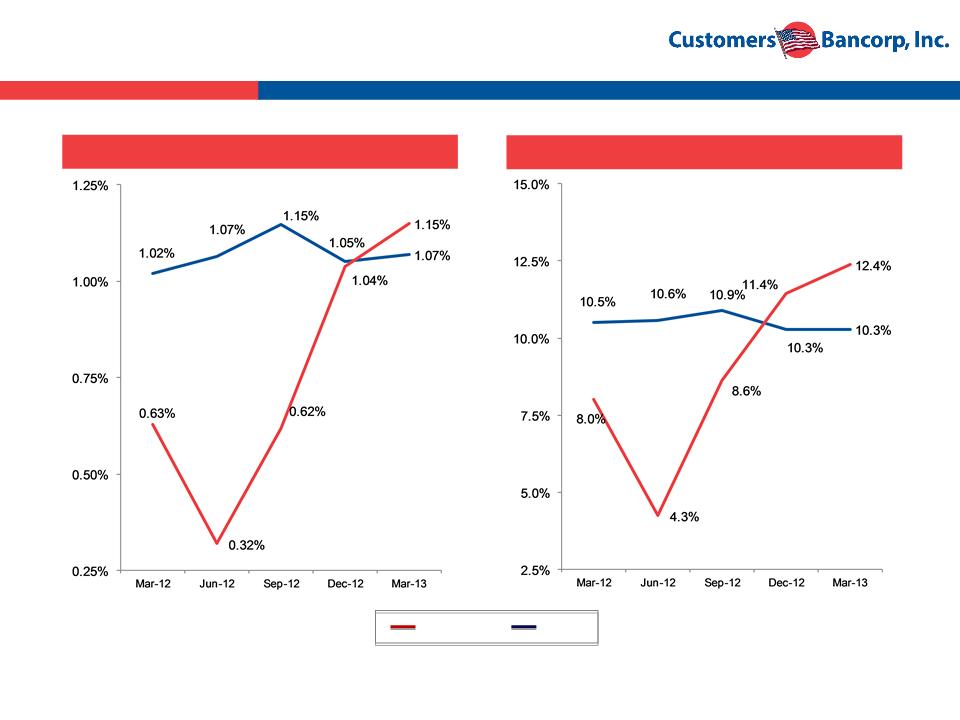
Superior Financial Returns
Source: SNL Financial and Company data.
Peers consists of Northeast and Mid-Atlantic banks and thrifts with assets between $2.0 billion and $6.0 billion and most recent quarter core ROAA greater than 90bps. Excludes merger targets and
MHCs. Please see appendix for more information.
(1)Core ROAA and ROAE excludes after tax impact of $2 million charge for warehouse fraud (tax rate of 35%). Including $2 million charge, reported ROAA of 0.98% and ROAE of 10.6%.
Core ROAE
Core ROAA
Customers
Peers
(1)
(1)
§ Operating leverage has created inflection point in profitability and returns
20
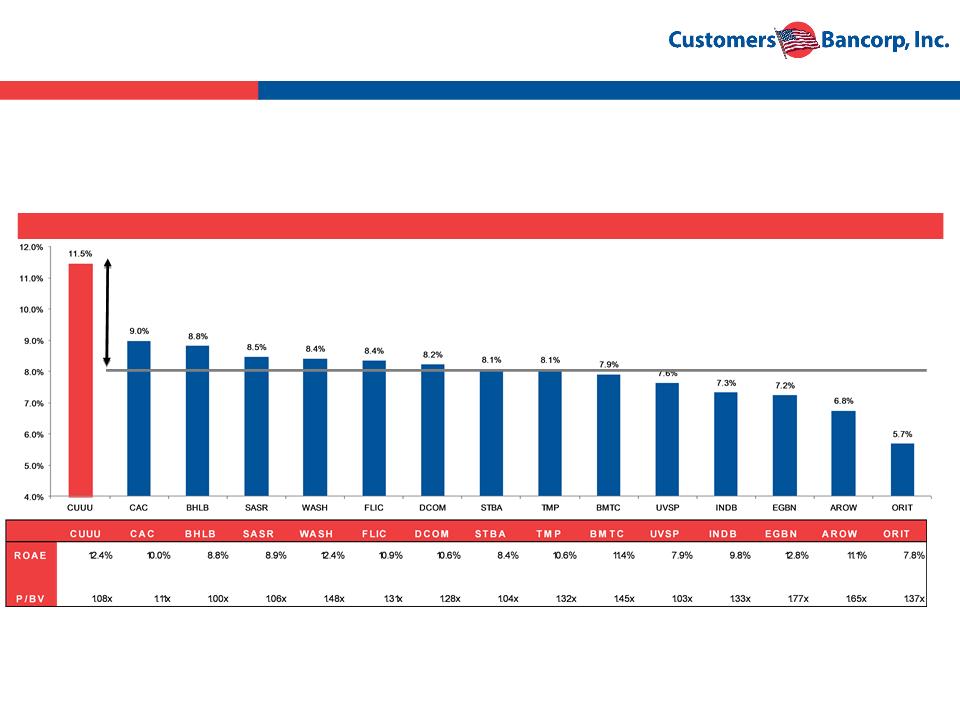
High Return on Investment
Source: SNL Financial and Company data. Market data as of 5/6/13. Peers consists of Northeast and Mid-Atlantic banks and thrifts with assets between $2.0 billion and $6.0 billion and most recent
quarter core ROAA greater than 90bps. Excludes merger targets and MHCs. Please see appendix for more information.
Customers Bancorp ROAE excludes after tax impact of $2 million charge for warehouse fraud (tax rate of 35%). Including $2 million charge, reported ROAE of 10.6%.
Return on Investment
Peer Median: 8.1%
§ Return on Investment for Customers Bancorp 42% higher than peer group
§ Return on Investment calculated as Return on Average Equity (MRQ) divided by Price/Book
Value
Value
42% Higher
21
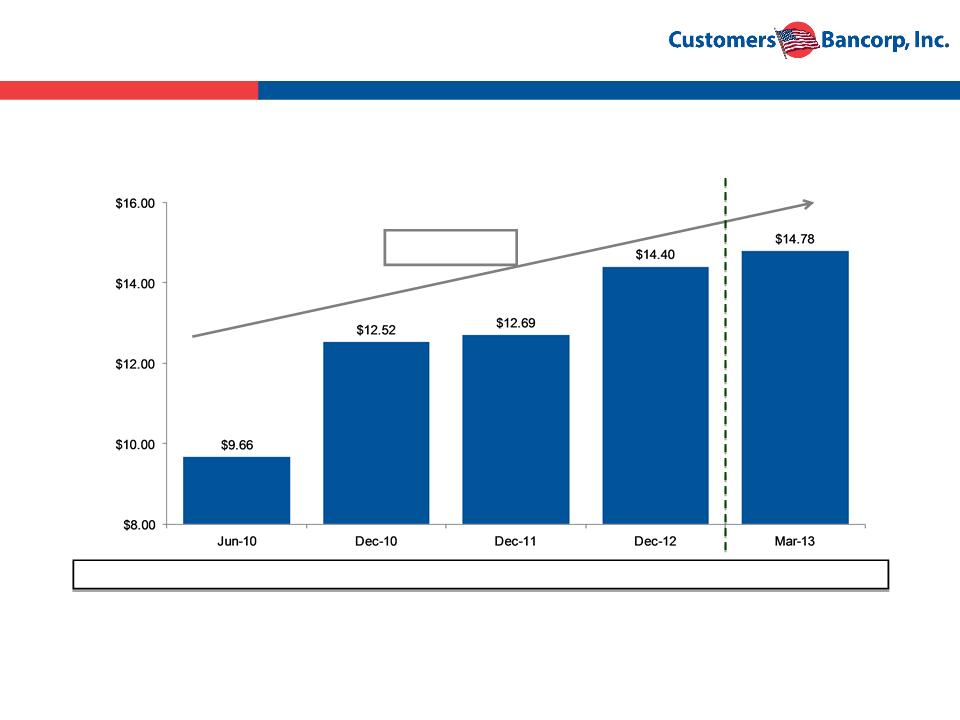
Enhancing Shareholder Value
§ Over 50% increase in tangible book value per share in the past 11 quarters(1)
BV/Share
$9.66
$12.52
$13.02
$14.60
$14.98
Source: SNL Financial, Company documents.
(1) December 2012 and March 2013 data includes effects of September 2012 common stock offering at $14.00 per share.
CAGR: 17%
22
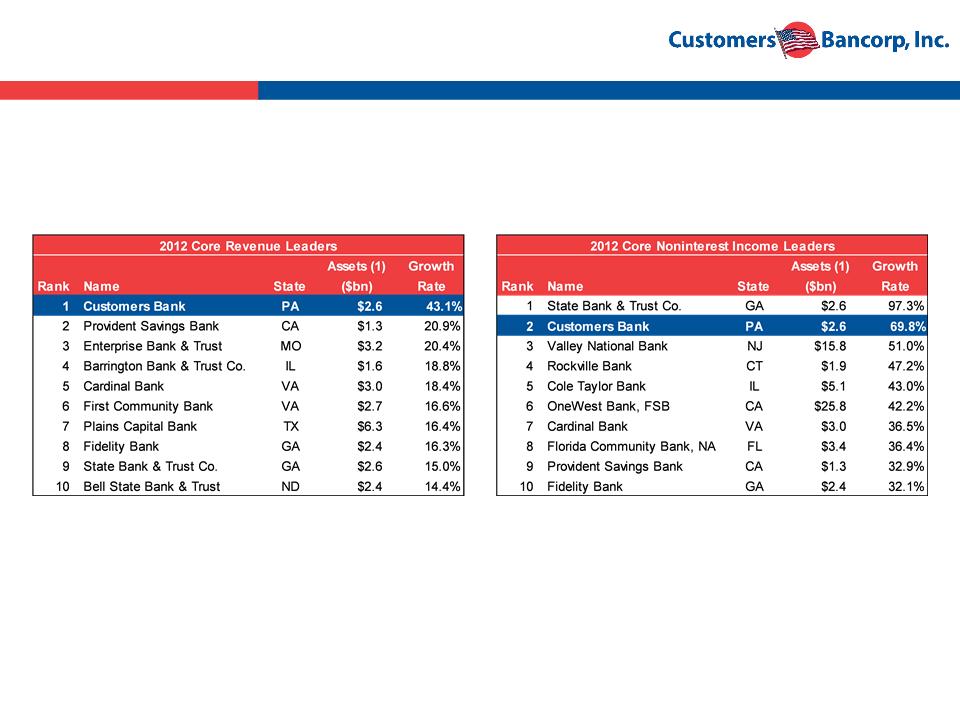
Bank Director Magazine 2013 Growth
Leader Rankings
Leader Rankings
Source: Bank Director Magazine, 2nd Quarter 2013 issue. (1) Assets as of 9/30/12.
§ Ranked #1 overall by Bank Director Magazine in the 2013 Growth Leader Rankings
§ Rankings independently conducted by Fiserv based on commercial banks, savings banks and
BHCs with assets greater than $1.0 billion
BHCs with assets greater than $1.0 billion

23
Investment Highlights
§ Profitable, well-capitalized $3.5 billion bank in attractive markets in New
England, New York, New Jersey, and Pennsylvania
England, New York, New Jersey, and Pennsylvania
§ Clean bank with Non-Covered NPAs of 0.77%
§ 10.0% - 12.0% ROE driven by prudent organic loan growth, increased revenue
and stable noninterest expense
and stable noninterest expense
§ Strong organic growth and acquisition opportunities in current markets
§ Management team with extensive community banking and M&A experience
§ Significant management and Board ownership
§ Recognized as #1 ranked bank by Bank Director Magazine in the 2013 Growth
Leader Rankings
Leader Rankings
§ NASDAQ listing

24
Appendix

25
Peer Group Comparison
High Performance Regional Peers
Source: SNL Financial, Company documents. Market data as of 5/6/13. Consists of Northeast and Mid-Atlantic banks and thrifts with assets between $2.0 billion and $6.0 billion and most recent quarter core ROAA greater than
90bps. Excludes merger targets and MHCs.
90bps. Excludes merger targets and MHCs.
Note: Customers Bancorp P/Estimated EPS ratios based on mid-point of publicly disclosed estimates by Customers Bancorp in the earnings call on 4/22/13.
(1)Customers Bancorp Core ROAA and ROAE excludes after tax impact of $2 million charge for warehouse fraud (tax rate of 35%). Including $2 million charge, reported ROAA of 0.98% and ROAE
of 10.6%.
of 10.6%.
(2)Customers Bancorp NPAs/Assets calculated as non-covered NPAs divided by total assets. Non-covered NPAs excludes accruing TDRs and loans 90+ days past due and still accruing.

26
GAAP Reconciliation
Source: Company documents.
(1) One-time adjustment for 1Q13 reflects $2.0 million loss due to warehouse mortgage fraud. One-time adjustment for 4Q11 reflects interest and loan commitment fee reversals due to timing differences and other
miscellaneous expenses due to timing differences.
miscellaneous expenses due to timing differences.

2013 Annual Shareholders Meeting
Effortless Banking