Attached files
| file | filename |
|---|---|
| 8-K - FORM 8-K - WABASH NATIONAL Corp | v346333_8k.htm |
WABASH NATIONAL CORPORATION Investor Update May 2013 Dick Giromini, President & CEO Mark Weber, SVP - CFO Jeff Taylor, VP Finance & IR
2 This presentation contains certain forward - looking statements, as defined by the Private Securities Litigation Reform Act of 1995. All statements other than historical facts are forward - looking statements, including without limit, those regarding shipment outlook, Operating EBITDA, backlog, demand level expectations, profitability and earnings capacity, margin opportunities, and potential benefits of any recent acquisitions. Any forward - looking statements are subject to certain risks and uncertainties that could cause actual results to differ materially from those implied by the forward - looking statements. Without limit, these risks and uncertainties include economic conditions, increased competition, dependence on new management, reliance on certain customers and corporate partnerships, shortages and costs of raw materials, manufacturing capacity and cost containment risks, dependence on industry trends, access to capital, acceptance of products, and government regulation. You should review and consider the various disclosures made by the Company in this presentation and in its reports to its stockholders and periodic reports on Forms 10 - K and 10 - Q. We cannot give assurance that the expectations reflected in our forward - looking statements will prove to be correct. Our actual results could differ materially from those anticipated in these forward - looking statements. All written and oral forward - looking statements attributable to us are expressly qualified in their entirety by the factors we disclose that could cause our actual results to differ materially from our expectations. S AFE H ARBOR S TATEMENT © 2013 Wabash National, L.P. All rights reserved. Wabash®, Wabash National®, DuraPlate ®, DuraPlate AeroSkirt ®, Walker, Brenner® and Beall® are marks owned by Wabash National, L.P. Transcraft ® and Benson® are marks owned by Transcraft Corporation.

3 Acquired assets of leading liquid tank and dry bulk trailer producer C OMPANY B ACKGROUND Acquired assets of leading aluminum flatbed producer Founded as a start - up IPO ( NYSE : WNC ) Achieved leading industry position Introduced the DuraPlate ® composite dry van trailer Record trailer production of 70,000 units Acquired leading liquid transport equipment producer Acquired leading steel flatbed producer Acquired assets of Acquired Cloud Oak Flooring Co. • 2012 Revenue: $1.5B • 4,400 Associates • 10 Manufacturing Locations in 3 Countries • 18 Company - Owned Retail Locations Launched DuraPlate Products Group business (Wabash Composites) 1985 1991 1994 1996 1997 1999 2006 2008 2009 2011 2012 2013

4 W ABASH S EGMENTS Wabash National Corporation Commercial Trailer Products 2012 Sales: $994M • Dry & Refrigerated Vans • Platform Trailers • Fleet Used Trailers Retail 2012 Sales: $157M • 18 Retail L ocations in U.S. • New & Used Trailer Sales • Parts & Service Tank Services Diversified Products 2012 Sales: $311M • Walker Group • Wabash Composites • Wabash Wood Products
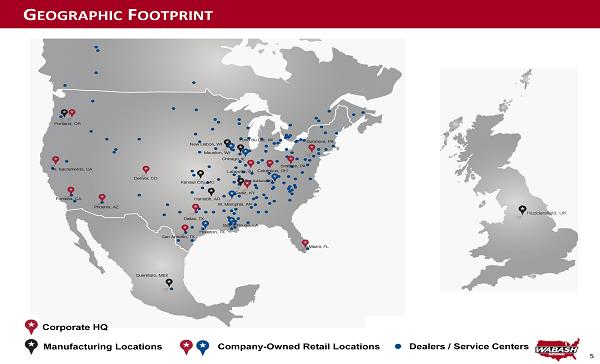
5 G EOGRAPHIC F OOTPRINT Corporate HQ Manufacturing Locations Company - Owned Retail Locations Dealers / Service Centers

6 CTP Operating Income Up Nearly $50 Million Since 2010 Key Statistics Recent Financial Performance - CTP Examples of Key Customers ▪ Comprehensive trailer products portfolio ▪ 2012 New Trailer Shipments: 43,600 ▪ Core products: dry vans, refrigerated vans, platform trailers ▪ Brands: Wabash National, Transcraft, Benson C OMMERCIAL T RAILER P RODUCTS : S EGMENT P ROFILE -20 0 20 40 60 80 100 0 200 400 600 800 1000 1200 2010 2011 2012 Operating Income (M$) Revenue (M$) Revenue Op. Income Segment Revenue and Units are prior to the elimination of intersegment sales.

7 C OMMERCIAL T RAILER P RODUCTS Dry Freight Vans: 82% / Total Refrigerated Vans: 11% / Total Platform Trailers: 5% / Total Specialty Equipment: 2% / Total Note: Percentages based on WNC shipments 2010 - 2012

8 I NDUSTRY F ORECASTS ▪ Divergence between industry forecasters has narrowed ▪ Strong demand above replacement levels forecast for next 5 years in all CTP segments ▪ CSA & CARB continue to drive demand Strong D emand Forecasted for the Next Five Years General Market Overview ACT Forecast by Segment 2012 2013 2014 2015 2016 2017 Dry Van 129,543 138,800 147,000 143,000 128,000 140,000 Refrigerated 34,094 37,000 36,500 34,000 33,000 36,000 Platform 24,525 24,200 25,500 25,500 22,500 21,700 Liquid Tanks 8,212 8,400 7,800 7,200 6,200 6,300 Other 40,467 39,300 41,600 39,900 38,200 39,400 Total 236,841 247,700 258,400 249,600 227,900 243,400

9 2013 O UTLOOK : I NDUSTRY F ORECAST Strong demand above replacement levels Short - /Mid - Term Demand Drivers Source: ACT Sources: 1974 - 1989:SMCC/TBB; 1989 - 2012: ACT ▪ HOS Rules (Hours of Service) ▪ 7 - day maximum driving time reduced from 82 to 70 hours ▪ Some customers expect a “5 % - 12%” impact on productivity ▪ Not currently factored into current industry forecast models ▪ Underlying Forces ▪ Age of equipment reached an all - time high in 2010 - 2011 of near ly 8.3 years ▪ Fleet population decreased by over 10% since 2008 ▪ 3+ years of significant under - buy (2008 - 2010) 0 50,000 100,000 150,000 200,000 250,000 300,000 350,000 1975 1980 1985 1990 1995 2000 2005 2010 Historical Industry Production Early Innings of the Replacement Cycle

10 C OMMERCIAL T RAILER P RODUCTS Source: ATA Freight Transportation Forecast to 2023 Overall Growth Trends • Total tonnage will increase an estimated 13.7B tons in 2011 to 16.6B tons in 2023 • Estimated Freight Increase ’12 - ’17 ’18 - ’23 General freight 3.6% 1.2% Bulk freight 2.6% 0.9% Trucking Trends • Truck share of total tonnage forecasted to exceed pre - recession level of ~69%. • Estimated Freight Increase ’12 - ’17 ’18 - ’23 Truckload (TL) 3.3% 1.1% Less - than - truckload (LTL) 3.5% 2.3% 67.0% 14.4% 1.3% 6.6% 6.6% 0.1% 2011 Truck Rail Carload Rail Intermodal Air Water Pipeline 69.6% 13.1% 1.9% 6.1% 6.1% 0.1% 2023 Truck Rail Carload Rail Intermodal Air Water Pipeline Trucking boosts share of total tonnage to 70% by 2022
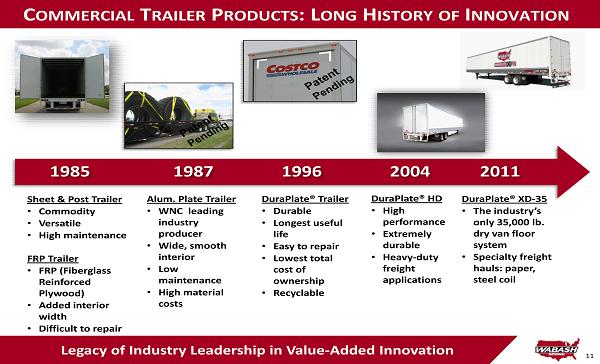
11 C OMMERCIAL T RAILER P RODUCTS : L ONG H ISTORY OF I NNOVATION Legacy of Industry Leadership in Value - Added Innovation Sheet & Post Trailer • Commodity • Versatile • High maintenance FRP Trailer • FRP (Fiberglass Reinforced Plywood) • Added interior width • Difficult to repair 1985 Alum. Plate Trailer • WNC leading industry producer • Wide, smooth interior • Low maintenance • High material costs 1987 DuraPlate® Trailer • Durable • Longest useful life • Easy to repair • Lowest total cost of ownership • Recyclable 1996 DuraPlate® HD • High performance • Extremely durable • Heavy - duty freight applications 2004 DuraPlate® XD - 35 • The industry’s only 35,000 lb. dry van floor system • Specialty freight hauls: paper, steel coil 2011 Sheet & Post Trailer • Commodity • Versatile • High maintenance FRP Trailer • FRP (Fiberglass Reinforced Plywood) • Added interior width • Difficult to repair

12 C OMMERCIAL T RAILER P RODUCTS : C USTOMERS Wabash National Customers • 50% of Top 50 For - Hire Fleets • 40% of Top 100 For - Hire Fleets Preferred by the industry’s leading carriers Source: 2011 Transport Topics 100

13 C OMMERCIAL T RAILER P RODUCTS H IGHLIGHTS x Industry leader in van and platform trailer manufacturing x Best - in - class, technologically innovative products x Leading brands and long - standing customer relationships x Trucking recovery and aging fleet equipment fuels trailer demand x Mature practitioner of lean manufacturing methodology x Knowledgeable, experienced management and leadership team New Markets. New Innovation. New Growth.

14 Broad Product Portfolio Serving Diverse Markets Key Statistics Recent Financial Performance Key Brands ▪ Wabash Composites, Wabash Wood Products, and Walker Group ▪ Diverse portfolio of products and services ▪ Broad customer, geographic, and end market diversification ▪ Higher growth and higher margin businesses D IVERSIFIED P RODUCTS P ROFILE -20 0 20 40 60 80 100 0 100 200 300 400 2010 2011 2012 Operating Income (M$) Revenue (M$) Revenue Op. Income Segment Revenue is prior to the elimination of intersegment sales.

15 Focused on Diversified, Higher M argin G rowth. Key Statistics Diversified Products Proforma Revenue Key Customers ▪ #1 Manufacturer of Liquid T ank Trailers (3,000+ trailers shipped in 2012), A irplane R efuelers & Engineered P roducts ▪ High Gross Margin (>20%) and Stable, Solid Cash Generation ▪ Key Brands: Walker, Brenner, Bulk, Beall, Garsite , Extract, TST ▪ Strong Growth Potential from Innovation W ALKER G ROUP P ROFILE Wabash Composites, 13% Wabash Wood Products, 7% Walker, 80%

16 W ALKER G ROUP : I NDUSTRY L EADERSHIP Position Products Est. Share Brands # 1 ALL liquid - transportation systems in North America 33% # 1 Stainless - steel liquid - transportation systems in North America 63% # 1 Stainless - steel liquid - tank trailers for the North American chemical market 64 % # 1 Stainless - steel liquid - tank trailers for the North American food market 75% # 1 Liquid - tank trailers for the worldwide aircraft refuelers market 35% # 1 Isolators globally 30% # 1 Downflow booths globally 35% # 2 Stationary silos in the U.S. 35% Transportation Products Leader Engineered Products Leader 80% of Total Revenues 20% of Total Revenues Sources: TTMA, ACT, Polk, Trailer Body Builders 2012

17 W ALKER G ROUP : D IVERSIFICATION End - Markets Geographies Products and Services Blue - Chip Customer Base Oil, Gas & Energy Services Dairy, Food and Beverage Chemical Pharmaceuticals Aviation Defense Environmental Note: 1. All information based off of 2011 revenues US, 87% Australia, 0% Asia, 5% Africa, 0% Latin America, 2% Mexico & Canada, 2% Europe, 3% Parts and Services Revenue, 13% Manufacturing Revenue, 87% Chemical, 31% Dairy, Food & Beverage, 27% Aviation, 15% Energy, 12% Pharmaceutical, 9% Defense, 4% Environmental, 2%

18 W ALKER G ROUP : N EW I NNOVATION – T RANSPORTATION P RODUCTS • Expanding the use of Lean Duplex tank trailers to include the most common corrosives, such as sulphuric acid. Industry Leader in Innovation / New Product Development Lean Duplex » First to Market with DOT Approved Lean Duplex » Improved Yield Strength and Reduced Trailer Weight » Alternative Material to Minimize Exposure to Volatile Nickel Prices Brenner Lean Duplex Tank Trailer

19 Beall Acquisition Creates Broadest Tank Trailer Portfolio W ALKER G ROUP : G ROWTH - M&A B EALL Beall Aluminum Petroleum Tank Trailer (406) Beall Aluminum Dry Bulk Trailer (Pneumatic) Trailer Type Non - Code Code 406 Code 407 Code 407 Special Permit Food Grade Sanitary Code 412 High Pressure 338/331 Dry Bulk Material Carbon Steel Aluminum Aluminum Stainless Steel FRP Stainless Steel Various Carbon Steel Aluminum Use Non - Hazardous (Water) Petroleum Chemicals Crude Oil Chemicals Crude Oil Corrosive Materials Food Products (i.e. Milk) Corrosive Materials Gases Cryogenic Flours, Plastics, Sands, Cement Avg. Industry Volume Offering

20 Focused on Diversified, Higher M argin Growth. Key Statistics Diversified Products Proforma Revenue Key Customers - Examples ▪ Growing Product P ortfolio ▪ Key Products : composite panels, aerodynamic trailer skirts, portable storage containers, truck bodies walls ▪ Brands : DuraPlate, AeroSkirt, Wabash National W ABASH C OMPOSITES P ROFILE Wabash Composites, 13% Wabash Wood Products, 7% Walker, 80%
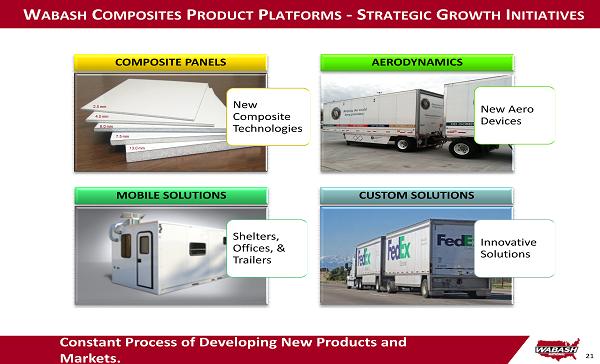
21 W ABASH C OMPOSITES P RODUCT P LATFORMS - S TRATEGIC G ROWTH I NITIATIVES Constant Process of Developing New Products and Markets. New Composite Technologies COMPOSITE PANELS New Aero Devices AERODYNAMICS Shelters, Offices, & Trailers MOBILE SOLUTIONS Innovative Solutions CUSTOM SOLUTIONS

22 W ABASH C OMPOSITES - I NDUSTRY D YNAMICS Demand Drivers • Forecasted growth in Truck Body market drives DuraPlate® panel sales growth. • Housing Starts support potential moving and storage growth and need for portable storage containers. • CARB (California Air Resource Board) compliance requirements continue to drive DuraPlate® AeroSkirt® demand. 0% 20% 40% 60% 80% 100% 2011 2012 2013 2014 2015 2016 CARB Large Fleet Trailer Compliance Schedule* Option 1 Option 2 Source: California Air Resource Board * CARB expects 1.5 million trailers to be affected by its Tractor Trailer Greenhouse Gas regulation .

23 x Industry leader in tank trailer and engineered products with the broadest portfolio x Leader in composite panel technology, solutions - driven product development strategy x Diversified platform serving a variety of attractive end markets x Low capital model leveraging existing intellect x Leading brands and longstanding relationships with blue - chip customer base x Best - in - class , technologically innovative products x Stable, strong cash flow profile. Synergistic opportunities. Low cost manufacturing. x Knowledgeable, experienced management and leadership team D IVERSIFIED P RODUCTS H IGHLIGHTS New Markets. New Innovation. New Growth.
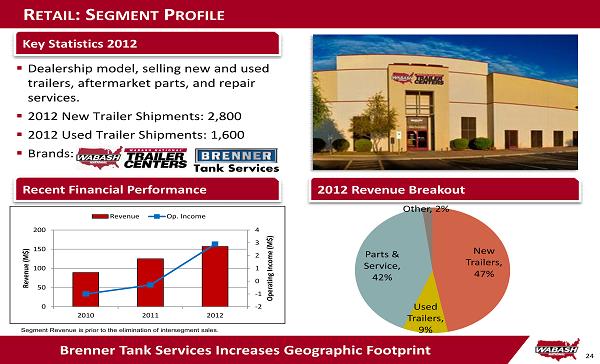
24 Brenner Tank Services Increases Geographic Footprint Key Statistics 2012 Recent Financial Performance 2012 Revenue Breakout R ETAIL : S EGMENT P ROFILE -2 -1 0 1 2 3 4 0 50 100 150 200 2010 2011 2012 Operating Income (M$) Revenue (M$) Revenue Op. Income ▪ Dealership model, selling new and used trailers, aftermarket parts, and repair services. ▪ 2012 New Trailer Shipments: 2,800 ▪ 2012 Used Trailer Shipments: 1,600 ▪ Brands: Tank Services New Trailers, 47% Used Trailers, 9% Parts & Service, 42% Other, 2% Segment Revenue is prior to the elimination of intersegment sales.
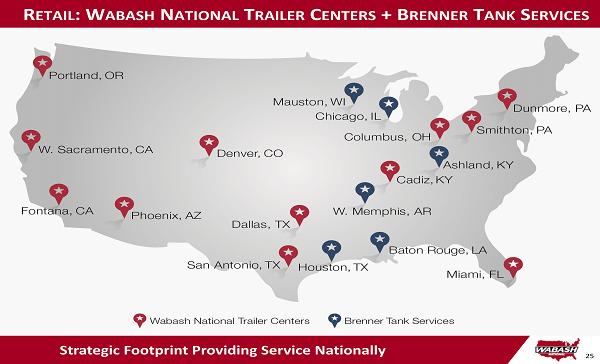
25 R ETAIL : W ABASH N ATIONAL T RAILER C ENTERS + B RENNER T ANK S ERVICES Strategic Footprint Providing Service Nationally

26 R ETAIL : N EW M ARKETS – T ANK P ARTS & S ERVICE Capture Synergy of Brenner Tank Service Expertise Key Drivers ▪ Leverage Combined Footprint to Capture Higher - Margin Tank Parts & Service ▪ Low CapEx Investment Required for Wabash National Trailer Centers ▪ Support Walker Brand Products Nationally, Including Recently Added Beall Location Status ▪ 3 Wabash National Trailer Centers Currently Tank Repair Certified: » Scranton , PA » Dallas, TX » San Antonio, TX ▪ Two a dditional Locations to be Certified in 2013 – All Locations selling Tank Parts

27 x Strategic footprint providing national support x Platform which supports the broadest product range in the industry x Integrated with OEM to deliver best practices and innovation in the aftermarket x Value added reseller of new and used trailers & parts and service x Expansion into new markets with mobile service and 3 rd party maintenance x Aging fleet equipment and tougher regulatory environment is expected to continue to drive parts and service demand x Low CapEx and synergistic expansion in higher - margin tank parts and service x Knowledgeable, experienced management and leadership team R ETAIL S EGMENT H IGHLIGHTS New Markets. New Innovation. New Growth. Tank Services

WABASH NATIONAL CORPORATION Financial Overview May 2013

29 338 640 1,187 1,462 324 200 500 800 1,100 1,400 1,700 2009 2010 2011 2012 Q1 2013 ($ millions) ($ millions) 27 5 119 39 (43) (60) (30) 0 30 60 90 120 150 2009 2010 2011 2012 Q1 2013 Notes: 1. See Appendix for reconciliation of non - GAAP financial information F INANCIAL P ROFILE Revenues 2012 Revenue & Operating EBITDA Set Record Levels Operating EBITDA ▪ Structural Improvements Undertaken During Downturn: Facility and Headcount Rationalization ▪ Economic Recovery: Above Replacement Level Demand ▪ Organic Growth & Innovation: Wabash Composites ▪ Strategic M&A: Tank Trailer Acquisitions of the Walker Group and Beall

30 Expand Commercial Trailer Products Margins Grow Diversified Products Top Line ▪ Diversified Products Segment is Gaining Critical Mass ▪ Commercial Trailer Products & Diversified Products Are Nearly Equal Contributors to Company Performance ▪ Retail Segment Provides Support to Both Segments & Captures Additional Channel Value 47% 3% 50% D IVERSIFICATION E FFORTS G AINING T RACTION …N EW M ARKETS 86% 14% 68% 11% 21% Manufacturing Retail Commercial Trailer Products Diversified Products Retail Manufacturing Retail 100% Diversified Products Commercial Trailer Products 2007 Revenue $1.1B 2012 Revenue $1.5B 2007 Op. Inc. $26.5M 2012 Op. Inc. $70.5M

31 Capital Structure and Liquidity Cost Effective Debt Structure • $150 Million ABL Revolving Facility – Sr. Secured, matures 5/2017, floating LIBOR pricing 1.75% - 2.25% • $150 Million Convertible Notes – Sr. Unsecured, matures 5/2018, semiannual interest payment of 3.375% • $300 Million Term Loan B – Sr. Secured, matures 5/2019, 1% annual amortization, all - in floating pricing ~ 4.50% Strong Balance Sheet & Free Cash Flow Yield • Cash Balance of $59M at 3/31/13 • Total liquidity of $200M at 3/31/13 • $142M available under revolver • 5/09/13 Term Loan re - pricing and $20M pay down reduces annualized cash interest cost by over $5M • Net working capital of ~12% of revenue • Minimal debt repayment requirements • Modest CapEx ; ~$20 million for 2013 • Appx. $111M of Income Tax NOLs at 12/31/12 $0 $25 $50 $75 $100 $125 $150 $175 $200 $225 $250 12/09 12/10 12/11 3/12 6/12 9/12 12/12 3/13 $21.0 $60.4 $125.7 $99.6 $151.2 $182.2 $224.3 $200.1 ($ millions) Liquidity (1) (1) Liquidity, defined as cash on hand plus available borrowing capacity 0 50 100 150 200 250 300 2013 2014 2015 2016 2017 2018 2019 ($ millions) Required Minimum Maturities (1)(2) Debt & Capital Lease Maturities $5 $5 $4 $4 $4 $154 $153 $259 (1) Excess cash flows, as defined in the TLB, may require additional mandatory pre - payment requirements; above maturities reflects only minimum obligations at 1% of principal (or ~$3M/year) (2) Schedule represents estimate of debt and capital lease maturities as of December 31, 2012 inclusive of new financing facilities and $20M pay down on May 9, 2013 Term Loan Senior Notes Revolver Strong Liquidity & Flexible Capital Structure

32 Strong Operational Platforms Positioned for Future Growth Wabash National Corporation Diversified Products Retail Commercial Trailer Products • Customer focused total cost of ownership through best in class product offerings • Lean manufacturing focus and productivity improvements • Enhanced product and channel mix management • Industry leading product innovations P ROFITABILITY D RIVERS • New product development leveraging intellectual capabilities • Capturing synergies of acquired businesses • Expansion of customer base and distribution channels • Strategic M&A growth opportunities • Leverage expanded footprint to cross sell and capture higher margin opportunities • Expansion of mobile service capabilities • Increased management of 3 rd party fleet maintenance • Growth of national service contracts

33 L ONG - T ERM S TRATEGIC O BJECTIVES Expectations 2011 2012 Long - term Revenue $1.2B $1.5B >$ 2.0B Diversified Products Revenue (1) $107M $356M > $600M Gross Margins 5.6% 11.0% > 13% EBITDA Margins 3.3% 8.1% > 10% Net Leverage 1.3x 3.1x < 2.0x Notes: (1) Diversified Products segment revenues prior to eliminations Growth and Diversification Strategy Intact

34 New Markets. New Innovation. New Growth. I NVESTMENT H IGHLIGHTS x Diversified manufacturer and industry leader in van and tank trailer production x Leading brands and longstanding relationships with blue - chip customer base x Best - in - class, technologically innovative products x Trucking recovery and aging fleet equipment fuels trailer demand x Mature practitioner of lean manufacturing x Knowledgeable, experienced management and leadership team

WABASH NATIONAL CORPORATION Appendix

36 C ONSOLIDATED I NCOME S TATEMENT ($ in thousands, except per share amounts) 2009 2010 2011 2012 Q1 2013 Net sales 337,840$ 640,372$ 1,187,244$ 1,461,854$ 324,229$ Cost of sales 360,750 612,289 1,120,524 1,298,031 282,043 Gross profit (22,910)$ 28,083$ 66,720$ 163,823$ 42,186$ % of sales -6.8% 4.4% 5.6% 11.2% 13.0% General and administrative expenses 29,033 29,876 30,994 44,751 13,675 % of sales 8.6% 4.7% 2.6% 3.1% 4.2% Selling expenses 11,176 10,669 12,981 23,589 7,667 % of sales 3.3% 1.7% 1.1% 1.6% 2.4% Amortization of intangibles 2,955 2,955 2,955 10,590 5,370 % of sales 0.9% 0.5% 0.2% 0.7% 1.7% Acquisition expenses - - - 14,409 618 % of sales 0.0% 0.0% 0.0% 1.0% 0.2% - - - - - (Loss) Income from operations (66,074)$ (15,417)$ 19,790$ 70,484$ 14,856$ % of sales -19.6% -2.4% 1.7% 4.8% 4.6% Other income (expense) Increase in fair value of warrant (33,447) (121,587) - - - Interest expense (4,379) (4,140) (4,136) (21,724) (7,535) Other, net (866) (667) (441) (97) 2,238 (Loss) Income before income taxes (104,766)$ (141,811)$ 15,213$ 48,663$ 9,559$ Income tax (benefit) expense (3,001) (51) 171 (56,968) 3,824 Net (loss) income (101,765)$ (141,760)$ 15,042$ 105,631$ 5,735$ Preferred stock dividends and early extinguishment 3,320$ 25,454$ -$ -$ -$ Net (loss) income applicable to common stockholders (105,085)$ (167,214)$ 15,042$ 105,631$ 5,735$ Diluted net (loss) income per share (3.48)$ (3.36)$ 0.22$ 1.53$ 0.08$ New Markets. New Innovation. New Growth.

37 C ONSOLIDATED B ALANCE S HEET ($ in thousands) 2009 2010 2011 2012 Q1 2013 ASSETS Current assets Cash 1,108$ 21,200$ 19,976$ 81,449$ 58,633$ Accounts receivable 17,081 37,853 52,219 96,590 101,260 Inventories 51,801 110,850 189,533 189,487 237,013 Deferred income taxes - - - 42,330 40,755 Prepaid expenses and other 6,877 2,155 2,317 8,239 5,904 Total current assets 76,867$ 172,058$ 264,045$ 418,095$ 443,565$ Property, plant and equipment 108,802 98,834 96,591 132,146 137,858 Deferred income taxes - - - 21,894 19,681 Goodwill - - - 146,444 148,157 Intangible assets 25,952 22,863 19,821 171,990 175,474 Other assets 12,156 9,079 7,593 12,057 10,540 Total assets 223,777$ 302,834$ 388,050$ 902,626$ 935,275$ LIABILITIES & STOCKHOLDERS' EQUITY Current liabilities Current portion of long-term debt -$ -$ -$ 3,381$ 23,460$ Current portion of capital lease obligations 337 590 4,007 1,140 1,532 Accounts payable 30,201 71,145 107,985 87,299 126,233 Other accrued liabilities 34,583 38,896 59,024 104,873 86,622 Warrant 46,673 - - - - Total current liabilities 111,794$ 110,631$ 171,016$ 196,693$ 237,847$ Long-term debt 28,437 55,000 65,000 416,849 397,108 Capital lease obligations 4,469 3,964 814 3,781 7,388 Other noncurrent liabilities 3,258 4,214 4,874 15,511 16,306 Deferrred income taxes - - - 1,065 1,066 Preferred stock 22,334 - - - - Stockholders' equity 53,485 129,025 146,346 268,727 275,560 Total Liabilities and stockholders' equity 223,777$ 302,834$ 388,050$ 902,626$ 935,275$ New Markets. New Innovation. New Growth.

38 C ONSOLIDATED C ASH F LOWS ($ in thousands) 2009 2010 2011 2012 Q1 2013 Cash flows from operating activities Net (loss) income (101,765)$ (141,760)$ 15,042$ 105,631$ 5,735$ Adjustments to reconcile net (loss) income to net cash (used in) provided by operating activities Depreciation 16,630 13,900 12,636 14,975 4,406 Amortization of intangibles 2,955 2,955 2,955 10,590 5,370 Net (gain) loss on the sale of assets (55) 431 (9) 203 - Loss on debt extinguishment 303 - 668 - - Deferred income taxes - - - (55,292) 3,790 Increase in fair value of warrant 33,447 121,587 - - - Stock-based compensation 3,382 3,489 3,398 5,149 1,884 Accretion of debt discount - - - 2,972 1,126 Changes in operating assets and liabilities Accounts receivable 20,845 (20,772) (14,366) 1,180 (4,593) Inventories 41,095 (59,062) (78,683) 41,696 (46,580) Prepaid expenses and other (1,570) 3,024 (162) 736 (83) Accounts payable and accrued liabilities (22,666) 45,251 56,968 (48,777) 19,563 Other, net 420 650 386 (3,046) 1,716 Net cash (used in) provided by operating activities (6,979)$ (30,307)$ (1,167)$ 76,017$ (7,666)$ Cash flows from investing activities Capital expenditures (981) (1,782) (7,264) (14,916) (2,564) Acquisition, net of cash acquired - - - (364,012) (13,860) Proceeds from the sale of property, plant and equipment 300 1,813 17 607 - Other - - - (2,500) 2,418 Net cash (used in) provided by investing activities (681)$ 31$ (7,247)$ (380,821)$ (14,006)$ Cash flows from financing activities Proceeds from issuance of common stock, net of expenses - 71,948 (155) - - Proceeds from exercise of stock options - 504 538 354 161 Borrowings under revolving credit facilities 276,853 712,491 848,705 206,015 223 Payments under revolving credit facilities (328,424) (685,928) (838,705) (271,015) (223) Principal payments under capital lease obligations (334) (352) (671) (1,629) (441) Principal payments under term loan credit facility - - - (2,250) (750) Principal payments under industrial revenue bond - - - - (38) Stock repurchase (35) (384) (533) (564) (35) Proceeds from issuance of convertible senior notes - - - 145,500 - Proceeds from issuance of term loan credit facility, net of issuance costs - - - 292,500 - Proceeds from issuance of preferred stock and warrant 35,000 - - - - Payments under redemption of preferred stock - (47,791) - - - (1,420) - (1,989) (5,134) (41) - - - 2,500 - (2,638) (120) - - - Net cash (used in) provided by financing activities (20,998)$ 50,368$ 7,190$ 366,277$ (1,144)$ Net (decrease) increase in cash and cash equivalents (28,658)$ 20,092$ (1,224)$ 61,473$ (22,816)$ Cash and cash equivalents at beginning of period 29,766 1,108 21,200 19,976 81,449 Cash and cash equivalents at end of period 1,108$ 21,200$ 19,976$ 81,449$ 58,633$ Debt amendment and issuance costs paid Preferred stock issuance costs paid Proceeds from issuance of industrial revenue bond New Markets. New Innovation. New Growth.

39 R ECONCILIATION OF N ON - GAAP M EASURES Note: This table reconciles annual net income (loss) for the periods presented to the non - GAAP measure of Operating EBITDA ($ in millions) 2009 2010 2011 2012 Q1 2013 Net (loss) income (101.8)$ (141.8)$ 15.0$ 105.6$ 5.7$ Income tax (benefit) expense (3.0) (0.1) 0.2 (57.1) 3.8 Increase in fair value of warrant 33.4 121.6 - - - Interest expense 4.4 4.1 4.1 21.7 7.5 Depreciation and amortization 19.6 16.9 15.6 25.6 9.8 Stock-based compensation 3.4 3.5 3.4 5.2 1.9 Impairment of goodwill - - - - - Acquisition expenses - - - 17.3 0.6 Other non-operating expense (income) 0.9 0.7 0.5 0.2 (2.2) Operating EBITDA (43.1)$ 4.9$ 38.8$ 118.5$ 27.1$ % of sales -12.8% 0.8% 3.3% 8.1% 8.4% New Markets. New Innovation. New Growth.

40 Notes: R ECONCILIATION OF N ON - GAAP M EASURES ($ in millions) This table reconciles the trailing twelve month net income (loss) for the periods presented above to the non - GAAP measure of Operating EBITDA 2013 Q1 Q2 Q3 Q4 Q1 Q2 Q3 Q4 Q1 Q2 Q3 Q4 Q1 Q2 Q3 Q4 Q1 Net (loss) income (147.7)$ (162.4)$ (224.5)$ (101.8)$ (212.5)$ (200.2)$ (135.7)$ (141.8)$ 0.6$ 9.5$ 12.5$ 15.0$ 17.0$ 15.6$ 32.9$ 105.6$ 106.2$ Income tax expense (benefit) 20.8 21.8 23.0 (3.0) (3.0) (3.0) (2.9) (0.1) (0.2) (0.2) (0.1) 0.2 (0.3) 0.8 1.9 (57.1) (52.9) Increase (Decrease) in fair value of warrant - - 54.0 33.4 160.3 158.4 101.1 121.6 (5.2) (3.3) - - - - - - - Interest expense 4.5 4.8 4.7 4.4 4.3 4.0 3.9 4.1 4.0 4.1 4.2 4.1 3.9 8.2 14.9 21.7 28.5 Depreciation and amortization 21.1 20.7 20.3 19.6 19.2 18.7 18.0 16.9 16.3 15.9 15.7 15.6 15.4 18.6 21.7 25.6 31.6 Stock-based compensation 5.1 5.0 4.5 3.4 3.3 3.0 2.9 3.5 3.4 3.2 2.9 3.4 4.0 4.1 5.2 5.2 5.7 Impairment of goodwill 66.3 66.3 66.3 - - - - - - - - - - - - - - Acquisition expenses - - - - - - - - - - - - 1.7 15.0 17.0 17.3 16.2 Other non-operating expense (income) 0.2 (0.1) 1.3 0.9 0.8 1.7 0.5 0.7 0.8 0.7 0.7 0.5 0.6 - (0.2) 0.2 (2.0) Operating EBITDA (29.7)$ (43.9)$ (50.4)$ (43.1)$ (27.6)$ (17.4)$ (12.2)$ 4.9$ 19.7$ 29.9$ 35.9$ 38.8$ 42.3$ 62.3$ 93.4$ 118.5$ 133.3$ % of sales -3.9% -6.9% -10.4% -12.8% -8.2% -4.3% -2.5% 0.8% 2.5% 3.2% 3.3% 3.3% 3.4% 4.7% 6.7% 8.1% 8.8% Trailing Twelve Months Operating EBITDA For Quarter Ending 20122009 2010 2011 New Markets. New Innovation. New Growth.