Attached files
| file | filename |
|---|---|
| 8-K - ROSE 8K MAY IR PRESENTATION - NBL Texas, LLC | form8-krosemayppt.htm |
Exhibit 99.1

Rosetta Resources Inc. Investor Presentation May 2013

Forward-Looking Statements and Terminology Used This presentation includes forward-looking statements, which give the Company's current expectations or forecasts of future events based on currently available information. Forward-looking statements are statements that are not historical facts, such as expectations regarding drilling plans, including the acceleration thereof, production rates and guidance, resource potential, incremental transportation capacity, exit rate guidance, net present value, development plans, progress on infrastructure projects, exposures to weak natural gas prices, changes in the Company's liquidity, changes in acreage positions, expected expenses, expected capital expenditures, and projected debt balances. The assumptions of management and the future performance of the Company are subject to a wide range of business risks and uncertainties and there is no assurance that these statements and projections will be met. There are risks and uncertainties associated with the Company’s recent acquisition of Permian Basin assets. Factors that could affect the Company's business include, but are not limited to: the risks associated with drilling of oil and natural gas wells; the Company's ability to find, acquire, market, develop, and produce new reserves; the risk of drilling dry holes; oil and natural gas price volatility; derivative transactions (including the costs associated therewith and the abilities of counterparties to perform thereunder); uncertainties in the estimation of proved, probable, and possible reserves and in the projection of future rates of production and reserve growth; inaccuracies in the Company's assumptions regarding items of income and expense and the level of capital expenditures; uncertainties in the timing of exploitation expenditures; operating hazards attendant to the oil and natural gas business; drilling and completion losses that are generally not recoverable from third parties or insurance; potential mechanical failure or underperformance of significant wells; availability and limitations of capacity in midstream marketing facilities, including processing plant and pipeline construction difficulties and operational upsets; climatic conditions; availability and cost of material, supplies, equipment and services; the risks associated with operating in a limited number of geographic areas; actions or inactions of third-party operators of the Company's properties; the Company's ability to retain skilled personnel; diversion of management's attention from existing operations while pursuing acquisitions or dispositions; availability of capital; the strength and financial resources of the Company's competitors; regulatory developments; environmental risks; uncertainties in the capital markets; general economic and business conditions; industry trends; and other factors detailed in the Company's most recent Form 10-K, Form 10-Q and other filings with the Securities and Exchange Commission. If one or more of these risks or uncertainties materialize (or the consequences of such a development changes), or should underlying assumptions prove incorrect, actual outcomes may vary materially from those forecasted or expected. The Company undertakes no obligation to publicly update or revise any forward-looking statements except as required by law. For filings reporting year-end 2012 reserves, the SEC permits the optional disclosure of probable and possible reserves. The Company has elected not to report probable and possible reserves in its filings with the SEC. We use the term “net risked resources” or “inventory” to describe the Company’s internal estimates of volumes of natural gas and oil that are not classified as proved reserves but are potentially recoverable through exploratory drilling or additional drilling or recovery techniques. Estimates of unproved resources are by their nature more speculative than estimates of proved reserves and accordingly are subject to substantially greater risk of actually being realized by the Company. Estimates of unproved resources may change significantly as development provides additional data, and actual quantities that are ultimately recovered may differ substantially from prior estimates. *

Leverage High-Grade Asset Base Grow new core area in Permian Basin; vertical and horizontal application Maintain position as a leading operator in the high-return Eagle Ford play Develop combined inventory of approximately 645 MMBoe in liquids-rich Eagle Ford and oil-weighted Permian Basin Successfully Execute Business Plan Grow total production and liquids volumes while applying cross-basin knowledge Lower overall cost structure and improve margins Capture firm transportation and processing capacity Test Future Growth Opportunities Evaluate previously untested Eagle Ford acreage Continue testing optimal Eagle Ford and Wolfbone well spacing Pursue new growth targets through bolt-on acquisitions in core areas Maintain Financial Strength & Flexibility Actively manage and monitor use of debt Maintain adequate liquidity throughout cycles Manage exposure to commodity price risk through prudent hedging program Company Strategy *
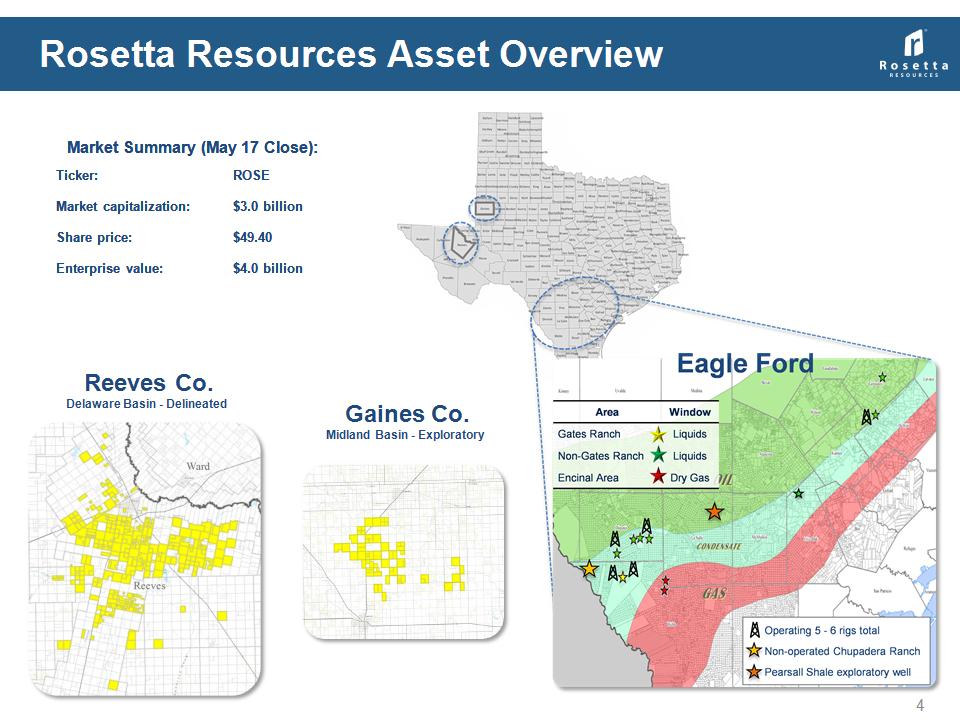
Rosetta Resources Asset Overview Market Summary (May 17 Close): Market Summary (May 17 Close): Ticker: ROSE Market capitalization: $3.0 billion Share price: $49.40 Enterprise value: $4.0 billion Gaines Co. Midland Basin – Exploratory Reeves Co. Delaware Basin - Delineated *
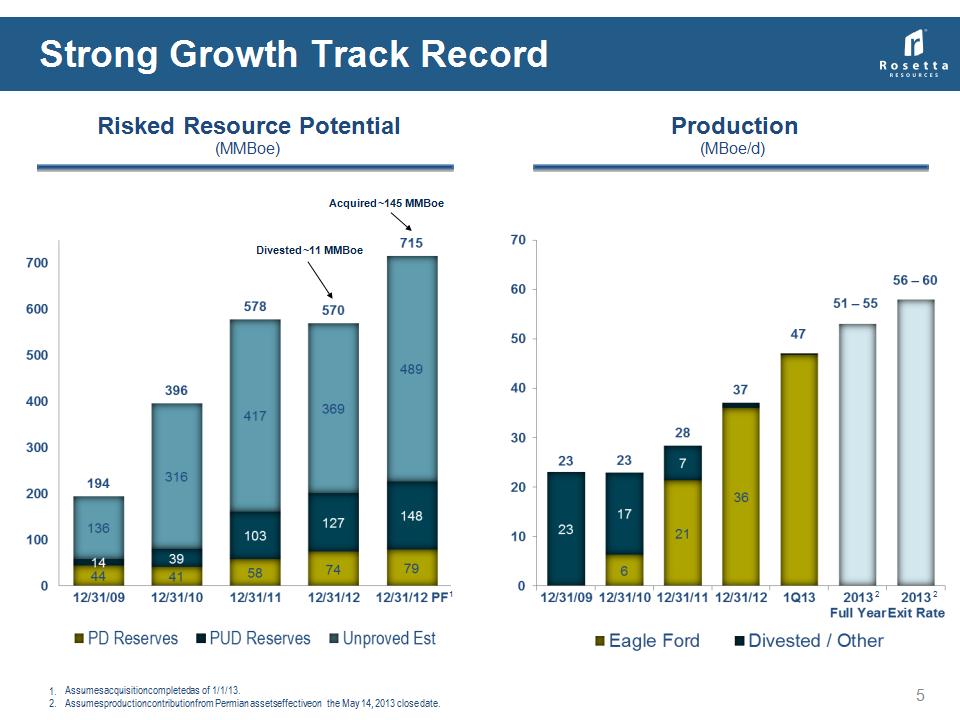
Divested ~11 MMBoe Acquired ~145 MMBoe 2 Assumes acquisition completed as of 1/1/13. Assumes production contribution from Permian assets effective on the May 14, 2013 close date. 1 2 Strong Growth Track Record Risked Resource Potential (MMBoe) Production (MBoe/d) *

By Region 2013 Capital Program ($840-$900 Million1) * Continued focus on oil and liquids-rich development: Eagle Ford 5 to 6-rig program Drill 75 - 80 wells and complete approximately 60 - 65 Delaware Basin 3 to 6-rig program Drill & complete combination of operated/ non-operated vertical oil wells Fund base capital program from internally-generated cash flow supplemented by borrowings under credit facility Generate ~40% production growth over 20122 2013 Guidance; Includes capitalized interest and other corporate costs. Assumes mid-point of 2013 production guidance over 2012 average daily production By Category Other 11% Permian 20% Eagle Ford 69% Other 11% Facilities 7% Drill & Complete 82%

* PERMIAN BASIN – NEW CORE AREA *

Permian Basin Acquisition Highlights Acquired oil-rich assets from Comstock Resources 53,306 net acres in Delaware Basin in Reeves County and Midland Basin in Gaines County Closed on May 14, 2013; effective date January 1, 2013 Total Consideration: $811 MM (purchase price $768 MM) Funded with net proceeds from Senior Notes issued in April and borrowings under expanded Credit Facility Process Annually review 2 - 3 new basins and asset ideas presented to executive team with best presented to Board Permian has been high on M&A target list for some time New Ventures group evaluated Permian area for several years as well as other basins Technical staff focused on understanding reservoir rock, looking for quality acreage positions above quantity Screened for well-delineated, repeatable, oil-weighted acreage with substantial undeveloped potential Identified significant upside opportunities with multiple stacked pays in Permian Permian economically viable in lower commodity price environments compared to other basins * Gaines Reeves

Asset Potential Stacked Zones Provide Collection of Vertical/Horizontal Development Opportunities

Reeves County Vertical Wolfbone * Central East BOE (bbl/d) Normalized Time (year) BOE (bbl/d) Normalized Time (year) Wolfbone Area Central East Well Costs ($MM) $3.5 $3.5 Spacing 40-acre 40-acre 30-Day IP Boepd (gross) 235 265 Composite EUR Mboe (gross) 260 230 % Oil 70% 65% % NGL 16% 19%
* EAGLE FORD – ESTABLISHED CORE AREA *

Source: IHS, Inc., reported February 2013 production (as of 5/15/2013); gross 8/8ths production (select 16-county area) Top 20 Eagle Ford Producers include APC, BHP, CHK, COP, CRZO, EP, EOG, GeoSouthern, Hunt, Lewis, MRO, MTDR, MUR, PXD, PXP, RDS, ROSE, SFY, SM, TLM % of Eagle Ford Shale Production Gross Boe/d per Well Top 20 Eagle Ford Producers *

Gates Ranch * WI = 90% NRI = 67.5% Average Well Characteristics Average Well Characteristics Well Costs $6.5 - $7.0 MM Spacing 55 acres (475 feet apart) Composite EUR 1.67 MMBoe F&D Costs $5.39/Boe Condensate Yield 65 Bbls/MMcf NGL Yield 110 Bbls/MMcf Shrinkage 23% Summary 3/31/2013 26,500 net acres in Webb County 108 gross completions to date 320 gross well locations remaining1 WI = 100% NRI = 75% 21 wells drilled yet to be completed 1Q 2013: 12 completions Under current 55-acre spacing assumptions

33 wells Our largest continuous group of producing wells spaced on 55 acres The 33 wells are performing in line with comparable offsetting wells drilled and completed early in the development of the area and spaced on 100 acres … 1000 (days) * Well Performance on 55 acres Compared to similar offsetting wells spaced at 100 acres Cumulative BOE (bbl) - 2-Stream

Summary 3/31/2013 Briscoe Ranch 3,545 net acres in southern Dimmit County 4 gross completions to date 64 gross well locations remaining Future Activity Planned full development activity expected to last well into 2016 Average Well Characteristics Average Well Characteristics Well Costs $6.5 - $7.0 MM Spacing 50 acres (425 feet apart) F&D Costs $5.39/Boe Condensate Yield 100 Bbls/MMcf NGL Yield 130 Bbls/MMcf Shrinkage 23% 7 wells drilled yet to be completed *
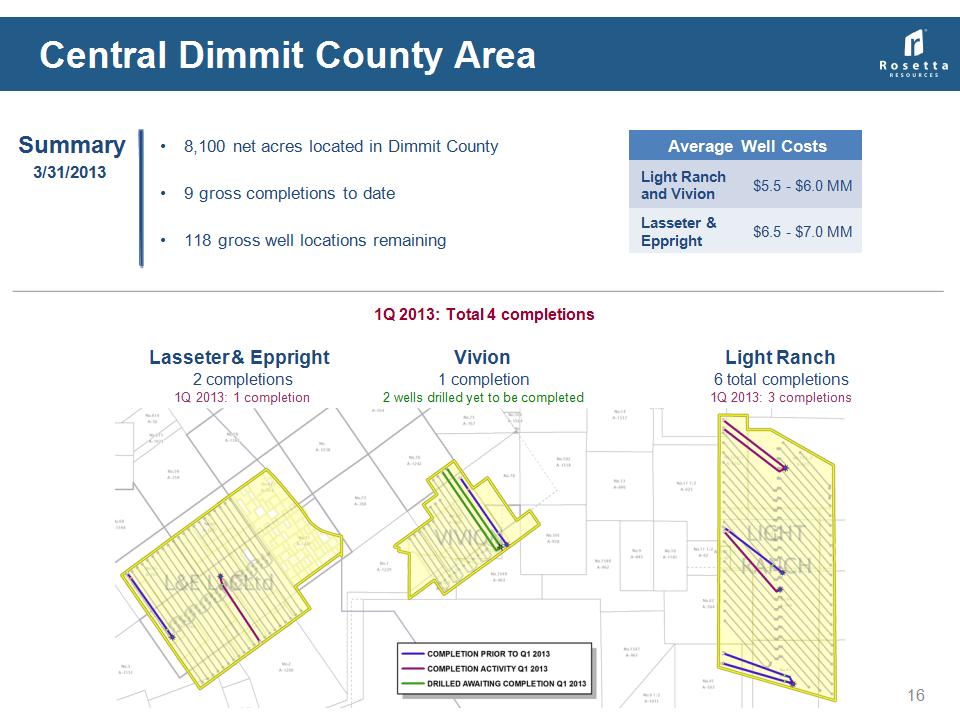
Summary 3/31/2013 Central Dimmit County Area 8,100 net acres located in Dimmit County 9 gross completions to date 118 gross well locations remaining 1Q 2013: Total 4 completions Average Well Costs Average Well Costs Light Ranch and Vivion $5.5 - $6.0 MM Lasseter & Eppright $6.5 - $7.0 MM 2 completions 1Q 2013: 1 completion Lasseter & Eppright Light Ranch 6 total completions 1Q 2013: 3 completions Vivion 1 completion 2 wells drilled yet to be completed *
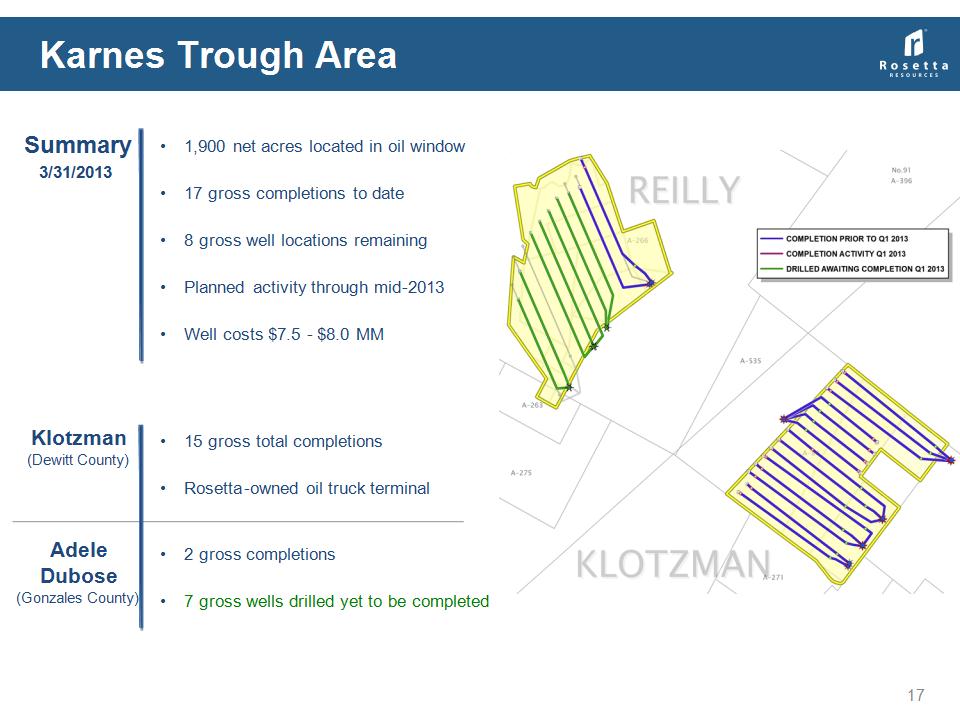
Summary 3/31/2013 Karnes Trough Area 1,900 net acres located in oil window 17 gross completions to date 8 gross well locations remaining Planned activity through mid-2013 Well costs $7.5 – $8.0 MM Klotzman (Dewitt County) 15 gross total completions Rosetta-owned oil truck terminal Adele Dubose (Gonzales County) 2 gross completions 7 gross wells drilled yet to be completed *
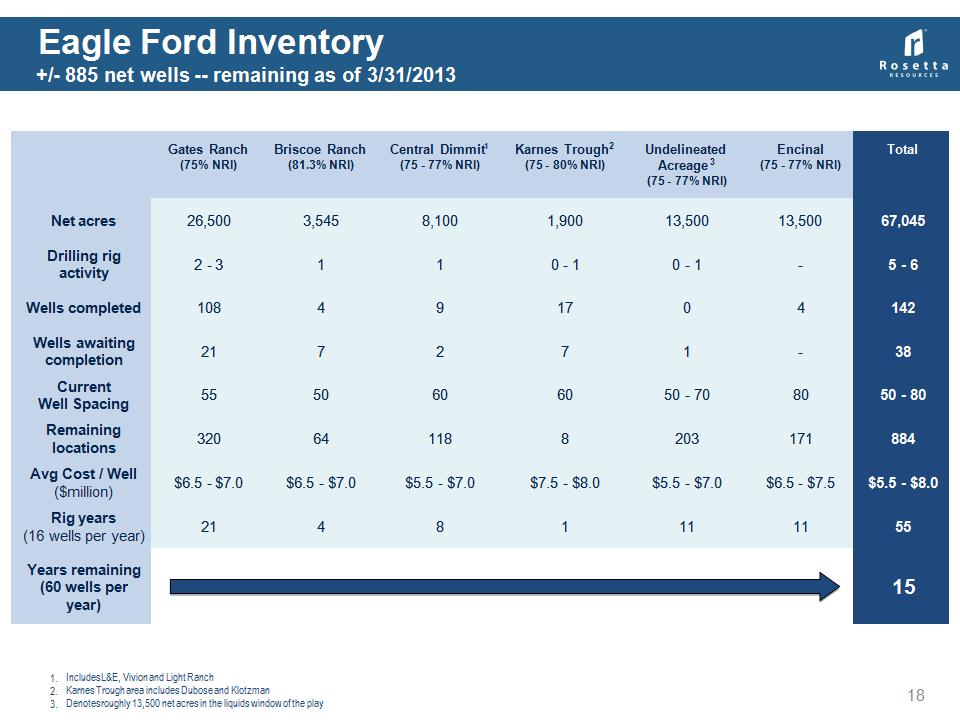
Gates Ranch (75% NRI) Briscoe Ranch (81.3% NRI) Central Dimmit1 (75 – 77% NRI) Karnes Trough2 (75 – 80% NRI) Undelineated Acreage3 (75 – 77% NRI) Encinal (75 – 77% NRI) Total Net acres 26,500 3,545 8,100 1,900 13,500 13,500 67,045 Drilling rig activity 2 – 3 1 1 0 – 1 0 – 1 - 5 - 6 Wells completed 108 4 9 17 0 4 142 Wells awaiting completion 21 7 2 7 1 - 38 Current Well Spacing 55 50 60 60 50 - 70 80 50 - 80 Remaining locations 320 64 118 8 203 171 884 Avg Cost / Well ($million) $6.5 - $7.0 $6.5 - $7.0 $5.5 - $7.0 $7.5 - $8.0 $5.5 - $7.0 $6.5 - $7.5 $5.5 - $8.0 Rig years (16 wells per year) 21 4 8 1 11 11 55 Years remaining (60 wells per year) 15 Eagle Ford Inventory +/- 885 net wells -- remaining as of 3/31/2013 Includes L&E, Vivion and Light Ranch Karnes Trough area includes Dubose and Klotzman Denotes roughly 13,500 net acres in the liquids window of the play *

* MARKETING AND FINANCIAL OVERVIEW *

Eagle Ford Multiple Takeaway Options Gates Ranch NGL Breakdown May 2013 *

Oil Currently trucked from leases WTI Midland to WTI Cushing basis back to normal (-$0.50 to -$1.00 per Bbl) Oil gravity range 45 - 49 degrees and receives no gravity deducts Natural Gas Gas is rich and is processed at two plants Most leases under long-term gathering agreement Residue gas sales tied to Waha and Permian indices NGLs NGLs extracted under firm, multi-year gathering/processing agreements Combination of net proceeds and Mont Belvieu pricing Permian Basin Marketing *

$40.64 $41.96 $80.16 X $115.71 $83.33 X $109.63 $95.72 $93.06 $87.40 1 Fixed price is based on weighted average of all components of the NGL barrel. Commodity Derivatives Position – May 21, 2013 *

Liquidity Adequate liquidity available to fund 2013 $840 - $900 million capital program Borrowing base raised from $625 million to $800 million on April 12, 2013 Note: Permian Basin acquisition closed on May 14, 2013 *

Combined 2013 Annual Guidance *

Investment Summary Drill-bit focused producer with large acreage positions in liquids-rich Eagle Ford and oil-weighted Permian Basin plays Attractive new core Delaware Basin position Successful operator in the high-return Eagle Ford area Large inventory of future growth opportunities Financial strength and flexibility; conservative philosophy * “Rosetta Resources – Building Rock Solid Value”

* APPENDIX *

Reeves County ~145 MMBoe Resource (40-acre vertical development only) *

Lopez Farm-In 505 net acres in Live Oak County Farm-In from Killam Oil BPO: 100% WI, 75% NRI APO: 65% WI, 48.75% NRI 1 well drilled yet to be completed Summary 3/31/2013 Average Well Characteristics Average Well Characteristics Well Costs $7.5 - $8.0 MM Spacing 60 acres *

Attractive Well Economics Note: Reserves and Economic metrics are “Unrisked”. Oil price assumptions, $/Bbl - $91.72 in 2013, $89.88 in 2014, $95.00 thereafter. NGL price assumptions, $/Bbl - $42.77 in 2013, $41.91 in 2014, $44.30 thereafter. Gas price assumptions, $/MMBtu - $3.71 in 2013, $4.10 in 2014, $4.60 thereafter. Gates Ranch North Gates Ranch South Briscoe Ranch Klotzman L&E Adele Dubose Vertical Wolfbone Central Vertical Wolfbone East Average WI / NRI 100% - 90% / 75% - 67.5% 100% - 90% / 75% - 67.5% 100% / 81.3% 100% / 75% 100% / 75% 100% / 80% 71% / 53% 55% / 41% Average Cost / Well ($M) $6.5 - $7.0 $6.5 - $7.0 $6.5 - $7.0 $7.5 - $8.0 $6.5 - $7.0 $7.5 - $8.0 $3.5 $3.5 Gross IP (Boe/d) 1,240 1,340 1,995 2,460 960 890 235 265 Gross Reserves (MBoe) P50, Unrisked 1,400 22% oil/ 34% NGL 1,900 18% oil/ 35% NGL 893 28% oil/ 34% NGL 665 71% oil/ 12% NGL 894 40% Oil/ 30% NGL 303 75% oil/ 14%NGL 260 70% oil/ 16% NGL 230 65% oil/ 19% NGL Rate of Return BFIT (%) 70% 87% 167% 172% 75% 44% 34% 26% PV10 BFIT ($M) 12,361 17,690 17,175 16,424 12,341 4,771 1,790 1,200 Payout BFIT (yrs) 1.22 1.06 0.55 0.49 1.13 1.55 2.62 3.15 Net Developed F&D ($/Boe) 6.52 4.61 8.94 16.44 9.84 32.35 17.95 20.29 *

Gates Ranch Well Performance – North & South Areas Composite Type Curve - 1.7 MMBoe (19% Oil / 35% NGLs) South Type Curve - 1.9 MMBoe (18% Oil / 35% NGLs) North Type Curve - 1.4 MMBoe (22% Oil / 34% NGLs) Discovery well: Shortest lateral at 3,500’ and only 10 frac stages (days) * BOE (bbl/d) - 2-Stream

P50 Type Curve - 893 MBoe (28% Oil / 34% NGLs) Briscoe Ranch (days) Initial Well * BOE (bbl/d) - 2-Stream

Karnes Trough Area – Klotzman P50 Type Curve - 665 MBoe (71% Oil / 12% NGLs) (days) * BOE (bbl/d) - 2-Stream
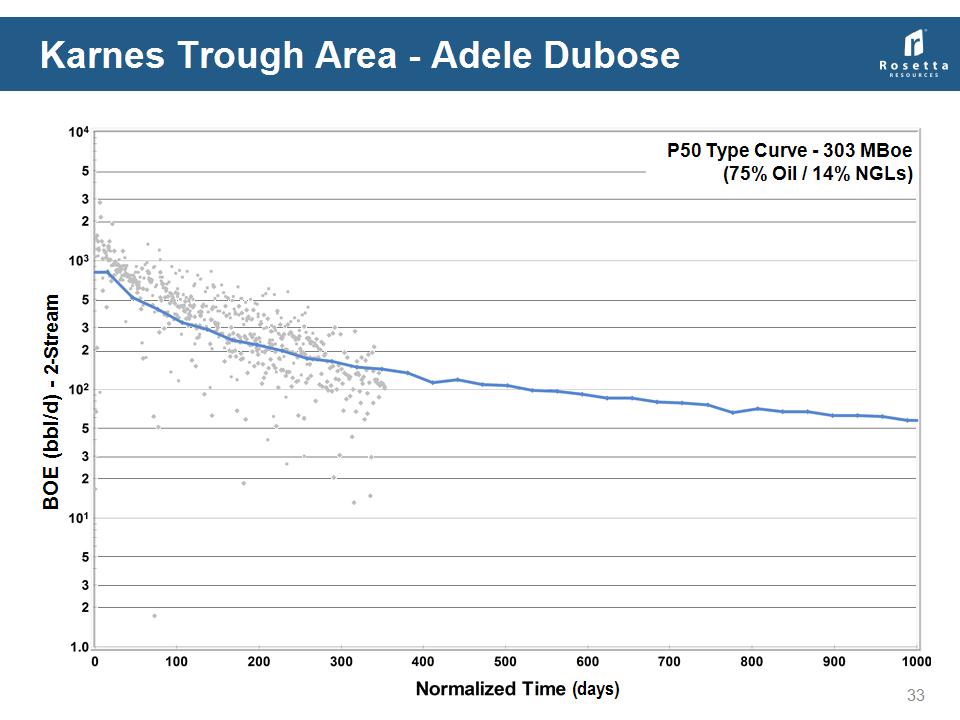
Karnes Trough Area – Adele Dubose (days) P50 Type Curve - 303 MBoe (75% Oil / 14% NGLs) * BOE (bbl/d) - 2-Stream

(days) P50 Type Curve - 894 MBoe (40% Oil / 30% NGLs) Central Dimmit – Lasseter & Eppright * BOE (bbl/d) - 2-Stream

Annual Guidance – Framing For Quarterly Models Volumes and Product Mix 2013 exit rate 56 – 60 MBoe per day 2013 oil exit rate 16 – 19 MBbls per day 2013 liquids (oil plus NGLs) exit rate 35 – 38 MBbls per day Treating & Transportation fees impacted by mix changes Crude Oil Pricing Average realized price continues to approximate WTI NGL pricing (Mont Belvieu Benchmark) Firm fractionation capacity Adjust for fractionation fees approximately $3 to $4 per barrel Adjust for reported 2013 derivative activity, including ethane Pricing estimates based on % of WTI not as correlative *