Attached files
| file | filename |
|---|---|
| 8-K - 8-K - HCC INSURANCE HOLDINGS INC/DE/ | a13-13307_18k.htm |
Exhibit 99.1
|
|
First Quarter 2013 Investor Presentation May 28, 2013 |
|
|
See Notice About This Presentation Notice About This Presentation ABOUT FORWARD-LOOKING STATEMENTS: This presentation contains certain “forward-looking statements” within the meaning of Section 27A of the Securities Act of 1933 and Section 21E of the Securities Exchange Act of 1934, which are intended to be covered by the safe harbors created by those laws. These forward-looking statements reflect our current expectations and projections about future events and include information about possible or assumed future results of our operations. All statements, other than statements of historical facts, included or incorporated by reference in this presentation that address activities, events or developments that we expect or anticipate may occur in the future, including such things as growth of our business and operations, business strategy, competitive strengths, goals, plans, future capital expenditures and references to future successes may be considered forward-looking statements. Generally, words such as “anticipate,” “believe,” “estimate,” “expect,” “intend,” “plan,” “probably” or similar expressions indicate forward-looking statements. Many risks and uncertainties may have an impact on the matters addressed in these forward-looking statements, which could affect our future financial results and performance. These events or factors could cause our results or performance to differ materially from those we express in our forward-looking statements. Although we believe that the assumptions underlying our forward-looking statements are reasonable, any of these assumptions, and, therefore, the forward-looking statements based on these assumptions, could themselves prove to be inaccurate. In light of the significant uncertainties inherent in the forward-looking statements that are included in this presentation, our inclusion of this information is not a representation by us or any other person that our objectives or plans will be achieved. Our forward-looking statements speak only at the date made, and we will not update these forward-looking statements unless the securities laws require us to do so. In light of these risks, uncertainties and assumptions, any forward-looking events discussed in this presentation may not occur. PRESENTATION FORMATTING: Certain figures included in this publication have been rounded for presentation and are provided for comparative purposes only. Our periodic reports filed with the Securities and Exchange Commission contain more detailed information, including specific figures. 2 |
|
|
See Notice About This Presentation 3 HCC Overview |
|
|
See Notice About This Presentation What Is HCC? Specialty Insurance Underwriter 4 |
|
|
Segment Mix Diverse, non-correlated lines of business See Notice About This Presentation 5 |
|
|
See Notice About This Presentation Insurance Underwriting Segments 6 U.S. Property & Casualty Professional Liability U.S. Surety & Credit International Accident & Health Aviation E&O / EPLI Public Risk Contingency Disability Technical Property Casualty Energy Property Liability Surety Credit A&H Contract Surety Commercial Surety Credit Medical Stop-loss ST Domestic and International Medical U.S. D&O International D&O Large Account E&O |
|
|
See Notice About This Presentation Combined Ratio 7 83.6% Target: mid-80s Note: Results are full year 2012. |
|
|
See Notice About This Presentation Expense Ratio Lowest expense ratio amongst industry peers1 8 25.4% Note: Results are full year 2012. 1 Peer group defined as AFG, AGII, CB, MKL, NAVG, ORI, RLI, TRV and WRB. |
|
|
See Notice About This Presentation Highly Rated Insurer Financial Strength Ratings: AA (Very Strong) from Standard & Poor’s A+ (Superior) from A.M. Best Company AA (Very Strong) from Fitch Ratings A1 (Good Security) from Moody’s 9 |
|
|
See Notice About This Presentation 10 1Q13 Results |
|
|
See Notice About This Presentation 1Q13 Operating Highlights Record first quarter net earnings of $105.9 million and net earnings per diluted share of $1.05 Combined ratio of 83.8%; 82.7% excluding cats Expense ratio of 24.5% Net written premium increased 4% to $579.2 million ROE of 11.9%1; operating ROE of 11.4%2 Book value per share (BVPS) growth of 1.7% to $35.68 Five-year compounded BVPS growth of 10.4%3 11 Note: Results are first quarter year-to-date 2013, unless otherwise indicated. 1 Annualized year-to-date 2013 net earnings divided by average shareholders’ equity. 2 Annualized operating return on equity is a non-GAAP financial measure. See GAAP reconciliation on slide 27. 3 As of 3/31/13. |
|
|
Segment Overview ($ in millions) 12 See Notice About This Presentation Gross Written Premium Net Earned Premium Combined Ratio 1 Includes Exited Lines (GWP = $12M; NEP = $11M). 2 Includes Exited Lines (GWP = $5M; NEP = $5M). 1Q12 Total1: $683 1Q13 Total2: $720 1Q12 Total1: $547 1Q13 Total2: $561 1Q12 Total: 85.5% 1Q13 Total: 83.8% |
|
|
See Notice About This Presentation Segment Highlights 13 U.S. Property & Casualty Professional Liability U.S. Surety & Credit International Accident & Health Note: Results are first quarter year-to-date 2013. 82.9% combined ratio 13% NWP growth Positive pricing and earnings momentum 77.4% combined ratio 15% NEP growth 8% earnings growth 83.4% combined ratio Consistent, strong underwriting results 88.2% combined ratio 5% NEP growth 5% earnings growth 80.0% combined ratio 22% earnings growth Mid-single-digit price increases |
|
|
See Notice About This Presentation 14 Business as Usual |

|
|
Profitable Growth 15 CAGR (2007-2012) GWP: 2.6% NWP: 2.6% NEP: 2.5% Premium ($ in millions) See Notice About This Presentation Gross Written Net Written Net Earned |
|
|
Strong Underwriting Performance 16 GAAP Underwriting Ratios See Notice About This Presentation Loss Ratio Expense Ratio |
|
|
See Notice About This Presentation Effective Catastrophe Management 17 1 4/1/13 PML excludes reinstatement premiums and is based on 1 in 250 year estimates from RMS Cat Model Version 11.0.1411.2 and internal PML estimates for lines not modeled in RMS. After-tax Net Probable Maximum Loss (PML)1 for a single event managed to 5% of Shareholders’ Equity After-tax Net PML as % of Shareholders’ Equity 1.7% 2.2% 2.0% 2.9% 1 in 100 1 in 250 CA Earthquake US Wind |
|
|
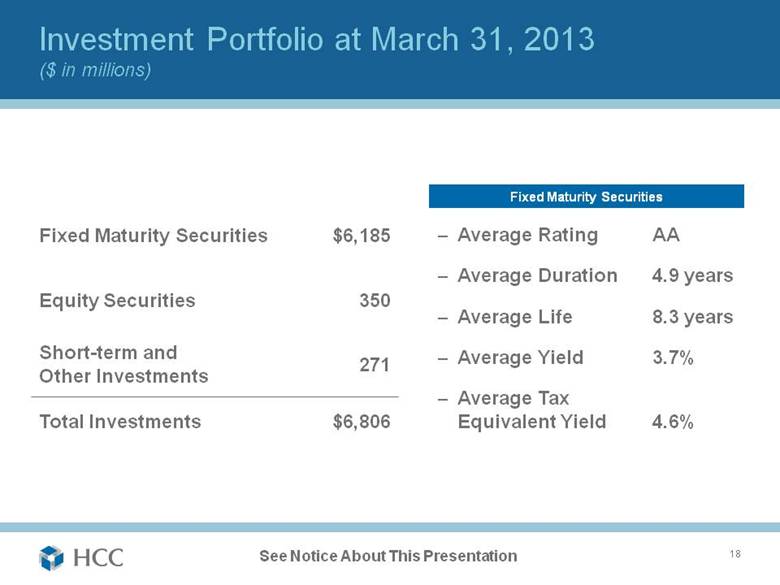
See Notice About This Presentation Investment Portfolio at March 31, 2013 ($ in millions) 18 Average Rating AA Average Duration 4.9 years Average Life 8.3 years Average Yield 3.7% Average Tax Equivalent Yield 4.6% Fixed Maturity Securities $6,185 Equity Securities 350 Short-term and Other Investments 271 Total Investments $6,806 Fixed Maturity Securities |
|
|
See Notice About This Presentation Investment Analysis at March 31, 2013 ($ in millions) 19 1 % of fair value of total fixed maturity or equity securities. 60% |
|
|
See Notice About This Presentation 20 Peer Comparison Category Cost Fair Value % of Total1 Municipal Bonds $3,056 $3,294 53% Corporate - U.S. 727 767 12% Corporate - Foreign 521 535 9% RMBS 631 656 11% CMBS and Other Asset-Backed Securities 530 564 9% U.S. Government and Agencies 122 126 2% Foreign Government 232 243 4% Total Fixed Maturity Securities $5,819 $6,185 100% Equity Securities - U.S. $126 $140 40% Equity Securities - Foreign 193 210 60% Total Equity Securities $319 $350 100% |
|
|
See Notice About This Presentation Total Value Creation 21 1 Calculated by HCC using 12/31/12 and prior SEC filings for peer companies. Peers reflects average for peer companies. 2 To maintain comparability, results for 2011 and prior were not adjusted to reflect 2012 adoption of accounting standard for policy acquisition costs. Impact of adoption is reflected in 2012. Compounded Annual Return on Tangible Book Value per Share, Including Dividends1, 2 1 Year 3 Year 5 Year 10 Year 16.0% 10.1% 13.2% 10.1% 15.0% 8.9% 17.9% 12.8% HCC Peers HCC Peers HCC Peers HCC Peers |
|
|
22 Total Value Creation – 10 Years Source: Dowling & Partners; data through 12/31/12. See Notice About This Presentation Ace Ltd. HCC Arch Capital W.R. Berkely Partner Re Travelers Chubb American Fin’t Market Safety Infinity P&C Progressive Renaissance Re AXIS Capital RLI Fairfax Navigators Everest Re Allied World Aspen Argo Group Platinum Endurance Mercury General White Mountains Alterra Allstate Selective Montpeller Re Baldwin & Lyons Hartford Fin’l Hanover Cincinnati Fin’l XL Group CNA Fin’l |
|
|
See Notice About This Presentation Outperformance with Low Volatility – 10 Years 23 Source: Dowling & Partners; data through 12/31/12. SAFT PGR MCY IPCC ALL TRV ACE CB FRFHF HIG CNA ACGL AXS AGII AWH ENH WTM ALTE XL AHL SIGI CINF THG PRE RE PTP WRB HCC AFG RLI MKL NAVG BWINB RNR MRH 0 7 14 21 28 35 0 7 14 21 28 35 10 Year Avg. C. Ratio Standard Deviation in C. Ratio 10 YEAR AVG. COMBINED RATIO & STANDARD DEVIATION IN C. RATIO Auto Large Cap Cml Offshore (Re)ins Regional Reinsurance Specialty Property/Short-tail Source: Company Reports, D&P Analysis 1st Quintile (Highest) 2nd Quintile 3rd Quintile 4th Quintile 1st Quintile (Lowest) 2nd Quintile 3rd Quintile 4th Quintile 5th Quintile (Highest) 5th Quintile (Lowest) |
|
|
See Notice About This Presentation Outperformance with Low Volatility – 5 Years 24 Source: Dowling & Partners; data through 12/31/12. IPCC SAFT PGR MCY ALL FRFHF ACE TRV CB CNA HIG ACGL AWH AHL ENH AXS AGII WTM ALTE GBLI XL THG SIGI CINF PRE PTP RE GLRE HCC AFG RLI WRB NAVG TWGP Y MKL OB BWINB LRE RNR VR MRH 0 9 18 27 36 45 0 9 18 27 36 45 5 Year Avg. C. Ratio Standard Deviation in C. Ratio 5 YEAR AVG. COMBINED RATIO & STANDARD DEVIATION IN C. RATIO Auto Large Cap Cml Offshore (Re)Insurance Regional Reinsurance Specialty Property/Short-tail Source: Company Reports, D&P Analysis 1st Quintile (Highest) 2nd Quintile 3rd Quintile 4th Quintile 1st Quintile (Lowest) 2nd Quintile 3rd Quintile 4th Quintile 5th Quintile (Highest) 5th Quintile (Lowest) |
|
|
14.9 point difference versus peers over last year 11.9 point difference versus peers over last three years 10.9 point difference versus peers over last five years See Notice About This Presentation Combined Ratio – HCC versus Peer Group 25 1 Year 3 Year2 5 Year2 1 Calculated by HCC using 12/31/12 and prior SEC filings for peer companies. Peers reflects average for peer companies. 2 Reflects average for three-year and five-year results. 1 1 1 83.6% 98.5% 86.6% 98.5% 86.0% 96.9% HCC Peers HCC Peers HCC Peers |
|
|
See Notice About This Presentation HCC’s Value Proposition Specialty Insurance businesses with strong long-term fundamentals and market leadership Diversified underwriting portfolio with historically low correlation Consistent track record of profitable growth and strong underwriting performance Lowest expense ratio amongst industry peers High quality investment portfolio Disciplined capital management Strong risk management practices Broadly experienced team 26 |
|
|
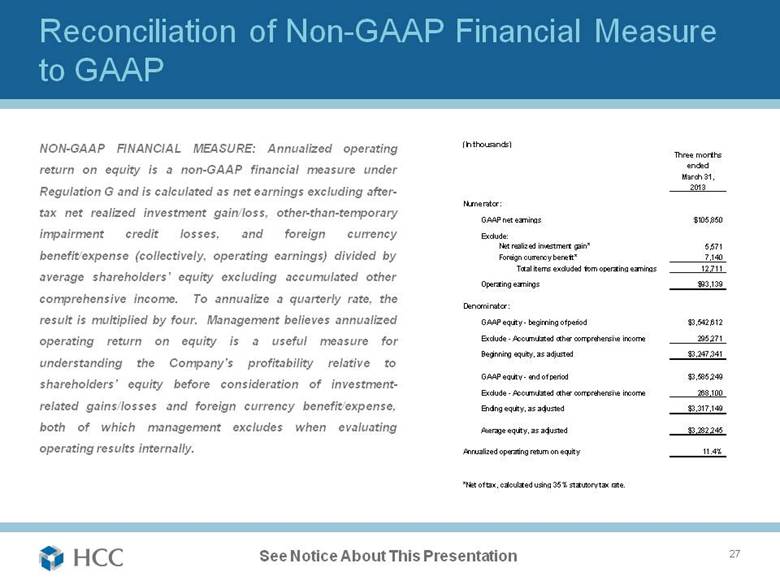
See Notice About This Presentation Reconciliation of Non-GAAP Financial Measure to GAAP NON-GAAP FINANCIAL MEASURE: Annualized operating return on equity is a non-GAAP financial measure under Regulation G and is calculated as net earnings excluding after-tax net realized investment gain/loss, other-than-temporary impairment credit losses, and foreign currency benefit/expense (collectively, operating earnings) divided by average shareholders’ equity excluding accumulated other comprehensive income. To annualize a quarterly rate, the result is multiplied by four. Management believes annualized operating return on equity is a useful measure for understanding the Company’s profitability relative to shareholders’ equity before consideration of investment-related gains/losses and foreign currency benefit/expense, both of which management excludes when evaluating operating results internally. 27 Three months ended March 31, 2013 $105,850 5,571 7,140 Total items excluded from operating earnings 12,711 $93,139 $3,542,612 295,271 $3,247,341 $3,585,249 268,100 $3,317,149 $3,282,245 11.4% Numerator: (In thousands) Foreign currency benefit* GAAP net earnings Exclude: Net realized investment gain* Beginning equity, as adjusted GAAP equity - end of period GAAP equity - beginning of period Exclude - Accumulated other comprehensive income Operating earnings Denominator: Annualized operating return on equity *Net of tax, calculated using 35% statutory tax rate. Average equity, as adjusted Exclude - Accumulated other comprehensive income Ending equity, as adjusted |
|
|
|