Attached files
| file | filename |
|---|---|
| 8-K - 8-K - MARKWEST ENERGY PARTNERS L P | a13-12949_18k.htm |
Exhibit 99.1
|
|
NAPTP INVESTOR CONFERENCE MAY 2013 |
|
|
Forward-Looking Statements This presentation contains forward-looking statements and information. These forward-looking statements, which in many instances can be identified by words like “could,” “may,” “will,” “should,” “expects,” “plans,” “project,” “anticipates,” “believes,” “planned,” “proposed,” “potential,” and other comparable words, regarding future or contemplated results, performance, transactions, or events, are based on MarkWest Energy Partners, L.P. (“MarkWest” and the “Partnership”) current information, expectations and beliefs, concerning future developments and their potential effects on MarkWest. Although MarkWest believes that the expectations reflected in the forward-looking statements are reasonable, it can give no assurance that such expectations will prove to be correct, and actual results, performance, distributions, events or transactions could vary significantly from those expressed or implied in such statements and are subject to a number of uncertainties and risks. Among the factors that could cause results to differ materially are those risks discussed in the periodic reports filed with the SEC, including MarkWest’s Annual Report on Form 10-K for the year ended December 31, 2012 and its Quarterly Report on Form 10-Q for the quarter ended March 31, 2013. You are urged to carefully review and consider the cautionary statements and other disclosures, including those under the heading “Risk Factors,” made in those documents. If any of the uncertainties or risks develop into actual events or occurrences, or if underlying assumptions prove incorrect, it could cause actual results to vary significantly from those expressed in the presentation, and MarkWest’s business, financial condition, or results of operations could be materially adversely affected. Key uncertainties and risks that may directly affect MarkWest’s performance, future growth, results of operations, and financial condition, include, but are not limited to: Fluctuations and volatility of natural gas, NGL products, and oil prices; A reduction in natural gas or refinery off-gas production which MarkWest gathers, transports, processes, and/or fractionates; A reduction in the demand for the products MarkWest produces and sells; Financial credit risks / failure of customers to satisfy payment or other obligations under MarkWest’s contracts; Effects of MarkWest’s debt and other financial obligations, access to capital, or its future financial or operational flexibility or liquidity; Construction, procurement, and regulatory risks in our development projects; Hurricanes, fires, and other natural and accidental events impacting MarkWest’s operations, and adequate insurance coverage; Terrorist attacks directed at MarkWest facilities or related facilities; Changes in and impacts of laws and regulations affecting MarkWest operations and risk management strategy; and Failure to integrate recent or future acquisitions. 2 |
|
|
Non-GAAP Measures Distributable Cash Flow, Adjusted EBITDA, and Net Operating Margin are not measures of performance calculated in accordance with GAAP, and should not be considered separately from or as a substitute for net income, income from operations, or cash flow as reflected in our financial statements. The GAAP measure most directly comparable to Distributable Cash Flow and Adjusted EBITDA is net income (loss). The GAAP measure most directly comparable to Net Operating Margin is income (loss) from operations. In general, we define DCF as net income (loss) adjusted for (i) depreciation, amortization, impairment, and other non-cash expense; (ii) amortization of deferred financing costs and discount; (iii) loss on redemption of debt net of current tax benefit; (iv) non-cash (earnings) loss from unconsolidated affiliates; (v) distributions from (contributions to) unconsolidated affiliates (net of affiliate growth capital expenditures); (vi) non-cash compensation expense; (vii) non-cash derivative activity; (viii) losses (gains) on the disposal of property, plant, and equipment (PP&E) and unconsolidated affiliates; (ix) provision for deferred income taxes; (x) cash adjustments for non-controlling interest in consolidated subsidiaries; (xi) revenue deferral adjustment; (xii) losses (gains) relating to other miscellaneous non-cash amounts affecting net income for the period; and (xiii) maintenance capital expenditures, net of joint venture partner contributions. We define Adjusted EBITDA as net income (loss) adjusted for (i) depreciation, amortization, impairment, and other non-cash expense; (ii) interest expense; (iii) amortization of deferred financing costs; (iv) loss on redemption of debt; (v) losses (gains) on the disposal of PP&E and unconsolidated affiliates; (vi) non-cash derivative activity; (vii) non-cash compensation expense; (viii) provision for income taxes; (ix) adjustments for cash flow from unconsolidated affiliates; (x) adjustment related to non-guarantor, consolidated subsidiaries; and (xi) losses (gains) relating to other miscellaneous non-cash amounts affecting net income for the period. We generally define Operating Income before Items Not Allocated to Segments as (i) revenue, excluding derivative gains and losses and adjusted for certain revenue deferral adjustments less; (ii) purchased product costs, excluding derivative gains and losses less; (iii) facility expenses, adjusted for certain non-cash items not allocated to segments and certain interest payments allocable to the segments less; ( iv) the portion allocable to non-controlling interests. Distributable Cash Flow is a financial performance measure used by management as a key component in the determination of cash distributions paid to unitholders. We believe distributable cash flow is an important financial measure for unitholders as an indicator of cash return on investment and to evaluate whether the Partnership is generating sufficient cash flow to support quarterly distributions. In addition, distributable cash flow is commonly used by the investment community because the market value of publicly traded partnerships is based, in part, on distributable cash flow and cash distributions paid to unitholders. Adjusted EBITDA is a financial performance measure used by management, industry analysts, investors, lenders, and rating agencies to assess the financial performance and operating results of the Partnership’s ongoing business operations. Additionally, we believe Adjusted EBITDA provides useful information to investors for trending, analyzing, and benchmarking our operating results from period to period as compared to other companies that may have different financing and capital structures. Net Operating Margin is a financial performance measure used by management and investors to evaluate the underlying baseline operating performance of our contractual arrangements. Management also uses Net Operating Margin to evaluate the Partnership’s financial performance for purposes of planning and forecasting. Please see the Appendix for reconciliations of Distributable Cash Flow, Adjusted EBITDA, and Net Operating Margin to the most directly comparable GAAP measure. 3 |
|
|
Key Investment Considerations 4 High-Quality, Diversified Assets Proven Growth and Customer Satisfaction Substantial Growth Opportunities Strong Financial Profile Leading presence in major shale plays including Marcellus, Utica, Huron/Berea, Woodford , Haynesville and Granite Wash formation Largest processor in the Marcellus Shale Largest fractionator in the Northeast Over $8 billion of organic growth and acquisitions since IPO Over $5 billion invested in Marcellus and Utica since 2008 Received top ranking in EnergyPoint’s 2013 Midstream Customer Satisfaction survey 2013 growth capital forecast of $1.5 to $1.8 billion 18 major processing and fractionation projects under construction Long-term agreements with over 25 major producer customers Established relationships & joint venture partners No incentive distribution rights, which drives a lower cost of capital Distributions have increased by 232% (12% CAGR) since IPO Growing fee-based margin to 70% for full-year 2014 Quarterly Distribution Growth of 232% Since IPO |
|
|
MarkWest Assets: Expansion and Diversification 5 Liberty Largest processor and fractionator in the Marcellus Shale with over 1.6 Bcf/d of processing capacity and 60,000 Bbl/d of fractionation capacity. Growing to 3.3 Bcf/d of processing capacity and 175,000 Bbl/d of fractionation capacity by the end of 2014 Utica Developing a leading position in the southern core of the Utica Shale with 185 MMcf/d of processing capacity. Growing to over 900 MMcf/d of processing capacity and 100,000 Bbl/d of fractionation capacity by the end of 2014 Northeast Largest processor and fractionator in the southern Appalachian Basin Southwest Best-in-class midstream services in the Granite Wash, Haynesville, Woodford and Eagle Ford Shales and have over 1.6 Bcf/d of gathering capacity and 817 MMcf/d of processing capacity |

|
|
Growth Driven By Customer Satisfaction 6 MarkWest has received the top rating in three of the last four EnergyPoint Research surveys “Midstream services within the domestic U.S. remains one of the most dynamic and hotly contested segments within the oil and gas industry. MarkWest Energy’s commitment to quality and customer service, exemplified by this year’s survey results, continues to resonate with customers, who are progressively looking for more reliable operations and deeper project development capabilities from midstream service suppliers.” Doug Sheridan, Managing Director EnergyPoint Research May 15, 2013 |
|
|
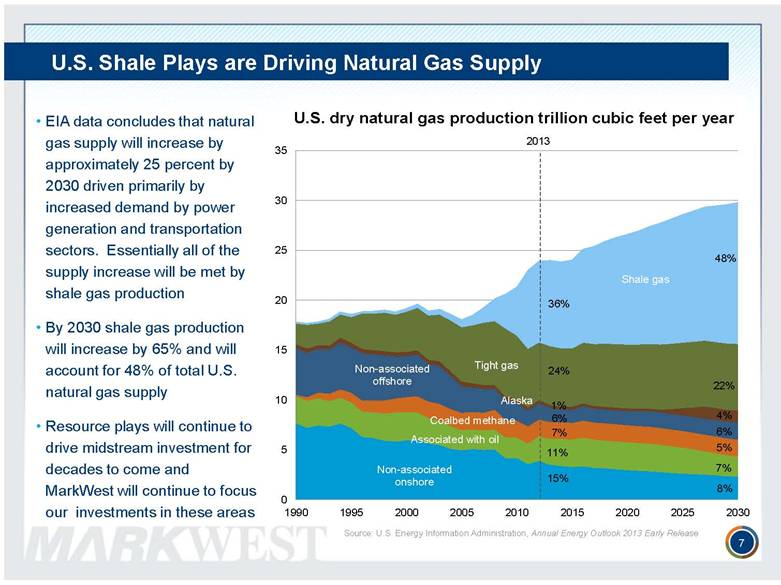
U.S. Shale Plays are Driving Natural Gas Supply 7 EIA data concludes that natural gas supply will increase by approximately 25 percent by 2030 driven primarily by increased demand by power generation and transportation sectors. Essentially all of the supply increase will be met by shale gas production By 2030 shale gas production will increase by 65% and will account for 48% of total U.S. natural gas supply Resource plays will continue to drive midstream investment for decades to come and MarkWest will continue to focus our investments in these areas Source: U.S. Energy Information Administration, Annual Energy Outlook 2013 Early Release 2013 36% 24% 1% 6% 7% 11% 15% 22% 4% 6% 5% 7% 8% 48% |
|
|
U.S. Shale Play Volume Growth 8 The Marcellus Shale is the largest producing gas field in North America Barnett Haynesville Marcellus Sources: LCI Energy Insight gross withdrawal estimates as of January 2013 and converted to dry gas estimates with EIA-calculated average gross-to-dry shrinkage factors by state and/or shale play. Woodford Eagle Ford Bakken |
|
|
Commitment to Resource Plays 9 Capital investments and acquisitions in resource plays since 2004 are driving strong, long-term volume growth. |
|
|
2013 Forecasted Segment Operating Income 2013 Segment Forecasted Operating Income 2013 Forecasted Segment Operating Income Northeast Liberty Utica Southwest 2013 Forecasted Segment Operating Income 2013 Operating Income by Segment |
|
|
Southwest Segment 11 Key Considerations We maintain best-in-class midstream services in the Granite Wash, Haynesville, Woodford and Eagle Ford Shales Recently expanded position in Granite Wash through $245 million acquisition East Texas system overlays the rich Haynesville core and we recently completed a 120 MMcf/d processing expansion 2013 Forecasted Segment Operating Income Areas of Operation Oklahoma, Texas, and New Mexico Resource Plays Granite Wash, Haynesville Shale, Woodford Shale, Eagle Ford Shale, Cotton Valley, Travis Peak, Petitt, Permian Basin Gathering 1.6 Bcf/d capacity Fractionation 29,000 Bbl/d capacity Processing 817 MMcf/d capacity Transportation 1.5 Bcf/d transmission capacity Under Construction Processing 200 MMcf/d processing facility in Granite Wash 120 MMcf/d processing facility in Woodford Shale with Centrahoma Joint Venture |

|
|
Granite Wash: Expanding our Presence Chesapeake Indian Corn Gathering & Treating Dedicated to MarkWest Chesapeake Briscoe Gathering & Processing Dedicated to MarkWest MarkWest’s Foss Lake and Grimes Gathering Arapahoe Processing MarkWest’s Stiles System Chesapeake Texas and Oklahoma Granite Wash Dedicated to MarkWest for Processing Buffalo Creek Processing Plant MarkWest recently acquired midstream assets in Western Oklahoma and the Texas Panhandle from a subsidiary of Chesapeake Energy for $245 million in cash and completed long-term, fee-based agreements for gathering and processing As part of the processing agreement, Chesapeake has dedicated 130,000 acres to MarkWest throughout the Granite Wash 12 |

|
|
Eagle Ford: Developing a Foothold MarkWest is Expanding into the Highly Prolific Eagle Ford Shale 13 MarkWest has executed long-term fee-based agreements with Newfield to acquire and develop a gathering system in Dimmit County, Texas The gathering system supports Newfield’s West Asherton project, an area of 19,000 acres of leasehold focused on the Maverick Basin West Asherton currently includes 28 operating wells and in 2013 Newfield plans to drill 35 additional wells utilizing a two rig program MarkWest will invest approximately $50 million to support Newfield's development plans for 100 gross drilling locations |
|
|
Liberty Segment 14 2013 Forecasted Segment Operating Income Key Considerations We are the largest processor of natural gas and fractionator of natural gas liquids in the Marcellus Shale Operate fully integrated gathering, processing, fractionation, storage and marketing operations Areas of Operation Southwest and Northwest Pennsylvania and northern West Virginia Resource Plays Marcellus Shale Gathering 855 MMcf/d capacity Processing 1.6 Bcf/d cryogenic capacity Fractionation 60,000 Bbl/d C3+ capacity NGL Marketing & Storage NGL Marketing by truck and 200 railcar facility 90,000 Bbl NGL storage capacity with access to 900,000 Bbls of propane storage Under Construction Processing 1.7 Bcf/d cryogenic capacity Fractionation 115,000 Bbl/d de-ethanization capacity NGL Transportation Extensive NGL gathering system with access to purity ethane projects |

|
|
MarkWest Liberty: Current Processing Capacity of 1.6 Bcf/d 15 Sarsen Bluestone I Majorsville I-III Houston I-III Mobley I, II Sherwood I, II Majorsville V Mobley III Sherwood III Bluestone II, III Majorsville IV, VI Sherwood IV 2014 2013 Current Growing to over 3 Bcf/d of processing capacity in the Marcellus Shale by the end of 2014 TEPPCO PRODUCTS PIPELINE SUNOCO PIPELINE EPD ATEX EXPRESS PIPELINE Mariner West De - ethanization I Houston I, II, III, IV De - ethanization I, II Majorsville I, II, III, IV, V, VI Keystone Sherwood I, II, III, IV Mobley I, II, III Hopedale Fractionation & marketing facilities Mariner East |
|
|
Utica Segment 16 Key Considerations We are developing a leading position in the southern core of the highly prospective Utica Shale We have partnered with The Energy & Minerals Group (EMG) to develop fully integrated gathering, processing, fractionation, storage and marketing operations 2013 Forecasted Segment Operating Income Areas of Operation Eastern Ohio Resource Plays Utica Shale Gathering 185 MMcf/d capacity Processing 185 MMcf/d capacity Under Construction Processing 800 MMcf/d cryogenic capacity 200 MMcf/d at Cadiz Complex 600 MMcf/d at Seneca Complex Fractionation 100,000 Bbl/d C2+ capacity NGL Transportation Extensive NGL gathering system, interconnects to TEPPCO and ATEX pipelines Marketing Large scale rail and truck loading in Harrison County, Ohio |

|
|
Utica Development Timeline 17 MarkWest Utica EMG joint venture is formed Agreement executed with Rex Energy June 2012 January 2012 Agreement executed with Antero Resources Cadiz Interim Refrigeration plant is completed in Harrison County 4 Construction begins on the Seneca complex in Noble County 3 November 2012 Construction begins on the Cadiz complex in Harrison County 1 April 2012 February 2013 November 2012 1 2 4 Agreement executed with Gulfport Energy 2 December 2012 3 5 EMG increases its initial capital investment in the Utica Joint Venture from $500 million to $950 million February 2013 Agreement executed with PDC Energy March 2013 The 125 MMcf/d Cadiz I plant is completed in Harrison County5 May 2013 Agreements executed with CNX & an Additional Producer May 2013 |

|
|
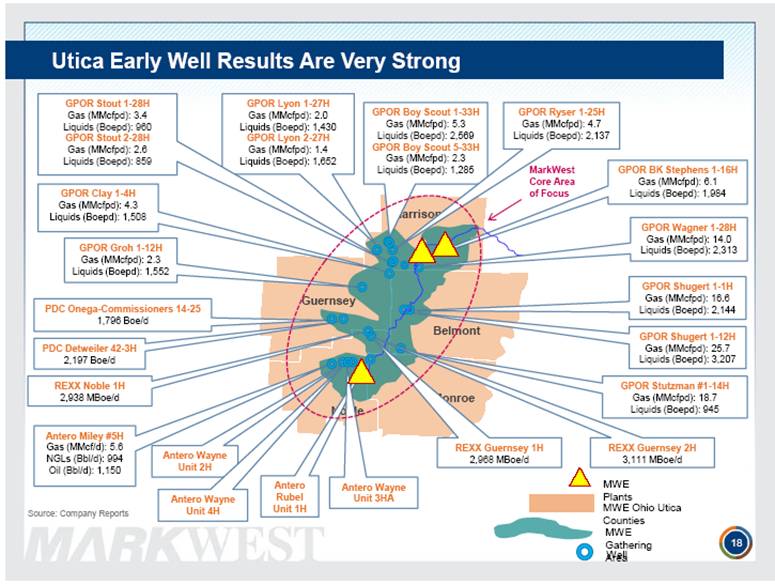
Belmont Guernsey Harrison Monroe Noble MWE Ohio Utica Counties MWE Plants Utica Early Well Results Are Very Strong MWE Gathering Area 18 Well Antero Wayne Unit 2H Antero Miley #5H Gas (MMcf/d): 5.6 NGLs (Bbl/d): 994 Oil (Bbl/d): 1,150 PDC Onega-Commissioners 14-25 1,796 Boe/d PDC Detweiler 42-3H 2,197 Boe/d GPOR Groh 1-12H Gas (MMcfpd): 2.3 Liquids (Boepd): 1,552 GPOR Stutzman #1-14H Gas (MMcfpd): 18.7 Liquids (Boepd): 945 GPOR Shugert 1-12H Gas (MMcfpd): 25.7 Liquids (Boepd): 3,207 GPOR Shugert 1-1H Gas (MMcfpd): 16.6 Liquids (Boepd): 2,144 GPOR BK Stephens 1-16H Gas (MMcfpd): 6.1 Liquids (Boepd): 1,984 GPOR Clay 1-4H Gas (MMcfpd): 4.3 Liquids (Boepd): 1,508 GPOR Boy Scout 1-33H Gas (MMcfpd): 5.3 Liquids (Boepd): 2,569 GPOR Boy Scout 5-33H Gas (MMcfpd): 2.3 Liquids (Boepd): 1,285 GPOR Wagner 1-28H Gas (MMcfpd): 14.0 Liquids (Boepd): 2,313 Antero Wayne Unit 4H Antero Rubel Unit 1H Antero Wayne Unit 3HA GPOR Ryser 1-25H Gas (MMcfpd): 4.7 Liquids (Boepd): 2,137 REXX Guernsey 1H 2,968 MBoe/d REXX Guernsey 2H 3,111 MBoe/d REXX Noble 1H 2,938 MBoe/d GPOR Lyon 1-27H Gas (MMcfpd): 2.0 Liquids (Boepd): 1,430 GPOR Lyon 2-27H Gas (MMcfpd): 1.4 Liquids (Boepd): 1,652 GPOR Stout 1-28H Gas (MMcfpd): 3.4 Liquids (Boepd): 960 GPOR Stout 2-28H Gas (MMcfpd): 2.6 Liquids (Boepd): 859 Source: Company Reports MarkWest Core Area of Focus |
|
|
Utica Processing Capacity 19 Cadiz Refrigeration & Cadiz I Seneca I, II Cadiz II Seneca III 2014 2013 Current Growing to over 900 MMcf/d in the Utica Shale by the end of 2014 Mobley Sherwood Houston Majorsville Seneca I, II, III Hopedale Fractionator TEPPCO PRODUCTS PIPELINE EPD ATEX EXPRESS PIPELINE Keystone INTERCONNECT TO 3 RD PARTY PIPELINE Cadiz I, II and De - ethanization SUNOCO PIPELINE |
|
|
Barbour Brooke Doddridge Gilmer Hancock Harrison Lewis Marion Marshall Monongalia Ohio Pleasants Preston Ritchie Taylor Tyler Wetzel Wood Athens Belmont Carroll Columbiana Coshocton Guernsey Harrison Holmes Mahoning Medina Monroe Morgan Muskingum Noble Perry Portage Stark Summit Trumbull Tuscarawas Washington Wayne Allegheny Armstrong Beaver Butler Clarion Crawford Fayette Greene Lawrence Mercer Venango Washington Westmoreland West Virginia Ohio MWE Utica Counties MWE Marcellus Counties MWE Plants ATEX Express Pipeline TEPPCO Product Pipeline Jefferson Marcellus and Utica: 15 Majors Projects Complete Mariner Projects Rich Utica Rich Marcellus MWE Gathering Area 20 MWE NGL Pipelines MOBLEY COMPLEX Mobley I & II – 320 MMcf/d – Complete Mobley III – 200 MMcf/d – 4Q13 HOUSTON COMPLEX Houston I, II & III – 355 MMcf/d – Complete Houston IV – 200 MMcf/d – 2015 C3+ Fractionation – 60,000 Bbl/d – Complete De-ethanization I – 38,000 Bbl/d – 3Q13 SHERWOOD COMPLEX Sherwood I & II – 400 MMcf/d – Complete Sherwood III – 200 MMcf/d – 4Q13 Sherwood IV – 200 MMcf/d – 2Q14 HOPEDALE FRACTIONATOR C3+ Fractionation – 60,000 Bbl/d – 1Q14 CADIZ COMPLEX Cadiz I & Refrig – 185 MMcf/d – Complete Cadiz II – 200 MMcf/d – 2Q14 De-ethanization – 40,000 Bbl/d – 1Q14 KEYSTONE COMPLEX Bluestone I & Sarsen I – 90 MMcf/d – Complete Bluestone II – 120 MMcf/d – 2Q14 Bluestone III – 200 MMcf/d – TBD SENECA COMPLEX Seneca I – 200 MMcf/d – 4Q13 Seneca II – 200 MMcf/d – 4Q13 Seneca III – 200 MMcf/d – 2Q14 MAJORSVILLE COMPLEX Majorsville I - III – 470 MMcf/d – Complete Majorsville IV – 200 MMcf/d – 1Q14 Majorsville V – 200 MMcf/d – 4Q13 Majorsville VI – 200 MMcf/d – 2014 De-ethanization I – 38,000 Bbl/d – 4Q13 De-ethanization II – 38,000 Bbl/d – 1Q14 18 Major projects under construction |
|
|
DCF and Capital Investments 21 21 2013 Capital Expenditure Forecast DCF Growth ($ millions) 35% CAGR 2013 DCF Forecast of $500 million to $540 million 2013 Capital Expenditures Forecast of $1.5 to $1.8 billion DCF has grown at a CAGR of 35% since 2004 and has increased by over 1,000% in the same time period 21 |
|
|
The Partnership is well positioned to fund its ongoing capital growth plans and currently has approximately $1.4 billion of liquidity Capital Markets and Liquidity Update 22 In January 2013, the Partnership successfully completed a $1 billion senior unsecured notes offering at 4.5% due in 2023, the lowest coupon issued for the Partnership In February 2013, the Partnership completed an amended LLC agreement for the MarkWest Utica EMG Joint Venture. The transaction provides our joint venture partner, The Energy & Minerals Group, the ability to increase their initial capital investment from $500 million to $950 million The Partnership continues to actively utilize its continuous equity program and through March 31, 2013 has generated cumulative net proceeds of approximately $122 million. The Partnership is currently undrawn on its $1.2 billion credit facility |
|
|
Note: Forecast Assumes Crude Oil ($/bbl) range of $93.60 to $90.80 and Natural Gas ($/mmbtu) range of $3.29 to $4.55 Increasing Fee-Based Margin 23 For the full year 2014, net operating margin is expected to be 70% fee-based |
|
|
Risk Management Program 24 NOTE: Net Operating Margin is calculated as segment revenue less purchased product costs. 2013-2014 Combined Hedge Percentage 2013 Forecast Net Operating Margin by Contract Type 2013 Forecast Net Operating Margin Including Hedges |
|
|
Total Return Since 2009 25 Source: Bloomberg as of 5/17/13 MarkWest Provides Superior Total Return |
|
|
Keys to Success Maintain stronghold in key resource plays with high-quality assets Execute growth projects that are well diversified across the asset base Provide best-in-class midstream services for our producer customers Preserve strong financial profile Deliver superior & sustainable total returns EXECUTE, EXECUTE, EXECUTE!!! 26 |
|
|
APPENDIX |
|
|
Reconciliation of DCF and Distribution Coverage 28 Year Ended Three Months Ended ($ in millions) 12/31/2012 3/31/2013 Net Income $ 218.8 $ (20.8) Depreciation, amortization, impairment, and other non-cash operating expenses 250.1 85.0 Loss on redemption of debt, net of tax benefit - 36.2 Amortization of deferred financing costs and discount 5.6 1.8 Non-cash loss from unconsolidated affiliates (0.7) 0.1 Distributions from unconsolidated affiliates 2.6 - Non-cash compensation expense 8.2 2.4 Non-cash derivative activity (102.1) (9.0) Provision for income tax – deferred 40.7 12.0 Cash adjustment for non-controlling interest of consolidated subsidiaries (2.6) 0.6 Revenue deferral adjustment 7.4 1.8 Other 3.6 2.0 Maintenance capital expenditures, net of joint venture partner contributions (15.2) (1.9) Distributable cash flow (DCF) $ 416.4 $ 110.2 Total distributions declared for the period 370.3 108.4 Distribution coverage ratio (DCF / Total distributions declared) 1.12x 1.02x |
|
|
Reconciliation of Adjusted EBITDA 29 Year Ended Year Ended LTM Ended ($ in millions) 12/31/2011 12/31/2012 3/31/2013 Net income (loss) $ 106.2 $ 218.8 $ 181.8 Non-cash compensation expense 3.4 8.2 7.9 Non-cash derivative activity (0.3) (102.1) (159.4) Interest expense (1) 109.9 117.1 126.6 Depreciation, amortization, impairments, and other non-cash operating expenses 203.9 250.1 281.7 Loss on redemption of debt 79.0 - 38.5 Provision for income tax 13.7 38.3 40.3 Adjustment for cash flow from unconsolidated affiliate 1.3 1.9 1.1 Other (1.8) (4.1) (3.6) Adjusted EBITDA $ 515.3 $ 528.2 $ 514.9 (1) Includes derivative activity related to interest expense, amortization of deferred financing costs and discount, and excludes interest expense related to the Steam Methane Reformer. |
|
|
Reconciliation of Net Operating Margin 30 Year ended Three months ended ($ in millions) 12/31/2012 3/31/2013 Income from operations $ 381.7 $ 64.4 Facility expense 208.4 59.8 Derivative activity (69.1) (10.9) Revenue deferral adjustment 7.4 1.8 Selling, general and administrative expenses 94.1 25.4 Depreciation 189.5 69.6 Amortization of intangible assets 53.3 14.8 Loss on disposal of property, plant, and equipment 6.3 0.1 Accretion of asset retirement obligations 0.7 0.3 Net operating margin $ 872.3 $ 225.3 |
|
|
1515 Arapahoe Street Tower 1, Suite 1600 Denver, Colorado 80202 Phone: 303-925-9200 Investor Relations: 866-858-0482 Email: investorrelations@markwest.com Website: www.markwest.com |