Attached files
| file | filename |
|---|---|
| 8-K - 8-K - Silver Bay Realty Trust Corp. | a13-12259_18k.htm |
| EX-99.1 - EX-99.1 - Silver Bay Realty Trust Corp. | a13-12259_1ex99d1.htm |
Exhibit 99.2
|
|
SILVER BAY REALTY TRUST CORP. First Quarter 2013 Earnings Presentation |

|
|
SAFE HARBOR STATEMENT FORWARD-LOOKING STATEMENTS This presentation includes “forward-looking statements” within the meaning of the safe harbor provisions of the United States Private Securities Litigation Reform Act of 1995. Actual results may differ from expectations, estimates and projections and, consequently, readers should not rely on these forward-looking statements as predictions of future events. Words such as “expect,” “target,” “assume,” “estimate,” “project,” “budget,” “forecast,” “anticipate,” “intend,” “plan,” “may,” “will,” “could,” “should,” “believe,” “predicts,” “potential,” “continue,” and similar expressions are intended to identify such forward-looking statements. These forward looking statements involve significant risks and uncertainties that could cause actual results to differ materially from expected results. Factors that could cause actual results to differ include: adverse economic or real estate developments in Silver Bay’s target markets; defaults on, early terminations of or non-renewal of leases by residents; difficulties in identifying properties to acquire and completing acquisitions; increased time and/or expense to gain possession and renovate properties; Silver Bay’s failure to successfully operate acquired properties; the Company’s ability to obtain financing arrangements; Silver Bay’s failure to meet the conditions to draw under the credit facility; general volatility of the markets in which we participate; interest rates and the market value of Silver Bay’s target assets; the impact of changes in governmental regulations, tax law and rates, and similar matters. Readers are cautioned place undue reliance upon any forward-statements made Bay does undertake or accept any updates or not to forward looking statements, which speak only as of the date made. Silver not obligation to release publicly any revisions to any forward-looking statement to reflect any change in its expectations or any change in events, conditions or circumstances on which any such statement is based. Additional information concerning these and other risk factors is contained in Silver Bay’s most recent filings with the Securities and Exchange Commission. All subsequent written and oral forward looking statements concerning Silver Bay or matters attributable to Silver Bay or any person acting on its behalf are expressly qualified in their entirety by the cautionary statements above. 2 |

|
|
FIRST QUARTER 2013 HIGHLIGHTS Acquired more than 1,200 single-family properties during the first quarter Owned portfolio of ~4,600 single-family properties located in fourteen markets across eight states as of March 31, 2013. Portfolio exceeded 5,000 properties as of April 30, 2013. Entered into a $200 million revolving credit facility on May 10 to further pursue acquisition and renovation strategy Substantial progress in building out operational capability Leased 810 properties during the first quarter(1) Executing strategy to build infrastructure with capacity to support larger portfolio (1) Total number of leased properties include properties purchased in transactions with resident leases in place. |

|
|
CURRENT HOUSING MARKET ENVIRONMENT . Silver Bay thesis remains intact as housing market recovery continues MSA HOME PRICE APPRECIATION (“HPA”)(1) - National pricing up 11% year over year - Highly attractive environment to acquire in select markets . Housing and rental market dynamics continue to be favorable SOURCE: CORELOGIC AS OF MARCH 31, 2013 MARKET HPA (Peak to Trough)(2) HPA (Peak to Current) HPA (Prior 12 months) HPA (Prior 3 months) AZ -53% -39% 19% 3% - Sales of distressed properties remain robust - Supply remains constrained, both in ‘for sale’ and rental markets - Demand for single family rental properties remains strong, overall housing purchase demand is growing Phoenix, Tucson, AZ -43% -37% 8% 1% Northern CA(3) -60% -53% 16% 4% Southern CA(4) -54% -45% 15% 4% Improved macroeconomic environment Increased household formations - Credit remains tight Jacksonville, FL -41% -36% 4% -1% Orlando, FL -56% -46% 12% 2% Southeast FL(5) -54% -46% 9% 2% High levels of negative homeowner equity Low levels of consumer savings Higher lending standards . Rents trending upwards, though not at the same magnitude as home prices Tampa, FL -48% -42% 8% 3% Atlanta, GA -34% -24% 14% 3% Charlotte, NC -17% -10% 7% 3% Las Vegas, NV -60% -51% 21% 7% Columbus, OH -19% -17% -% -4% Dallas, TX -15% -6% 8% 3% Houston, TX -14% -4% 8% 1% 4 (1) “MSA” means Metropolitan Statistical Areas, which is generally defined as one or more adjacent counties or county equivalents that have at least one urban core area of at least a 50,000-person population, plus adjacent territory that has a high degree of social and economic integration with the core as measured by commuting ties. (2) Peak refers to highest historical home prices in a particular market. Trough refers to lowest home prices in a particular market since the peak. (3) MSA used for Northern California is Fairfield-Vallejo, which most closely approximates the geographic area in which we purchase homes in Northern California. This MSA is comprised of Solano County and the most populous cities in the MSA are Vallejo, Fairfield, Vacaville, Suisun and Benicia. (4) MSA used for Southern California is Riverside-San Bernardino-Ontario. This MSA is comprised of Riverside and San Bernardino Counties and the most populous cities in the MSA are Riverside, San Bernardino, Fontana and Moreno. (5) MSA used for Southeast FL is Fort Lauderdale-Pompano Beach-Deerfield Beach, FL. NATIONAL -33% -25% 11% 2% |
|
|
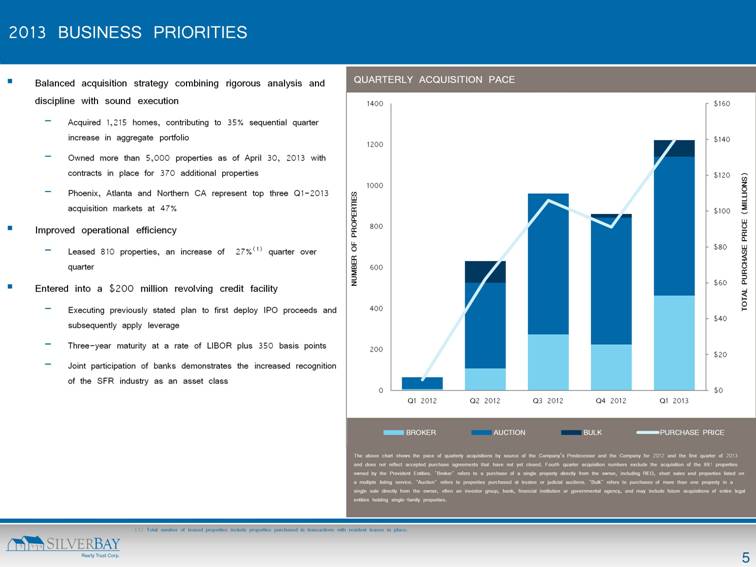
2013 BUSINESS PRIORITIES Balanced acquisition strategy combining rigorous analysis and discipline with sound execution Acquired 1,215 homes, contributing to 35% sequential quarter increase in aggregate portfolio Owned more than 5,000 properties as of April 30, 2013 with contracts in place for 370 additional properties Phoenix, Atlanta and Northern CA represent top three Q1-2013 acquisition markets at 47% Improved operational efficiency Leased 810 properties, an increase of 27%(1) quarter over quarter Entered into a $200 million revolving credit facility Executing previously stated plan to first deploy IPO proceeds and subsequently apply leverage Three-year maturity at a rate of LIBOR plus 350 basis points Joint participation of banks demonstrates the increased recognition of the SFR industry as an asset class QUARTERLY ACQUISITION PACE The above chart shows the pace of quarterly acquisitions by source of the Company’s Predecessor and the Company for 2012 and the first quarter of 2013 and does not reflect accepted purchase agreements that have not yet closed. Fourth quarter acquisition numbers exclude the acquisition of the 881 properties owned by the Provident Entities. "Broker" refers to a purchase of a single property directly from the owner, including REO, short sales and properties listed on a multiple listing service. "Auction" refers to properties purchased at trustee or judicial auctions. "Bulk" refers to purchases of more than one property in a single sale directly from the owner, often an investor group, bank, financial institution or governmental agency, and may include future acquisitions of entire legal entities holding single-family properties. (1) Total number of leased properties include properties purchased in transactions with resident leases in place. |
|
|
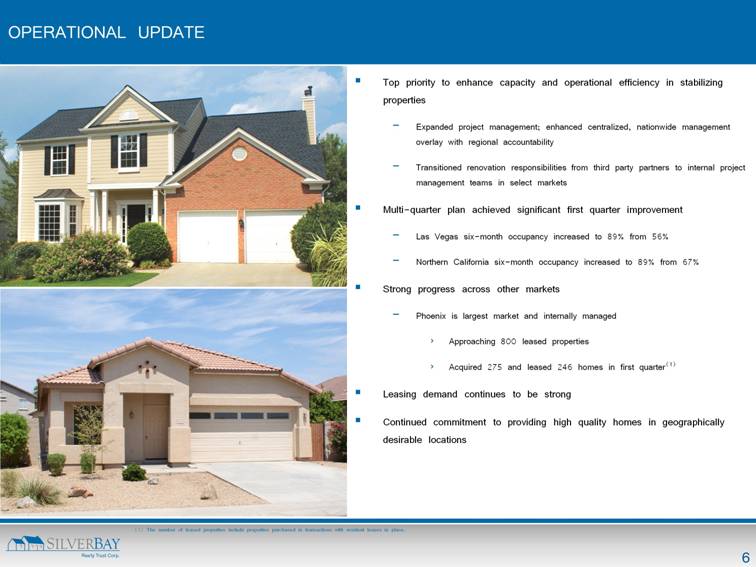
OPERATIONAL UPDATE Top priority to enhance capacity and operational efficiency in stabilizing properties Expanded project management; enhanced centralized, nationwide management overlay with regional accountability Transitioned renovation responsibilities from third party partners to internal project management teams in select markets Multi-quarter plan achieved significant first quarter improvement Las Vegas six-month occupancy increased to 89% from 56% Northern California six-month occupancy increased to 89% from 67% Strong progress across other markets Phoenix is largest market and internally managed Approaching 800 leased properties Acquired 275 and leased 246 homes in first quarter(1) Leasing demand continues to be strong Continued commitment to providing high quality homes in geographically desirable locations (1) The number of leased properties include properties purchased in transactions with resident leases in place. |
|
|
PORTFOLIO OVERVIEW AS OF MARCH 31, 2013 MARKET AGGREGATE PORTFOLIO Total Number of Properties(1) 4,594 Properties Leased 2,413 PROPERTIES BY Charlotte 2% Dallas 2% Columbus 2% Jacksonville 1% Occupancy Rate 53% STABILIZED PROPERTIES h Orlando 3% Southeast FL 2% Houston 1% Number of Stabilized Properties(2) 2,614 Properties Leased 2,413 Phoenix 28% Tucson 4% Southern CA 4% Occupancy Rate 92% PROPERTIES OWNED AT LEAST SIX MONTHS Northern Las Vegas 6% Number of Properties Owned Six Months or Longer 2,522 Properties Leased 2,034 Tampa 20% Atlanta CA 8% 7 Occupancy Rate 81% (1) Total properties exclude properties held for sale by the Company’s taxable REIT subsidiary and any properties acquired in previous periods in sales that have been subsequently rescinded or vacated. (2) The Company considers a property stabilized at the earlier of (a) its first authorized occupancy or (b) 90 days after the renovations for such property are complete. Properties acquired with in-place leases are considered stabilized even though such properties may require future renovation to meet our standards and may have existing residents who would not otherwise meet our resident screening requirements. This definition of “stabilized” differs from the definition used in our Annual Report on Form 10-K for 2012, which did not consider a property as stabilized until leased, regardless of how long such property was available for rent after the completion of renovation. 17% |
|
|
APPENDIX |

|
|
PORTFOLIO OF SINGLE-FAMILY PROPERTIES The following table provides a summary of Silver Bay’s portfolio of single-family properties as of March 31, 2013. MARKET NUMBER OF PROPERTIES(1) AGGREGATE COST BASIS(2) (THOUSANDS) AVERAGE COST BASIS PER PROPERTY (THOUSANDS) AVERAGE AGE (IN YEARS)(3) AVERAGE SQUARE FOOTAGE NUMBER OF LEASED PROPERTIES NUMBER OF VACANT PROPERTIES(4) AVERAGE MONTHLY RENT FOR LEASED PROPERTIES(5) Phoenix 1,276 $ 166,636 $ 131 22.8 1,661 789 487 $ 1,043 Tampa 897 125 111,902 23.4 1,662 1,258 Atlanta 785 90,848 116 16.6 2,046 409 376 1,192 Northern CA(6) 372 64,022 172 44.9 1,375 232 140 1,449 Las Vegas 277 36,683 132 15.8 1,713 172 105 1,163 Tucson 202 15,333 76 40.0 1,336 161 41 835 CA(7) Southern 161 20,058 125 43.0 1,351 54 107 1,141 Orlando 134 18,649 139 23.1 1,744 89 45 1,291 Southeast FL(8) 115 18,159 158 32.5 1,744 - 115 - Charlotte 102 12,369 121 11.4 1,994 29 73 1,155 Dallas 95 9,528 100 23.0 1,713 15 80 1,168 Columbus 94 7,769 83 33.6 1,496 - 94 - Jacksonville 51 4,558 89 35.5 1,487 6 45 944 Houston 33 2,694 82 31.0 1,760 - 33 - Totals 4,594 $ 579,208 $ 126 25.1 1,690 2,413 2,181 $ 1,156 (1) Total properties exclude properties held for sale by the Company’s taxable REIT subsidiary and any properties acquired in previous periods in sales that have been subsequently rescinded or vacated. (2) Aggregate cost includes all capitalized costs, determined in accordance with generally accepted accounting principles, incurred through March 31, 2013 for the acquisition, stabilization, and significant post-stabilization renovation of properties, including land, building, possession costs and renovation costs. Aggregate cost does not include accumulated depreciation. (3) As of March 31, 2013, approximately 20% of the properties in the combined portfolio were less than 10 years old, 27% were between 10 and 20 years old, 17% were between 20 and 30 years old, 17% were between 30 and 40 years old, 8% were between 40 and 50 years old, and 11% were more than 50 years old. (4) Total number of vacant properties includes properties in the process of stabilization as well as those available for lease. (5) Average monthly rent for leased properties was calculated as the average of the contracted monthly rent for all leased properties as of March 31, 2013 and reflects rent concessions amortized over the life of the related lease. (6) Northern California market currently consists of Contra Costa, Napa, Sacramento and Solano counties. 9 (7) Southern California market currently consists of Riverside and San Bernardino counties. (8) Southeast Florida market currently consists of Miami Dade, Broward and Palm Beach counties. |

|
|
PORTFOLIO SUMMARY OF STABILIZED PROPERTIES AND THOSE OWNED SIX MONTHS OR LONGER The following table summarizes Silver Bay’s stabilized properties and those owned six months or longer as of March 31, 2013. STABILIZED PROPERTIES PROPERTIES OWNED AT LEAST SIX MONTHS NUMBER OF STABILIZED AVERAGE MONTHLY RENT FOR LEASED STABILIZED PROPERTIES OWNED 6 MONTHS OR AVERAGE MONTHLY RENT FOR PROPERTIES OWNED AT LEAST 6 MARKET PROPERTIES(1) PROPERTIES LEASED PROPERTIES VACANT OCCUPANCY RATE PROPERTIES(2) LONGER PROPERTIES LEASED PROPERTIES VACANT OCCUPANCY RATE MONTHS(3) Phoenix 878 789 89 90% $ 1,043 786 685 101 87% $ 1,045 Tampa 495 457 38 92% 1,258 623 440 183 71% 1,259 Atlanta 454 409 45 90% 1,192 435 352 83 81% 1,191 Northern CA 250 232 18 93% 1,449 167 149 18 89% 1,562 174 172 2 99% 1,163 160 143 17 89% 1,156 Las Vegas Tucson 163 161 2 99% 835 151 144 7 95% 835 Southern CA 56 54 2 96% 1,141 111 35 76 32% 1,212 Orlando 89 89 - 100% 1,291 78 78 - 100% 1,313 Southeast FL(4)(5) - - - - - - - - - - Charlotte 34 29 5 85% 1,155 11 8 3 73% 1,116 Dallas(5) 15 15 - 100% 1,168 - - - - - Columbus(4)(5) - - - - - - - - - - Jacksonville(5) 6 6 - 100% 944 - - - - - Houston(4)(5) - - - - - - - - - - Totals 2,614 2,413 201 92% $ 1,156 2,522 2,034 488 81% $ 1,161 (1) The Company considers a property stabilized at the earlier of (a) its first authorized occupancy or (b) 90 days after the renovations for such property are complete. Properties acquired with in-place leases are considered stabilized even though such properties may require future renovation to meet our standards and may have existing residents who would not otherwise meet our resident screening requirements. This definition of “stabilized” differs from the definition used in our Annual Report on Form 10-K for 2012, which did not consider a property as stabilized until leased, regardless of how long such property was available for rent after the completion of renovation. (2) Average monthly rent for leased stabilized properties was calculated as the average of the contracted monthly rent for all stabilized leased properties as of March 31, 2013 and reflects rent concessions amortized over the life of the related lease. (3) Average monthly rent for properties owned at least six months was calculated as the average of the contracted monthly rent for all properties owned at least six months as of March 31, 2013 and reflects rent concessions amortized over the life of the related lease. (4) As of March 31, 2013, there were no stabilized properties in this market. (5) As of March 31, 2013, there were no properties owned six months or longer in this market. |

|
|
601 CARLSON PARKWAY | SUITE 250 | MINNETONKA | MN | 55305 P: 952.358.4400 | E: INVESTORS@SILVERBAYMGMT.COM |
