Attached files
| file | filename |
|---|---|
| EX-99.1 - PRESENTATION MATERIALS FOR INDIVIDUAL INVESTOR MEETINGS. - PROASSURANCE CORP | exhibitone.htm |
| 8-K - FILING TO DISCLOSE PRESENTATION MATERIALS. - PROASSURANCE CORP | bodyoffiling.htm |

May 14, 2013
2013 Securities Research Conference
2013 Securities Research Conference
Edward L. Rand, Jr. Chief Financial Officer
Frank B. O’Neil Investor Relations Officer
Investor Meetings
Investor Meetings

This presentation contains Forward Looking Statements and other information designed to convey
our projections and expectations regarding future results. There are a number of factors which
could cause our actual results to vary materially from those projected in this presentation. The
principal risk factors that may cause these differences are described in various documents we file
with the Securities and Exchange Commission, such as our Current Reports on Form 8-K, and our
regular reports on Forms 10-Q and 10-K, particularly in “Item 1A, Risk Factors.” Please review
this presentation in conjunction with a thorough reading and understanding of these risk factors.
We especially identify statements concerning our transactions involving Medmarc Insurance
Company and Independent Nevada Doctors Insurance Company as Forward Looking Statements
and direct your attention to our news releases issued on June 27, 2012, our Current Report on Form
8K, issued on June 28, 2012 and our 10K, filed on February 19, 2013 for a discussion of
risk factors pertaining to these transactions and subsequent integration into ProAssurance.
This presentation contains Non-GAAP measures, and we may reference Non-GAAP measures in
our remarks and discussions. A reconciliation of these measures to GAAP measures is available in
our latest quarterly news release, which is available in the Investor Relations section of our website,
www.ProAssurance.com, and in the related Current Report on Form 8K disclosing that release.
our remarks and discussions. A reconciliation of these measures to GAAP measures is available in
our latest quarterly news release, which is available in the Investor Relations section of our website,
www.ProAssurance.com, and in the related Current Report on Form 8K disclosing that release.
FORWARD LOOKING STATEMENTS
NON-GAAP MEASURES

Q1 2013 Highlights
Increased Net and Operating Income Y-O-Y
ROE of 13.4%
Book Value per share now $38.19
4% increase since year-end 2012
Book Value per Share has grown each year since
1991
1991
Shareholder’s Equity and Total Assets at record
levels
levels
Recent transactions contributing to our results
with integration proceeding as planned
with integration proceeding as planned
3

ProAssurance Corporate Profile
Specialty liability insurance writer
Healthcare Professional Liability (HCPL)
Only “pure play” public company writing predominately HCPL
Life sciences and medical devices
Attorney’s professional liability
Market Cap: ~$3.0 billion
Shareholders’ Equity: $2.4 billion
Total Assets: $5.3 billion
Claims-Paying Ratings: “A” by Fitch and A. M. Best
Ratings affirmed by Fitch on May 1st
Debt ratings recently upgraded by Moody’s
4

ProAssurance Business Profile
HCPL Distribution is Independent Agent (64%) / Direct (36%)
Direct in Alabama, Florida and in all states for Podiatric business
Dual distribution in DC, Texas and parts of Missouri
LPL and Life Sciences is 100% broker / agent
Legal Professional is direct in Georgia / MGAs used in other states
Q1 2013 Policyholders: ~64,600
Q1 2013 Premium: $163.2 mln
March 31, 2013
Includes Acquisitions
Includes Acquisitions
Tail Premium Allocated by Line
5
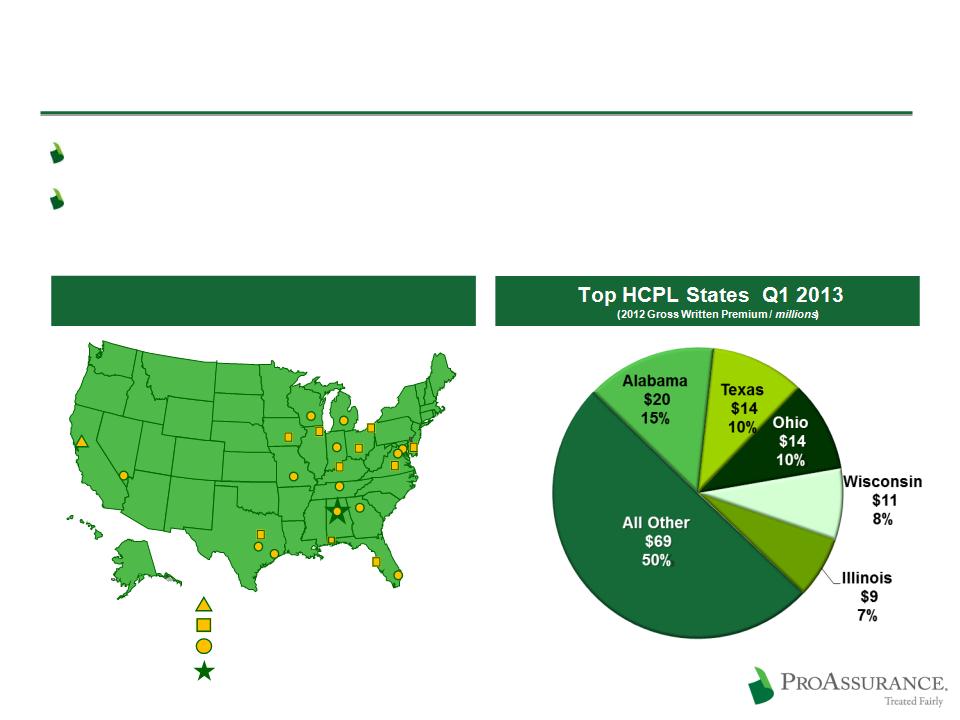
ProAssurance Geographic Profile
Broad geographic diversification
Locally-based decision-making differentiates ProAssurance by
addressing each state’s unique medical/legal challenges
addressing each state’s unique medical/legal challenges
ProAssurance Footprint / All Lines
(Birmingham)
Corporate Headquarters
Corporate Headquarters
Claims Offices
Claims Offices
Claims / Underwriting Offices
Claims / Underwriting Offices
Underwriting Offices
Underwriting Offices
6

Seeking Increased Yield But Balancing Risk
We continue to focus on
maintaining a high quality, well
diversified fixed income
portfolio
maintaining a high quality, well
diversified fixed income
portfolio
We are making incremental
changes to obtain higher yields
in blue chip investments
changes to obtain higher yields
in blue chip investments
$4.3 Billion
Portfolio
Portfolio
$4.3 Billion
Portfolio
Portfolio
Fixed Income:
84%
84%
Fixed Income:
84%
84%
Short Term: 2%
Short Term: 2%
Equity and Equity Substitutes: 12%
Equity and Equity Substitutes: 12%
BOLI: 1%
BOLI: 1%
3/31/13
7

Management is Experienced & Invested
Effective senior management remains in place—14 years average tenure
Average ProAssurance tenure through the VP level is 16 years, with an average of 26 years
industry experience
industry experience
Management and employees are invested, owning ~5.6 % of ProAssurance stock
|
W. Stancil Starnes, JD
Chairman & Chief Executive Officer
Company Tenure: 6 Years
Prior MPL Experience: 29 Years
Total Industry & Related Experience: 35 Years
Formerly in the private practice of law in MPL defense and
complex corporate litigation |
Victor T. Adamo, JD, CPCU
Vice-Chairman
Company Tenure: 28 Years
Prior MPL Experience: 5 Years
Total Industry & Related Experience: 33 Years
Formerly in the private practice of corporate law. President of
Professionals Group prior to formation of ProAssurance |
Ross E. Taubman, DPM
President of PICA
Company Tenure: 2 Year
Prior MPL Experience: -
Total Industry & Related Experience: 28 Years
Formerly in the private practice of podiatry. Leader in
organized podiatric medicine; former president and Trustee of the American Podiatric Medical Association |
|
Jeffrey L. Bowlby, ARM
Sr. Vice-President & Chief Marketing Officer
Company Tenure: 15 Years
Prior MPL Experience: -
Total Industry & Related Experience: 29 Years
Career-long experience in insurance sales and marketing,
most recently as SVP for Marketing with Meadowbrook |
Howard H. Friedman, ACAS
Sr. Vice-President & Chief Underwriting Officer
Company Tenure: 17 Years
Prior MPL Experience: 16 Years
Total Industry & Related Experience: 33 Years
Career-long experience in MPL company operations
and management. Former ProAssurance CFO. |
Jeffrey P. Lisenby, JD
Sr. Vice-President, General Counsel & Secretary
Company Tenure: 12 Years
Prior MPL Experience: -
Total Industry & Related Experience: 12 Years
Formerly in the private practice of law
|
|
Duncan Y. Manley
Vice-President, Operations and Information Systems
Company Tenure: 13 Years
Prior MPL Experience: 7 Years
Total Industry & Related Experience: 20 Years
Career-long experience in MPL company operations as an
executive and consultant. |
Frank B. O’Neil
Sr. Vice-President & Chief Communications Officer
Company Tenure: 26 Years
Prior MPL Experience: -
Total Industry & Related Experience: 26 Years
Formerly a television news executive and anchor
|
Edward L. Rand, Jr., CPA
Sr. Vice-President & Chief Financial Officer
Company Tenure: 8 Years
Prior MPL Experience: -
Total Industry & Related Experience: 20 Years
Career-long experience in insurance finance and accounting.
Most recently Chief Accounting Officer for Partner Re |
|
Darryl K. Thomas, JD
Sr. Vice-President & Chief Claims Officer
Company Tenure: 18 Years
Prior MPL Experience: 10 Years
Total Industry & Related Experience: 28 Years
Career-long experience in MPL claims management
|
Hayes V. Whiteside, MD, FACS
Sr. Vice-President & Chief Medical Officer
Company Tenure: 9 Years
Prior MPL Experience: -
Total Industry & Related Experience: 29 Years
Formerly in the private practice of Urology
|
Mary Todd Peterson
President & CEO of Medmarc
Company Tenure: 12 Years
Prior Industry Experience: 14 Years
Total Industry & Related Experience: 26 Years
Former Partner with Johnson Lambert and VP Finance &
Controller with Acacia |
8

Our Commitment to Treated Fairly
Unwavering dedication to the defense of
non-meritorious lawsuits
non-meritorious lawsuits
Allows our insureds the right to an unfettered defense of
their claims where permitted by law
their claims where permitted by law
Steadfast dedication to in-depth underwriting and
adequate pricing
adequate pricing
An unsurpassed level of customer service
Unquestioned financial strength consistently
delivering value for insureds and shareholders
delivering value for insureds and shareholders
9

Strategies for Future Success
Our successful experience and deep expertise
uniquely qualify ProAssurance to insure the
widest range of healthcare risks
uniquely qualify ProAssurance to insure the
widest range of healthcare risks

Building a Bridge to the Future
Our core business is at a pivot point
We are uniquely positioned to succeed by serving the
emerging market and remaining legacy business
emerging market and remaining legacy business
Smaller competitors with less experience and capacity
have decisions to make
have decisions to make
11
Legacy business is largely
single-state, solo
and small groups.
A substantial amount of this
business will remain, but
will demand more from
insurers.
single-state, solo
and small groups.
A substantial amount of this
business will remain, but
will demand more from
insurers.
The future will be
dominated by large
groups and institutions,
often multi-disciplinary
and multi-state. They
will demand financial
strength and deep
expertise.
dominated by large
groups and institutions,
often multi-disciplinary
and multi-state. They
will demand financial
strength and deep
expertise.

Building a Bridge to the Future
Larger risks will demand sophisticated
coverages that span the continuum of healthcare
coverages that span the continuum of healthcare
Broad healthcare liability experience is our
foundation
foundation
We added capacity & capability through M&A
Example: Medmarc, PICA and Mid-Continent
Home
Healthcare
Healthcare
Non-Traditional
Delivery Settings
Delivery Settings
Multi-Specialty
Clinics
Clinics
Hospital & Facility
Centered Care
Centered Care
New delivery
devices,
techniques and
research
devices,
techniques and
research
ProAssurance spans the continuum of care
Traditional
Practices
Practices
12
ProAssurance’s Successful M&A
Strategy
Strategy
Consolidation will continue and will remain episodic
Fewer significant targets
Remaining companies of size are in important strategic areas
We prefer “health care centric” but will consider closely related
liability lines
liability lines
Legal/regulatory environment must be favorable
Not all M&A opportunities should be pursued
We do not “bet the company” on any transaction
Soft Market
Hard Market
M & A
de novo
Expansion
Expansion
Internal
Growth
Growth
All avenues
open
because of
pricing
power
open
because of
pricing
power
M & A is
preferable
because of
pricing
pressure
preferable
because of
pricing
pressure
M & A and the Insurance Cycle
13

ProAssurance’s Successful M&A History
Original
Companies
Companies
Purchased Company
Demutualization
OHIC
HOSPITALS ONLY
HOSPITALS ONLY
2
1
1
1
1
1
1
1
1
3
4
4
1
4
Renewal Rights
Assumed Business
2
2
†
2
3
1
3
3
1
SERTA
14

ProAssurance Will Grow Prudently
ProAssurance is a demonstrated leader in M&A
We will broaden our lines of coverage as needed
Healthcare-related
Through prudent leverage of our expertise and the
addition of specialized expertise
addition of specialized expertise
The market will firm and we are prepared to
grow organically
grow organically
Past history teaches us the turn will be sudden and
capital will allow us to respond rapidly
capital will allow us to respond rapidly
15

Strategy for an Evolving Market
Shaped by a healthcare landscape that will
change—with or without federal healthcare
reform
change—with or without federal healthcare
reform
Expanding our capabilities and commitment
across the continuum of healthcare
across the continuum of healthcare
Building on two decades of hospital experience
Recent expansion into products liability for life
sciences and medical devices through M&A
sciences and medical devices through M&A
Enhancing our historical commitment to
individual providers and small groups
individual providers and small groups
16

Strategy for an Evolving Market
Leverage our reach, expertise and financial
strength with larger accounts
strength with larger accounts
Largest non-profit healthcare
system in the US
system in the US
Now in Michigan, Florida,
Illinois, Indiana and Texas
Illinois, Indiana and Texas
Insuring Ascension-affiliated
physicians through coordinated,
jointly insured programs
physicians through coordinated,
jointly insured programs
Financial involvement of both entities creates incentive to reduce risk
*www.ascensionhealth.org/index.php?option=com_locations&view=locations&Itemid=148
Ascension Health’s Ministry Locations*
17

Strategy for an Evolving Market
Joint physician/hospital insurance products to
address the unique risk tolerance and claims-
handling expectation of each insured
address the unique risk tolerance and claims-
handling expectation of each insured
Partnerships with existing physician-focused
companies to leverage hospital expertise
companies to leverage hospital expertise
Recently announced California venture with
CAP-MPT: CAPAssurance
CAP-MPT: CAPAssurance
Alternative risk and self-insurance mechanisms
Captive insurance, risk sharing programs and
Risk Retention Groups for
specific specialties or regions
Risk Retention Groups for
specific specialties or regions
18

Healthcare Reform
No meaningful change after the election
Known: More customers for us
May accelerate the growth of hospital-owned practices and
consolidation into larger groups
consolidation into larger groups
Provides an opportunity for us due to our geographic reach,
long-term experience in hospitals and our financial strength
long-term experience in hospitals and our financial strength
We have enhanced our ability to write new classes of
business through acquisitions
business through acquisitions
May hasten the need for consolidation of smaller insurers
Unknown: Effect on the medical/legal environment
Increased patient frustration with the system
Possibility of more unexpected outcomes
19

Today’s Healthcare Professional Liability Market
ProAssurance delivers an unparalleled level of
service and financial stability that truly
differentiates our coverage and our Company in an
evolving, competitive market
service and financial stability that truly
differentiates our coverage and our Company in an
evolving, competitive market

HCPL Stands Apart in Insurance
HCPL claims may not be filed for years after an
incident and may take years to resolve: Long-tail
incident and may take years to resolve: Long-tail
Personal lines are short tail
Introduces long periods of uncertainty
Loss trends may change expected severity from time of
initial pricing
initial pricing
Can be mitigated by the use of the claims-made policy form
Can provide a false sense of security for start-ups and
companies seeking to aggregate market share based on price
companies seeking to aggregate market share based on price
Float can be meaningful
HCPL claims are almost always lawsuits
High cost to defend, even if you win
21

The HCPL Market Today
Prolonged period of “benign profitability”
Premiums levels remain well above levels of 2000
Significant policyholder retention by all companies
despite fierce competition
despite fierce competition
No large commercial carriers have entered the market
in a meaningful manner
in a meaningful manner
Significant barriers to entry in underwriting and claims
handling
handling
Psychological barriers exist—failures in the past
No catastrophe exposure
22

The HCPL Market Today
23

The HCPL Market Today
Changes in healthcare delivery are changing the
underlying dynamics
underlying dynamics
Physicians are combining into larger groups
Physician practices are being brought into hospitals through
purchase or affiliation
purchase or affiliation
Hospitals are combining into large networks requiring
greater insurance expertise and greater financial security
greater insurance expertise and greater financial security
Larger companies with geographical reach and
financial strength will have an advantage in attracting
new business and continuing to consolidate
financial strength will have an advantage in attracting
new business and continuing to consolidate
24

The HCPL Market Today
Market remains fragmented even after two
decades of consolidation
decades of consolidation
More than 100 writers
Largest market share is ~8%
87% of top 100 companies have <2%
76% of top 100 companies have <1%
25

ProAssurance’s Standing in HCPL
ProAssurance is the largest independent
publicly-traded writer of HCPL insurance
publicly-traded writer of HCPL insurance
Fourth largest overall writer
DPW: SNL Data 2012
26

Sound Strategy = Consistent Profitability

Captures our focus on long-term excellence
Increased every year we have been public
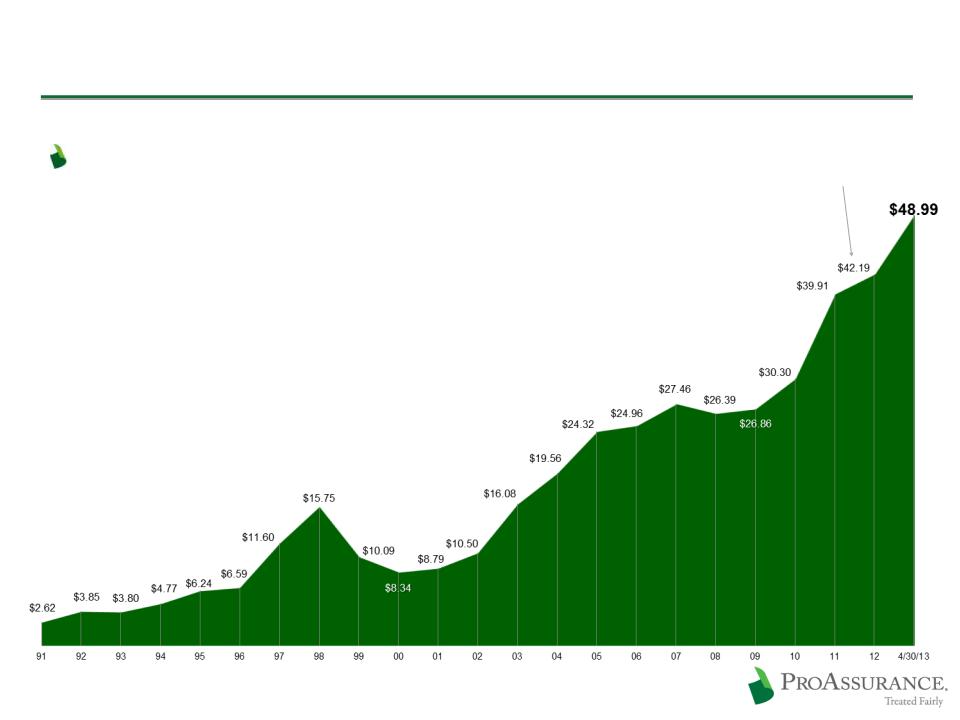
The Payoff: Consistent Book Value Growth
28
Inception to 3/31/13
CAGR: 16%
CAGR: 16%
Cumulative: 2,179%
10 Year Summary (2003 -2012)
CAGR: 16%
CAGR: 16%
Cumulative: 360%
Historical Book Value Per Share
Split Adjusted
Dividends Shown in the Year Declared
Split Adjusted
Dividends Shown in the Year Declared
Reflects all stock splits and includes all dividends in the year declared
Share price reflects investor confidence in
our business decisions and long-term strategy
our business decisions and long-term strategy
The Payoff: Steady Share Price Increase
29
Historical Share Price
Reflects all stock splits
2012 excludes
$2.50/share
special dividend
$2.50/share
special dividend
Inception to 3/31/13
CAGR: 15%
CAGR: 15%
Cumulative: 1,706%
10 Year Summary (2003-2012)
CAGR: 15%
CAGR: 15%
Cumulative: 302%

Historical Financial Performance
Our disciplined, long-term approach drives
consistent profitability
consistent profitability
$ in millions
Net Income1
Operating Income2
30
1 Includes a gain of $35.5 million in the first quarter of 2013 in connection with our acquisition of Medmarc as a result of the value
of the net assets acquired vs. our purchase price.
of the net assets acquired vs. our purchase price.
2 Excludes the after-tax effects of net realized gains or losses and one-time items that do not reflect normal operating results

Q1 2013 Income Statement Highlights
in millions, except per share data
31
|
|
March 31,
|
Y-OVER-Y
Change |
|
|
|
2013
|
2012
|
|
|
Gross Premiums Written
|
$ 163
|
$ 170
|
-4%
|
|
Net Investment Result
|
32
|
31
|
+2%
|
|
Total Expenses (Includes Loss Costs)
|
95
|
105
|
-10%
|
|
Net Income (Includes Realized Investment Gains & Losses
and gain on acquisition) |
$ 113
|
$ 56
|
+103%
|
|
Operating Income
|
$ 60
|
$ 48
|
+24%
|
|
Net Income per Diluted Share
|
$1.82
|
$0.90
|
+102%
|
|
Operating Income per Diluted Share
|
$0.97
|
$0.78
|
+24%
|

2012 Income Statement Highlights
in millions, except per share data
32
|
|
December 31,
|
Y-OVER-Y
Change |
|
|
|
2012
|
2011
|
|
|
Gross Premiums Written
|
$ 536
|
$ 566
|
-5%
|
|
Net Investment Result
|
129
|
132
|
-2%
|
|
Total Expenses (Includes Loss Costs)
|
320
|
302
|
+6%
|
|
Net Income (Includes Realized Investment Gains & Losses)
|
$ 275
|
$ 287
|
-4%
|
|
Operating Income
|
$ 257
|
$ 279
|
-8%
|
|
Net Income per Diluted Share
|
$4.46
|
$4.65
|
-4%
|
|
Operating Income per Diluted Share
|
$4.16
|
$4.52
|
-8%
|

Consistent Approach to Reserves
Consistent reserving practices provide protection
against a loss trend reversal and capital erosion
against a loss trend reversal and capital erosion
33
$ in thousands

Disciplined Underwriting
Five Year Premium History
34
Consistently writing profitable business to ensure
long-term success
long-term success
Premium decline driven by competition, physician
consolidation and rate actions driven by an
unprecedented favorable loss environment
consolidation and rate actions driven by an
unprecedented favorable loss environment
Gross Premiums Written
Net Premiums Earned
Q1 2013 Balance Sheet Highlights
Split adjusted, in billions, except Book Value per share
Shareholders’ Equity $ 2.4 $ 2.3 +4%
Total Investments 4.3 3.9 +10%
Total Assets 5.2 4.9 +6%
Policy Liabilities 2.5 2.3 +9%
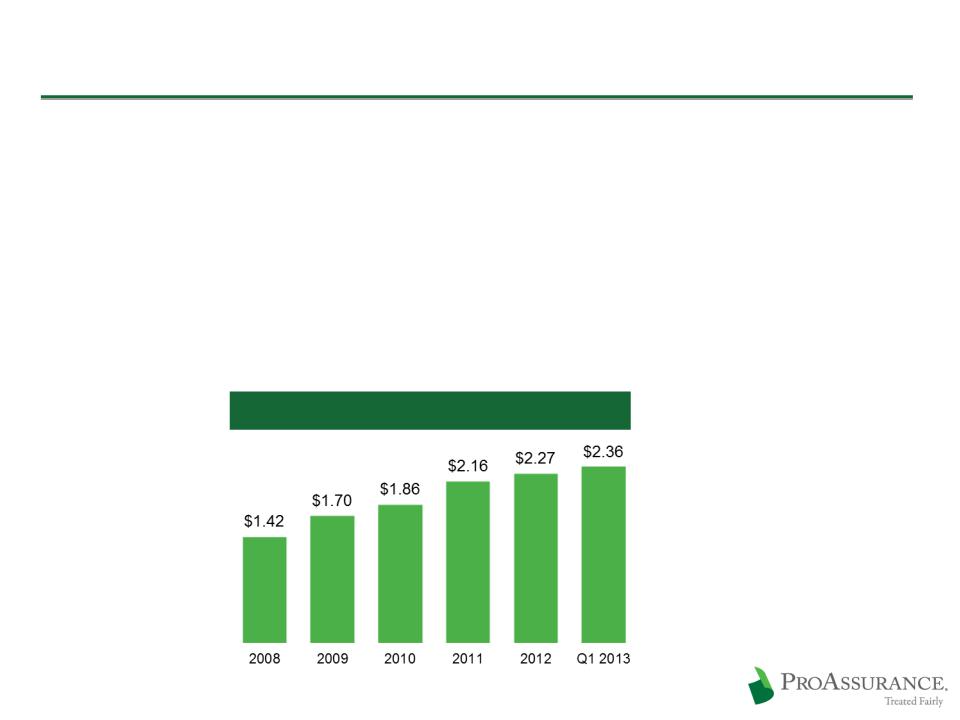
3/31/13 12/31/12 CHANGE
Shareholders’ Equity
66% increase since 2008
Book Value per Share $ 38.19 $36.85 +4%
35

Long-Term Financial Strength
Our balance sheet is our
top financial priority
top financial priority
Financial strength
differentiates us in
the market
differentiates us in
the market
The claims defense
philosophy that
differentiates us in the
market leverages our
financial strength
philosophy that
differentiates us in the
market leverages our
financial strength
Total Assets
36

Capital Management Priorities
Preferred use is to support growth through M&A or new business
We balance future needs with current market reality
Regular dividend is $1.00/share
~2% yield based on 5/8/13 closing price
Prudent share repurchase program
$321 million spent to
repurchase 6.1 million shares
since 2005
repurchase 6.1 million shares
since 2005
Repurchasing shares at prices
that enhance shareholder value
and build Book Value
that enhance shareholder value
and build Book Value
Additional funds utilized
to eliminate long-term debt
to eliminate long-term debt
Share Repurchase History
37

Calendar Year Combined Ratio: ProAssurance Consistently Outperforms in MPL
ProAssurance Outperforms the Industry
Five Years: ProAssurance Average: 58.7% / Industry Average: 84.4%
Ten Years: ProAssurance Average: 77.8% / Industry Average: 94.7%
All Years: ProAssurance Average: 89.8% / Industry Average: 107.9%
Source: A.M. Best Aggregates and Averages, Medical Malpractice Lines of Business, preliminary 2012 data used
38
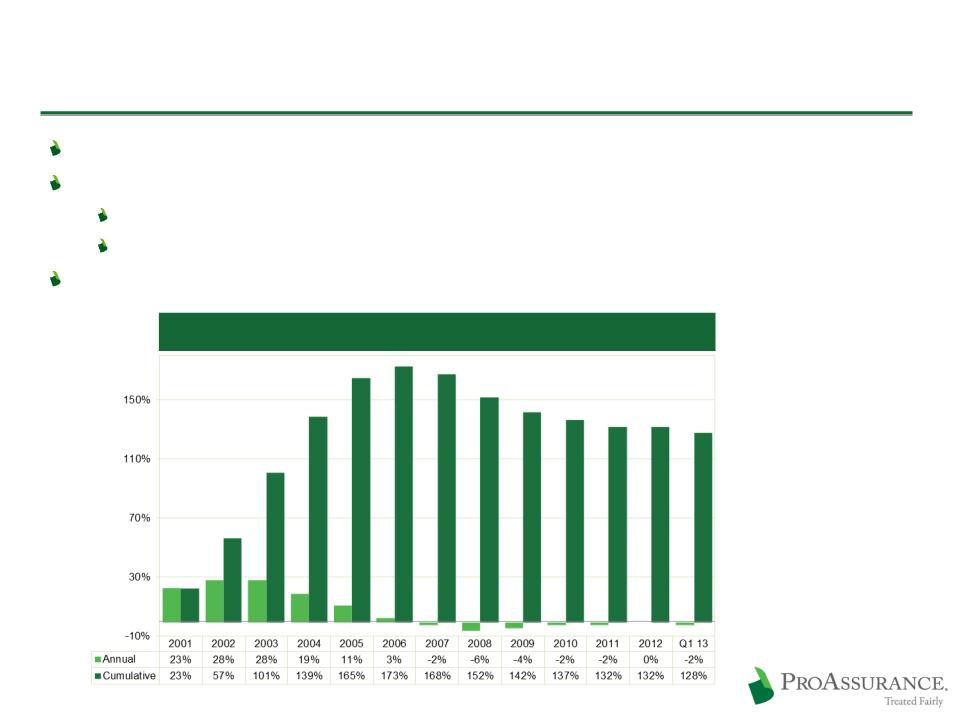
ProAssurance Pricing History
Peak pricing was in 2006
Improved frequency trends are reflected in recent rate declines
Improvement in frequency has outweighed the steady, manageable rise in severity
Loss trends have improved in states with and without tort reforms
Rate changes (up or down) through 2013 likely will be low-to-mid single digits
MD/DO Rate Change History
PICA excluded to facilitate accurate comparisons over time
39
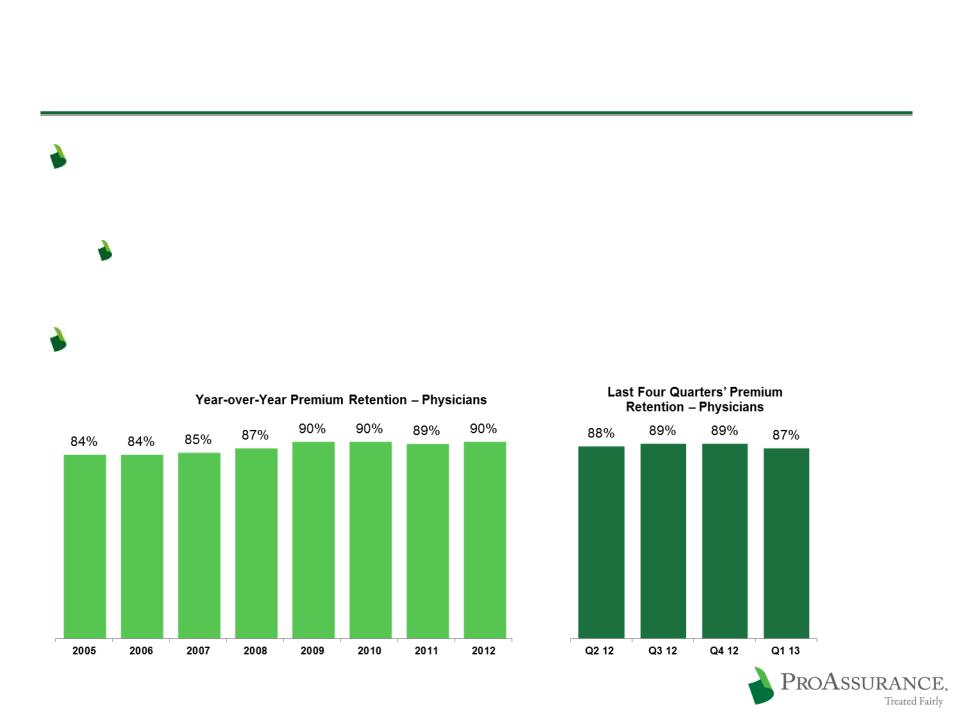
ProAssurance Retention Remains High
Continued underwriting vigilance is being used today
to ensure future success
to ensure future success
Market share is important, but NOT as important as
profitability
profitability
Retention remains in line with recent quarters
40

ProAssurance Operational Review
ProAssurance delivers an unparalleled level of
service and financial stability that truly
differentiates our coverage and our Company in an
evolving, competitive market
service and financial stability that truly
differentiates our coverage and our Company in an
evolving, competitive market

Underwriting for Profitability Not Market Share
Underwriting process driven by individual risk
selection and assessment of loss history, areas
of practice, and location
selection and assessment of loss history, areas
of practice, and location
Rates contemplate specific ROE expectations
Frequent rate/loss reviews ensure adequate prices
Rate filings consider the results of the past five to
seven years to ensure a single year does not unduly
influence results
seven years to ensure a single year does not unduly
influence results
Stringent underwriting standards maintain rate
structure and enhance profitability
structure and enhance profitability
42

Key State Rate Comparison
Annual Premium for a $1M / $3M Policy
Filed or Approved at 1/01/13
43
Understanding Recent Loss Trends
Frequency stable after
historic declines
historic declines
Lawyers are the gatekeepers
Must weigh the cost of a trial vs.
chances of success
chances of success
Likelihood of success is affected
by many factors
by many factors
Societal perceptions of lawsuits
against physicians
against physicians
Effects of the overall Tort
Reform debate and headlines
across the country
Reform debate and headlines
across the country
Reforms enacted in some states
Better quality of care reduces the
number of medical misadventures
number of medical misadventures
Severity uptrend remains
steady at 2%-3%
steady at 2%-3%
Closely tied to inflation
Primarily medical cost inflation
Jury sentiment in reaction to
headlines has moderated, but
not eliminated, runaway
verdicts in recent years
headlines has moderated, but
not eliminated, runaway
verdicts in recent years
Tort Reforms have limited
non-economic damages in a
number of states
non-economic damages in a
number of states
44

New Claims Opened Each Year
Claims Trends Remain Favorable
Fewer cases to try following significant decline in frequency
Severity trends steady and manageable
No observed effect from the economic downturn
Trends are much the same in states with or without Tort Reform
ProAssurance Claims Tried to a Verdict
45

Differentiate Through Claims Defense
We leverage our financial strength to give our insureds the opportunity for
an uncompromising defense of each claim
an uncompromising defense of each claim
Differentiates our product
Provides long-term financial and marketing advantages
Retains business and deters future lawsuits
Increasingly important as claims data becomes public
Malpractice outcomes now public in 26 states
ProAssurance: 78% No Paid Losses
Industry: 72% No Paid Losses
Source: Preliminary PIAA 2011
Claim Trend Analysis,
ProAssurance Excluded
Claim Trend Analysis,
ProAssurance Excluded
Five Year Average
2007-2011
2007-2011
Source: ProAssurance,
as reported to
PIAA
as reported to
PIAA
46
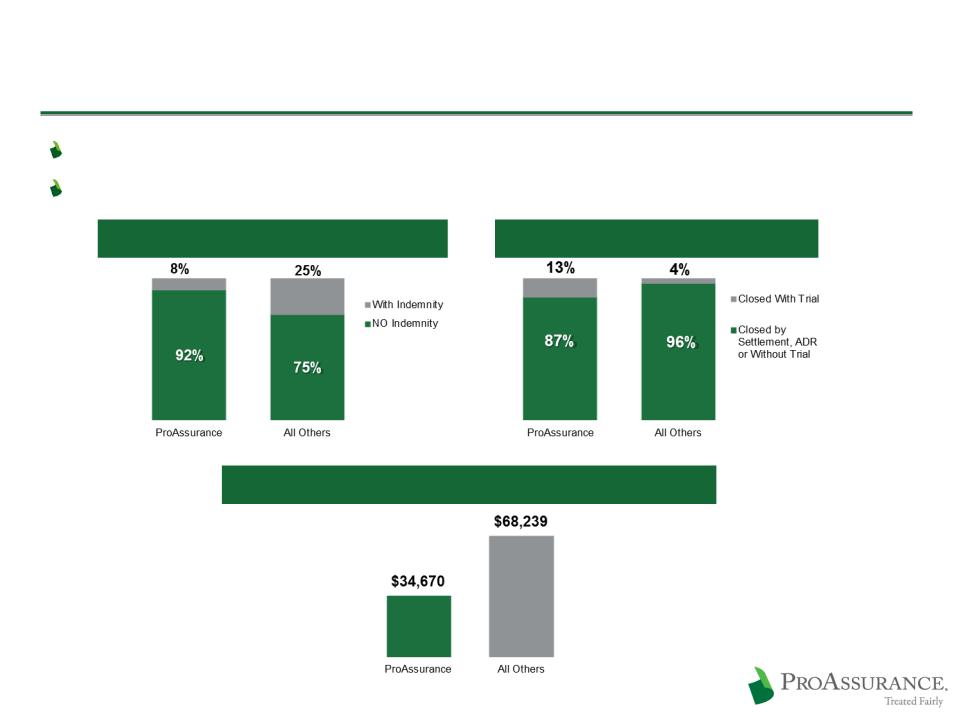
The Ohio Example: 2005 - 2011 Data
Comprehensive, reliable data provided by the Ohio Department of Insurance
Broad range of competitors and business approaches
www.insurance.ohio.gov/Legal/Reports/Documents/2011ClosedClaimReport.pdf
More Claims Closed With No Indemnity
More Claims Defended in Court
2x Lower Average Indemnity Payment per Closed Claim
47
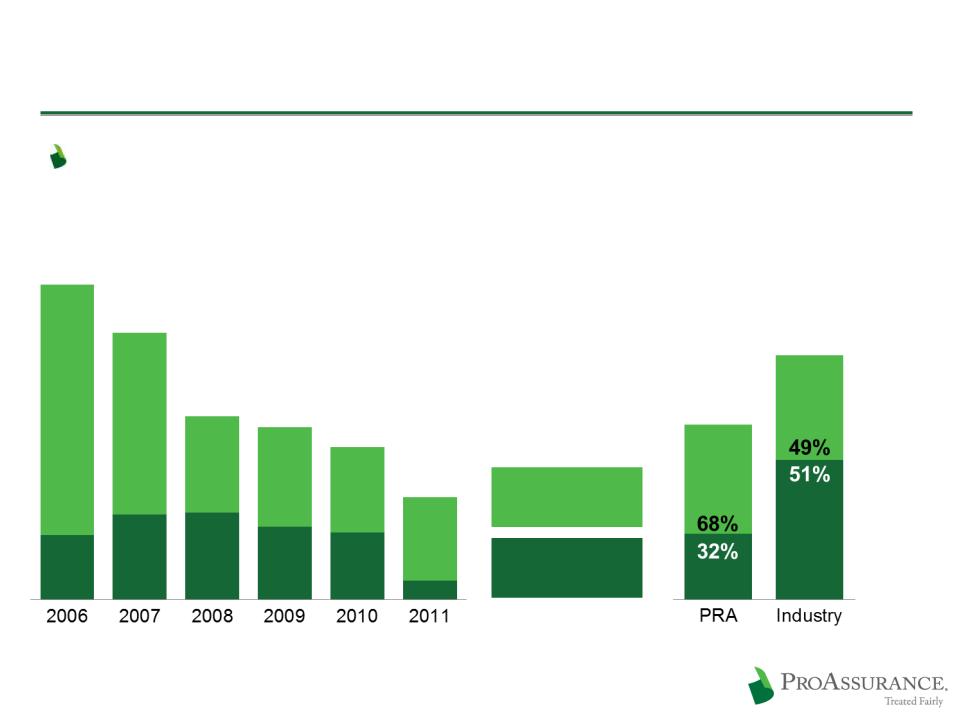
The Bottom Line Benefits of Strong Defense
Our ability and willingness to defend claims allows us
to achieve better results
to achieve better results
Source: Statutory Basis, A.M. Best Aggregates & Averages
Some totals may not agree due to rounding
Some totals may not agree due to rounding
ProAssurance vs. Industry
Average Loss Ratio (2007-2011)
Legal Payments as
a Percentage of
Total Loss Ratio
a Percentage of
Total Loss Ratio
Loss Payments as a
Percentage of Total
Loss Ratio
Percentage of Total
Loss Ratio
64.3%
44.2%
58.9%
42.0%
41.6%
76.0%
36.8%
ProAssurance Stand Alone
Loss Ratio (2006-2011)
Calendar Year
Calendar Year
24.7%
79%
68%
52%
58%
56%
81%
19%
21%
32%
48%
42%
44%
48

Behind the Numbers
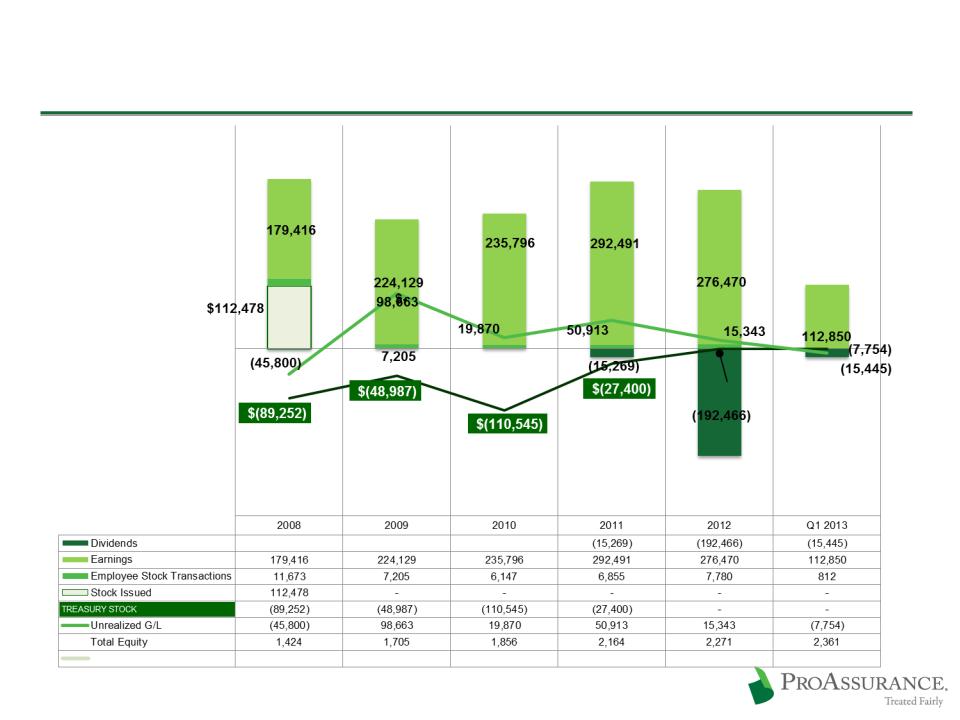
Capital Growth: 2008-Q1 2013
in $000’s except
total equity (000,000’s)
total equity (000,000’s)
* Includes economic cost of holding treasury shares
50
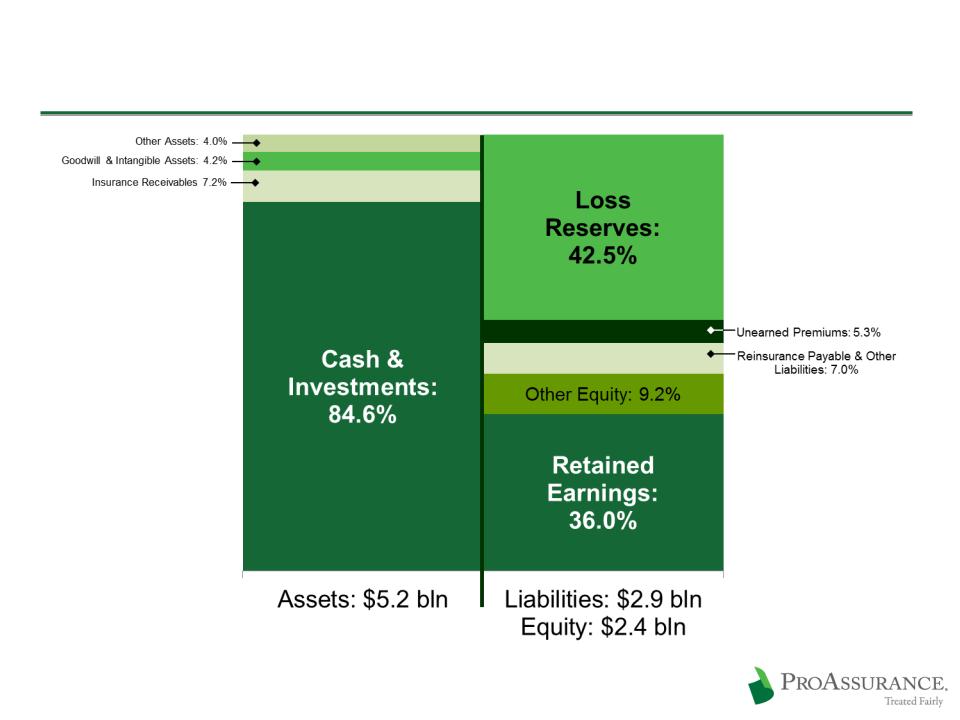
Inside ProAssurance’s Balance Sheet
3/31/13
51

Inside ProAssurance’s Income Statement
3/31/13
52
$35.5 Non-Taxable Gain on Acquisition
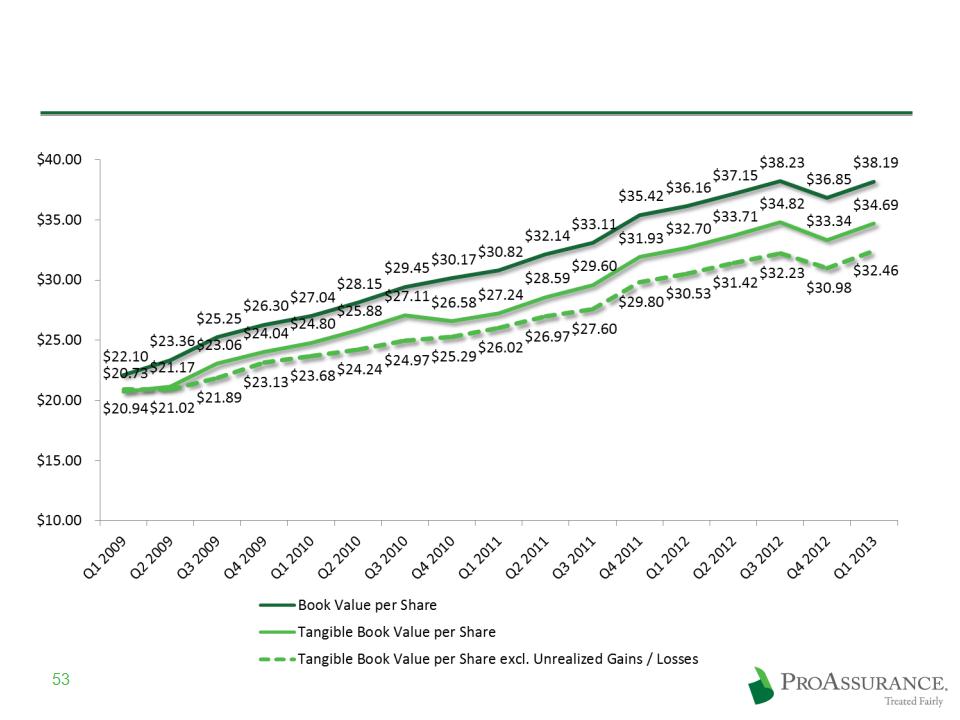
Recent Book Value per Share History

Steady Return in an Unfavorable Environment
Long-term ROE target: 12% -14%

Driven to Excel / Focused on Shareholder Value
Maintaining profitability
Continuing growth in book value per share
Producing sustainable shareholder value
Focusing on long-term—ready for the market turn
Current Prices Continue to Offer a Compelling Buying Opportunity
Current Price to Q1 2013 Book: 1.2x Average Since Inception: 1.4x
Unadjusted for dividends
Prices Adjusted for 2:1 Stock Split
55

ProAssurance Transaction Discussion
Medmarc is broadening our product offerings and capabilities in
protecting the delivery of healthcare
protecting the delivery of healthcare
With the acquisition of
Independent Nevada Doctors Insurance Exchange (IND),
ProAssurance becomes the leading
medical professional liability writer in Nevada
Independent Nevada Doctors Insurance Exchange (IND),
ProAssurance becomes the leading
medical professional liability writer in Nevada

Medmarc Transaction Update
A leading products liability writer in medical
technology and life sciences
technology and life sciences
Meaningful legal professional liability book
Acquisition completed effective January 1, 2013
Functioning as an operationally independent
subsidiary
subsidiary
Broad acceptance in Medmarc’s target markets
Coordinated marketing opportunities growing
57

IND Transaction Update
Leading MPL writer in Nevada
Acquisition completed in late November 2012
Integration well underway and proceeding
smoothly
smoothly
New business opportunities evolving as agents
understand the scope and capability of the
combined organizations
understand the scope and capability of the
combined organizations
58

Investment Portfolio Detail
ProAssurance remains conservatively
invested, to ensure our ability to keep our
long-term promise of insurance protection
invested, to ensure our ability to keep our
long-term promise of insurance protection

ProAssurance: Investment Profile
$4.3 Billion Overall Portfolio
$3.6 Billion Fixed Income Portfolio
Average duration: 3.9 years
Average tax-equivalent
income yield: Q1 13: 4.2% / Q1 12: 4.4%
income yield: Q1 13: 4.2% / Q1 12: 4.4%
Investment grade: 93%
Weighted average: A+
03/31/13
Tax credit portfolio not reflected in investment
income—provides approximately $17.8 million
in tax credits and $10.9 million in deductions in
2013
income—provides approximately $17.8 million
in tax credits and $10.9 million in deductions in
2013
CUSIP-level portfolio disclosure on our website:
www.proassurance.com/investorrelations/supplemental.aspx
www.proassurance.com/investorrelations/supplemental.aspx
60

ProAssurance Portfolio Detail: Asset Backed
03/31/13
Subject to Rounding
Asset Backed: $490 Million
Weighted Average Rating: “AA+”
61
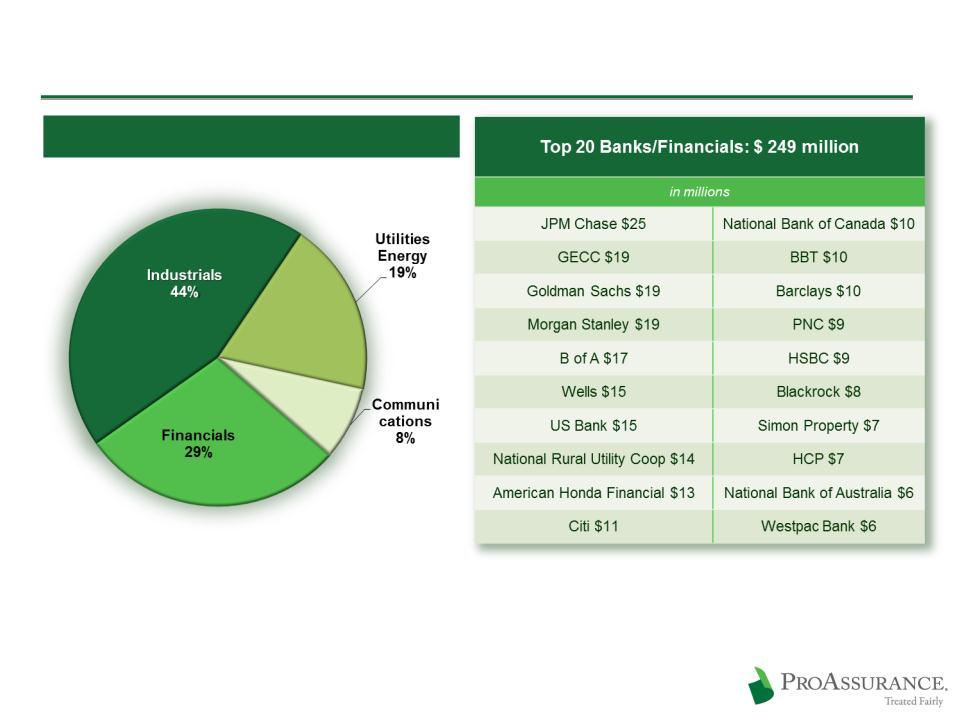
ProAssurance Portfolio Detail: Corporate
Corporates: $1.6 Billion
Weighted Average Rating: A-
3/31/13
62
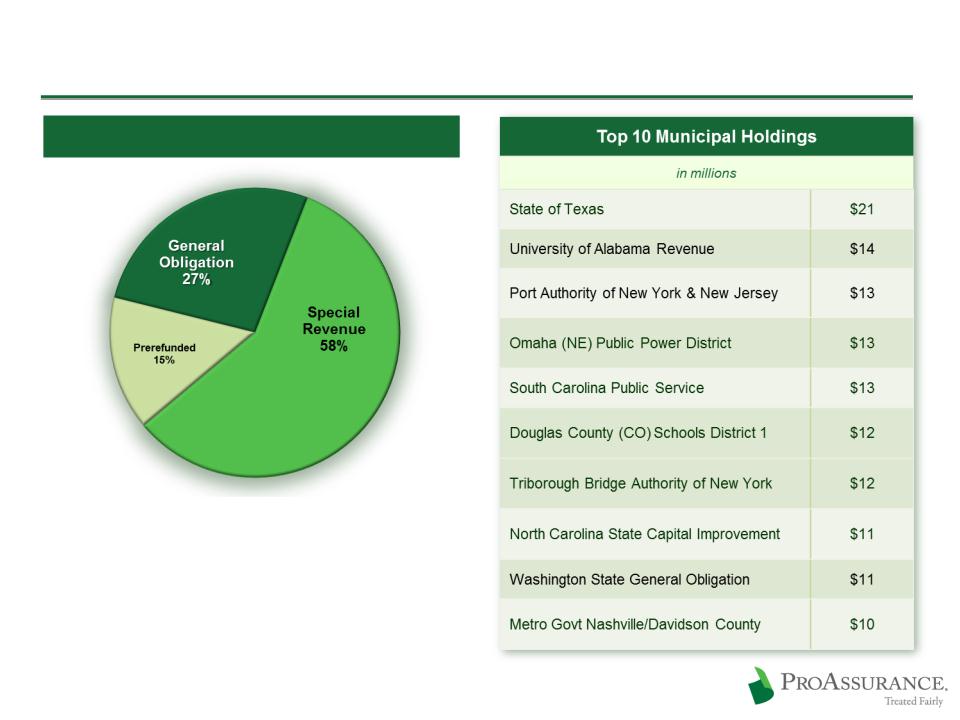
ProAssurance Portfolio Detail: Municipals
Municipals: $1.3 Billion / Average Rating is AA
Investment policy has always required
investment grade rating prior to applying the
effect of insurance
investment grade rating prior to applying the
effect of insurance
Weighted Average Rating: AA
12/31/12
63

ProAssurance Portfolio Detail: Equities & Other
12/31/12
64
Equities & Other: $489 Million
4.9% TE Book Yield
13% TE IRR
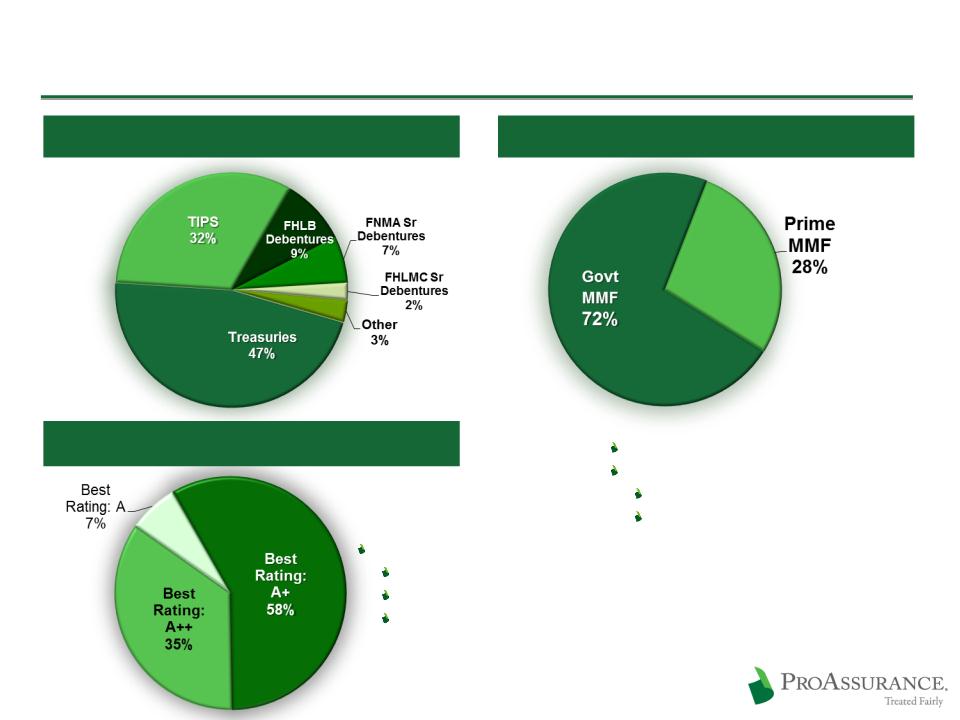
ProAssurance Portfolio Detail: Various
Rated A1/P1 or better
Money Markets:
Moody’s: Aaa
S&P: AAA
Weighted average rating
Moody’s: AA3
S&P: AA-
A. M. Best: A+
Treasury / GSE: $291 Million
Short Term: $149 Million
BOLI: $53 Million
03/3/13
65

Additional Financial Data

Prepared for an improving market
Conservative Use of Debt / Low Leverage
Credit facility accessed for
$125 million in short-term
borrowing (December 2012)
$125 million in short-term
borrowing (December 2012)
Debt to Equity
No Debt Prior to 2001
Strong Capital Position
67

The choice: chase yield or extend duration
We are maintaining duration, looking for
opportunities
opportunities
Pricing discipline becomes even more
critical in a low interest rate environment
critical in a low interest rate environment
Lack of investment yield may be a hard
market catalyst
market catalyst
Return on Equity and Investment Returns
Assumes a 1:1 premium to surplus ratio for physicians
professional liability claims-made coverages
professional liability claims-made coverages
Combined Ratio Required to
Generate a 13% Return on Equity
Generate a 13% Return on Equity
Long-Term ROE Target is 12%-14%
The Yield Trap
Revised to reflect yields at 03/31/13
68