Attached files
| file | filename |
|---|---|
| EX-99.2 - PRESENTATION MATERIALS FOR GROUP PRESENTATION. - PROASSURANCE CORP | exhibittwo.htm |
| 8-K - FILING TO DISCLOSE PRESENTATION MATERIALS. - PROASSURANCE CORP | bodyoffiling.htm |

May 14, 2013
2013 Securities Research Conference
2013 Securities Research Conference
Edward L. Rand, Jr. Chief Financial Officer
Frank B. O’Neil Investor Relations Officer
Investor Presentation
Investor Presentation

This presentation contains Forward Looking Statements and other information designed to convey
our projections and expectations regarding future results. There are a number of factors which
could cause our actual results to vary materially from those projected in this presentation. The
principal risk factors that may cause these differences are described in various documents we file
with the Securities and Exchange Commission, such as our Current Reports on Form 8-K, and our
regular reports on Forms 10-Q and 10-K, particularly in “Item 1A, Risk Factors.” Please review
this presentation in conjunction with a thorough reading and understanding of these risk factors.
We especially identify statements concerning our transactions involving Medmarc Insurance Group
and Independent Nevada Doctors Insurance Exchange as Forward Looking Statements and direct
your attention to our news releases issued on June 27, 2012, our Current Report on Form 8K,
issued on June 28, 2012 and our 10K, filed on February 19, 2013 for a discussion of risk factors
pertaining to these transactions and subsequent integration into ProAssurance.
This presentation contains Non-GAAP measures, and we may reference Non-GAAP measures in
our remarks and discussions. A reconciliation of these measures to GAAP measures is available in
our latest quarterly news release, which is available in the Investor Relations section of our website,
www.ProAssurance.com, and in the related Current Report on Form 8K disclosing that release.
our remarks and discussions. A reconciliation of these measures to GAAP measures is available in
our latest quarterly news release, which is available in the Investor Relations section of our website,
www.ProAssurance.com, and in the related Current Report on Form 8K disclosing that release.
FORWARD LOOKING STATEMENTS
2
NON-GAAP MEASURES

ProAssurance Financial & Strategy Overview
Edward L. Rand, Jr.
Chief Financial Officer
Chief Financial Officer

ProAssurance Corporate Profile
Specialty liability insurance writer
Healthcare Professional Liability (HCPL)
Life sciences and medical devices
Attorney’s professional liability
Market Cap: ~$3.0 billion
Shareholders’ Equity: $2.4 billion
Total Assets: $5.3 billion
Claims-Paying Ratings: “A” by A. M. Best and Fitch
Debt ratings recently upgraded by Moody’s
4

Q1 2013 Highlights
Increased Net and Operating Income Y-O-Y
ROE of 13.4%
Book Value per share now $38.19
4% increase since year-end 2012
Book Value per Share has grown each year since
1991
1991
Recent transactions contributing to our results
with integration proceeding as planned
with integration proceeding as planned
5

Q1 2013 Income Statement Highlights
in millions, except per share data
6
|
|
March 31,
|
Y-OVER-Y
Change |
|
|
|
2013
|
2012
|
|
|
Gross Premiums Written
|
$ 163
|
$ 170
|
-4%
|
|
Net Investment Result
|
32
|
31
|
+2%
|
|
Total Expenses (Includes Loss Costs)
|
95
|
105
|
-10%
|
|
Net Income (Includes Realized Investment Gains & Losses
and gain on acquisition) |
$ 113
|
$ 56
|
+103%
|
|
Operating Income
|
$ 60
|
$ 48
|
+24%
|
|
Net Income per Diluted Share
|
$1.82
|
$0.90
|
+102%
|
|
Operating Income per Diluted Share
|
$0.97
|
$0.78
|
+24%
|

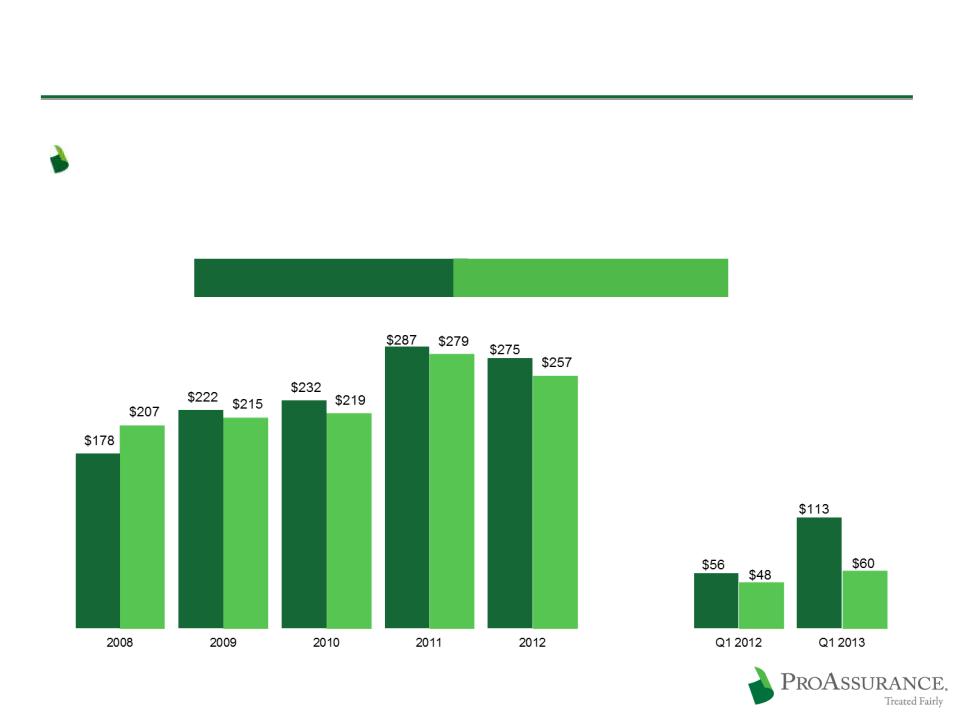
Disciplined Underwriting
Five year Premium History
7
Focused on writing profitable business to ensure
long-term success
long-term success
Premium decline driven by competition, physician
consolidation and rate actions driven by an
improving loss environment
consolidation and rate actions driven by an
improving loss environment
Gross Premiums Written
Net Premiums Earned

Q1 2013 Income Statement Highlights
in millions, except per share data
8
|
|
March 31,
|
Y-OVER-Y
Change |
|
|
|
2013
|
2012
|
|
|
Gross Premiums Written
|
$ 163
|
$ 170
|
-4%
|
|
Net Investment Result
|
32
|
31
|
+2%
|
|
Total Expenses (Includes Loss Costs)
|
95
|
105
|
-10%
|
|
Net Income (Includes Realized Investment Gains & Losses
and gain on acquisition) |
$ 113
|
$ 56
|
+103%
|
|
Operating Income
|
$ 60
|
$ 48
|
+24%
|
|
Net Income per Diluted Share
|
$1.82
|
$0.90
|
+102%
|
|
Operating Income per Diluted Share
|
$0.97
|
$0.78
|
+24%
|

Seeking Increased Yield But Balancing Risk
We continue to focus on
maintaining a high quality,
well diversified fixed income
portfolio
maintaining a high quality,
well diversified fixed income
portfolio
We are making incremental
changes to obtain higher yields
in blue chip investments
changes to obtain higher yields
in blue chip investments
$4.3 Billion
Portfolio
Portfolio
$4.3 Billion
Portfolio
Portfolio
Fixed Income:
84%
84%
Fixed Income:
84%
84%
Short Term: 2%
Short Term: 2%
Equity and Equity Substitutes: 12%
Equity and Equity Substitutes: 12%
BOLI: 1%
BOLI: 1%
3/31/13
9

Q1 2013 Balance Sheet Highlights
Split adjusted, in billions, except Book Value per share
Shareholders’ Equity $ 2.4 $ 2.3 +4%
Total Investments 4.3 3.9 +10%
Total Assets 5.2 4.9 +6%
Policy Liabilities 2.5 2.3 +9%
3/31/13 12/31/12 CHANGE
Shareholders’ Equity
66% increase since 2008
Book Value per Share $ 38.19 $36.85 +4%
10
Historical Financial Performance
Our disciplined, long-term approach drives
consistent profitability
consistent profitability
$ in millions
Net Income1
Operating Income2
11
1 Includes a gain of $35.5 million in the first quarter of 2013 in connection with our acquisition of Medmarc as a result of the value
of the net assets acquired vs. our purchase price.
of the net assets acquired vs. our purchase price.
2 Excludes the after-tax effects of net realized gains or losses and one-time items that do not reflect normal operating results

Consistent Approach to Reserves
Consistent reserving practices provide protection
against a loss trend reversal and capital erosion
against a loss trend reversal and capital erosion
$ in thousands

Capital Management Priorities
Preferred use is to support growth through M&A or new business
We balance future needs with current market reality
Regular dividend is $1.00/share
~2% yield based on 5/8/13 closing price
Prudent share repurchase program
$321 million spent to
repurchase 6.1 million shares
since 2005
repurchase 6.1 million shares
since 2005
Repurchasing shares at prices
that enhance shareholder value
and build Book Value
that enhance shareholder value
and build Book Value
Additional funds utilized
to eliminate long-term debt
to eliminate long-term debt
Share Repurchase History
13

Captures our focus on long-term excellence
Increased every year we have been public
The Payoff: Consistent Book Value Growth
14
Inception to 3/31/13
CAGR: 16%
CAGR: 16%
Cumulative: 2,179%
10 Year Summary (2003 -2012)
CAGR: 16%
CAGR: 16%
Cumulative: 360%
Historical Book Value Per Share
Split Adjusted
Dividends Shown in the Year Declared
Split Adjusted
Dividends Shown in the Year Declared
Reflects all stock splits and includes all dividends in the year declared

Share price reflects investor confidence in
our business decisions and long-term strategy
our business decisions and long-term strategy
The Payoff: Steady Share Price Increase
15
Historical Share Price
Reflects all stock splits
2012 excludes
$2.50/share
special dividend
$2.50/share
special dividend
Inception to 3/31/13
CAGR: 15%
CAGR: 15%
Cumulative: 1,706%
10 Year Summary (2002 -2012)
CAGR: 15%
CAGR: 15%
Cumulative: 302%

Strategies for Future Success
Frank B. O’Neil
Senior Vice-President

Building a Bridge to the Future
Our core business is at a pivot point
We are uniquely positioned to succeed by serving the
emerging market and remaining legacy business
emerging market and remaining legacy business
Smaller competitors with less experience and capacity
have decisions to make
have decisions to make
17
Legacy business is largely
single-state, solo
and small groups.
A substantial amount of this
business will remain, but
will demand more from
insurers.
single-state, solo
and small groups.
A substantial amount of this
business will remain, but
will demand more from
insurers.
The future will be
dominated by large
groups and institutions,
often multi-disciplinary
and multi-state. They
will demand financial
strength and deep
expertise.
dominated by large
groups and institutions,
often multi-disciplinary
and multi-state. They
will demand financial
strength and deep
expertise.

Building a Bridge to the Future
Larger risks will demand sophisticated
coverages that span the continuum of healthcare
coverages that span the continuum of healthcare
Broad healthcare liability experience is our
foundation
foundation
We added capacity & capability through M&A
Example: Medmarc, PICA and Mid-Continent
Home
Healthcare
Healthcare
Non-Traditional
Delivery Settings
Delivery Settings
Multi-Specialty
Clinics
Clinics
Hospital & Facility
Centered Care
Centered Care
New delivery
devices,
techniques and
research
devices,
techniques and
research
ProAssurance spans the continuum of care
Traditional
Practices
Practices
18

ProAssurance Will Grow Prudently
ProAssurance is a demonstrated leader in M&A
We will broaden our lines of coverage as needed
Healthcare-related
Through prudent leverage of our expertise and the
addition of specialized expertise
addition of specialized expertise
The market will firm and we are prepared to
grow organically
grow organically
Past history teaches us the turn will be sudden and
capital will allow us to respond rapidly
capital will allow us to respond rapidly
19

Strategy for an Evolving Market
Shaped by a healthcare landscape that will
change—with or without federal healthcare
reform
change—with or without federal healthcare
reform
Expanding our capabilities and commitment
across the continuum of healthcare
across the continuum of healthcare
Building on two decades of hospital experience
Recent expansion into products liability for life
sciences and medical devices through M&A
sciences and medical devices through M&A
Enhancing our historical commitment to
individual providers and small groups
individual providers and small groups
20

Strategy for an Evolving Market
Leverage our reach, expertise and financial
strength with larger accounts
strength with larger accounts
Largest non-profit healthcare
system in the US
system in the US
Now in Michigan, Florida,
Illinois, Indiana and Texas
Illinois, Indiana and Texas
Insuring Ascension-affiliated
physicians through coordinated,
jointly insured programs
physicians through coordinated,
jointly insured programs
Financial involvement of both entities creates incentive to reduce risk
*www.ascensionhealth.org/index.php?option=com_locations&view=locations&Itemid=148
Ascension Health’s Ministry Locations*
21

Strategy for an Evolving Market
Joint physician/hospital insurance products to
address the unique risk tolerance and claims-
handling expectation of each insured
address the unique risk tolerance and claims-
handling expectation of each insured
Partnerships with existing physician-focused
companies to leverage hospital expertise
companies to leverage hospital expertise
Recently announced California venture with
CAP-MPT: CAPAssurance
CAP-MPT: CAPAssurance
Alternative risk and self-insurance mechanisms
Captive insurance, risk sharing programs and
Risk Retention Groups for
specific specialties or regions
Risk Retention Groups for
specific specialties or regions
22

Healthcare Reform
No meaningful change after the election
Known: More customers for us
May accelerate the growth of hospital-owned practices and
consolidation into larger groups
consolidation into larger groups
Provides an opportunity for us due to our geographic reach,
long-term experience in hospitals and our financial strength
long-term experience in hospitals and our financial strength
We have enhanced our ability to write new classes of business
through acquisitions
through acquisitions
May hasten the need for consolidation of smaller insurers
Unknown: Effect on the medical/legal environment
Increased patient frustration with the system
Possibility of more unexpected outcomes
23