Attached files
| file | filename |
|---|---|
| 8-K - GULF SOUTH BANK CONFERENCE SLIDES - MIDSOUTH BANCORP INC | form8k_gsbc.htm |
Exhibit 99.1
Gulf South Bank Conference May 13, 2013 NYSE MKT: MSL

* Forward Looking Statements Certain statements contained herein are forward-looking statements within the meaning of Section 27A of the Securities Act of 1933 and Section 21E of the Securities Exchange Act of 1934 and subject to the safe harbor provisions of the Private Securities Litigation Reform Act of 1995, which involve risks and uncertainties. These statements include, among others, the expected impacts of the recently completed PSB acquisition, future expansion plans and future operating results. Actual results may differ materially from the results anticipated in these forward-looking statements. Factors that might cause such a difference include, among other matters, the ability of MidSouth to integrate the PSB operations and capitalize on new market opportunities resulting from the acquisition; the effect of the PSB acquisition on relations with customers and employees; changes in interest rates and market prices that could affect the net interest margin, asset valuation, and expense levels; changes in local economic and business conditions, including, without limitation, changes related to the oil and gas industries, that could adversely affect customers and their ability to repay borrowings under agreed upon terms, adversely affect the value of the underlying collateral related to their borrowings, and reduce demand for loans; the timing and ability to reach any agreement to restructure nonaccrual loans; increased competition for deposits and loans which could affect compositions, rates and terms; the timing and impact of future acquisitions, the success or failure of integrating operations, and the ability to capitalize on growth opportunities upon entering new markets; loss of critical personnel and the challenge of hiring qualified personnel at reasonable compensation levels; legislative and regulatory changes, including changes in banking, securities and tax laws and regulations and their application by our regulators, changes in the scope and cost of FDIC insurance and other coverage; and other factors discussed under the heading "Risk Factors" in MidSouth's Annual Report on Form 10-K for the year ended December 31, 2012 filed with the SEC on March 18, 2013 and in its other filings with the SEC. MidSouth does not undertake any obligation to publicly update or revise any of these forward-looking statements, whether to reflect new information, future events or otherwise, except as required by law.

* *As of 5/7/13 SNL Financial LC Company Profile Headquarters: Lafayette, LA Founded: 1985 Total assets: (3/31/13) $1.91 billion Shareholders’ equity: (3/31/13) $189 million Market Capitalization: $168.9 million* Offices: 60 in 26 parishes/ counties Average daily trading volume: 10,413 shares (annual)* Insider ownership: (3/31/13) 24% Institutional ownership : 38%* 60 MSL Locations Reaching 12.5 million people Across 1,600 Miles in LA and TX

* Name Title Age Years in Banking C.R. “Rusty” Cloutier President and Chief Executive Officer 66 48 Jerry Reaux Vice Chairman and Chief Operating Officer 52 31 Troy M. Cloutier Senior Executive Vice President and Chief Banking Officer 39 20 James R. McLemore Senior Executive Vice President and Chief Financial Officer 53 28 John R. Nichols Senior Executive Vice President and Chief Credit Officer 57 35 Experienced Management Team

* Source: SNL Building Franchise Value with Focus on Growth Total return of 21% since capital raise in Q409 Dividend Yield 2% MSL Shareholder Return Financial Metrics 2013 Q1 ROAA 0.74% ROATCE 13.73% Core ROAE 7.61% Net Interest Margin 4.61% Efficiency Ratio 73.62% Non-interest Inc/ Operating Rev 18.67% Loans/ Deposits 66.52%

* Positioned for Growth in Attractive Markets Focus on growth around I-10, I-45, I-20 and I-49 corridors in Louisiana and SE Texas Strong Demographics in LA and TX due to energy and pro-business climate Organic/denovo branches 2 opening for remainder of 2013 6 potential openings 2014 Acquisitions over $40 billion assets available in target markets Future Growth Opportunities

* Demographic Profile Demographic Profile - Texas State Total Population 2012 (Actual) Population Change 2010-2012 (%) Projected Population Change 2012-2017 (%) Median HH Income 2012 ($) Projected HH Income Change 2012-2017 (%) Texas 25,906,038 3.02 7.70 47,622 16.32 Aggregate: National 313,129,017 1.42 3.47 50,157 13.43 Source: SNL, Bureau of Labor Statistics as of 3/31 US 7.6% TX 6.8%

* Source: SNL, Bureau of Labor Statistics as of 3/31 Demographic Profile - Louisiana State Total Population 2012 (Actual) Population Change 2010-2012 (%) Projected Population Change 2012-2017 (%) Median HH Income 2012 ($) Projected HH Income Change 2012-2017 (%) Louisiana 4,628,363 2.10 4.01 41,601 16.99 Aggregate: National 313,129,017 1.42 3.47 50,157 13.43 US 7.6% LA 6.2%

* Shale oil and gas is extracted from shale, an unconventional reservoir of hydrocarbons Shale oil and gas reserves will be a big part of the US energy supply for many years to come Four shale formations cover our area and include: Barnett, Eagle Ford, Haynesville/ Bossier, and the prospective Tuscaloosa Cheaper natural gas is promoting petro-chemical expansion and growth of LNG exports in SE Texas and SW Louisiana Energy Exploration Source: PacWest Consulting Partners Current MSL Locations Basins Gas Plays Oil/liquid Plays

* Texas Opportunities Source: SNL MSA Projected Median Projected MSA Total Population Population HH HH Income MSA Population Change Change Income Change MSA 2012 2010-2012 2012-2017 2012 2012-2017 MSA (Actual) (%) (%) ($) (%) Dallas-Fort Worth, TX 6,552,527 2.8 7.9 54,685 13.8 Beaumont, TX 397,668 2.3 3.2 41,825 23.7 Houston, TX 6,153,249 3.4 8.8 52,674 14.5 Tyler, TX 215,361 2.6 7.3 42,534 22.8 Texarkana, TX 137,679 1.2 2.5 38,472 18.6 Aggregate: National 313,129,017 1.4 3.4 50,157 13.4

* Louisiana Opportunities Source: SNL MSA Projected MSA Total Population Projected Population Median HHH HH Income MSA Population Change Change Income Change MSA 2012 2010-2012 2012-2017 2012 2012-2017 MSA (Actual) (%) (%) ($) (%) Lafayette, LA 281,609 2.8 6.1 43,066 18.8 Baton Rouge, LA 819,880 2.1 4.2 46,771 14.4 Shreveport-Bossier City, LA 405,154 1.6 3.6 39,553 18.7 Alexandria, LA 156,169 1.4 1.5 38,966 18.5 Houma-Bayou Cane-Thibodaux, LA 211,600 1.6 1.6 45,877 14.7 Aggregate: National 313,129,017 1.4 3.5 50,157 13.4

* PSB Successful Integration Payoff of $2 million CVR Loan growth of 12% in Timber Region excluding payoff of CVR-related loans Data Processing conversion completed late March 2013 Stable Deposits Growth Initiatives Update De Novo Branch Openings Market Location May 6, 2013 Houston January 14, 2013 Houston January 7, 2013 Baton Rouge October 24, 2012 Lafayette October 8, 2012 Baton Rouge April 23, 2012 Houston

* Loan Mix as of 3/31/13 ($000’s) Total: $1,037,859 Focus on C&I and owner occupied CRE Loans underwritten primarily on cash flows versus collateral valuations Land & lot development loans equal 6% of total loans Limited construction exposure, primarily funding commercial projects Diversified Loan Portfolio
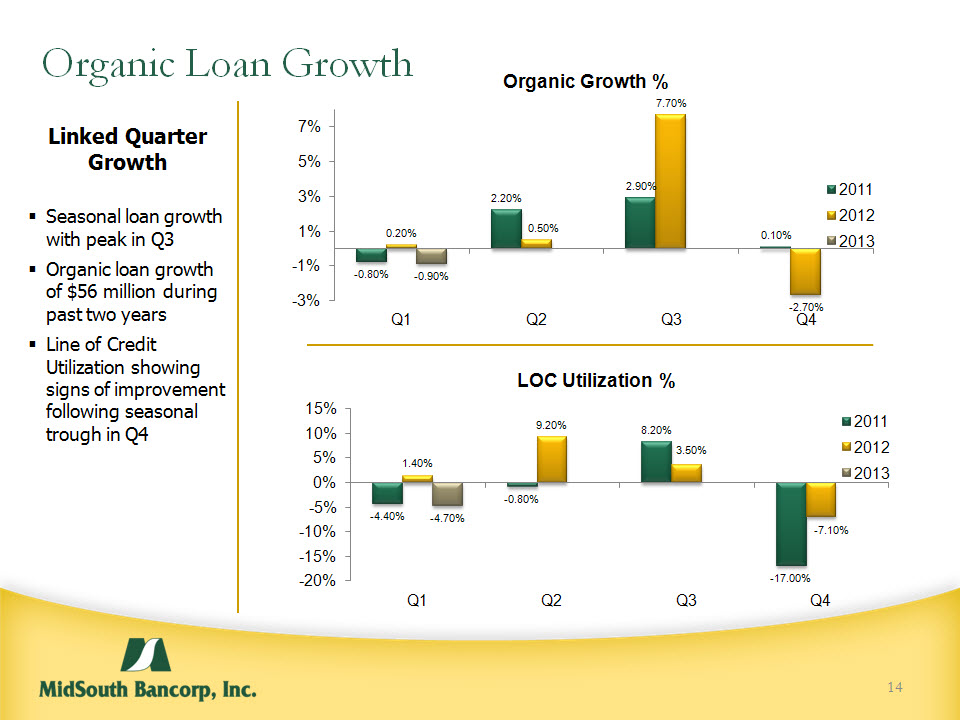
* Organic Loan Growth Linked Quarter Growth Seasonal loan growth with peak in Q3 Organic loan growth of $56 million during past two years Line of Credit Utilization showing signs of improvement following seasonal trough in Q4

* Deposit Mix as of 3/31/13 ($000’s) Total: $1,560,126 Low priced and stable core funding drives profitability and a strong net interest margin Strong deposit mix and low cost of funds MRQ – 39 basis points Checking accounts make up 53% of total deposits Non-time deposits make up 83% of deposits Attractive Core Deposits

* Asset Quality 03/31/13 Relatively low level of non-performing assets Majority of non-performing assets are not in core C&I and owner occupied CRE portfolios Net Charge Offs 0.18% ALLL/Total Loans 0.72% ALLL + Valuation Reserve for Acquired Loans/Total Loans 1.92% Strong Asset Quality
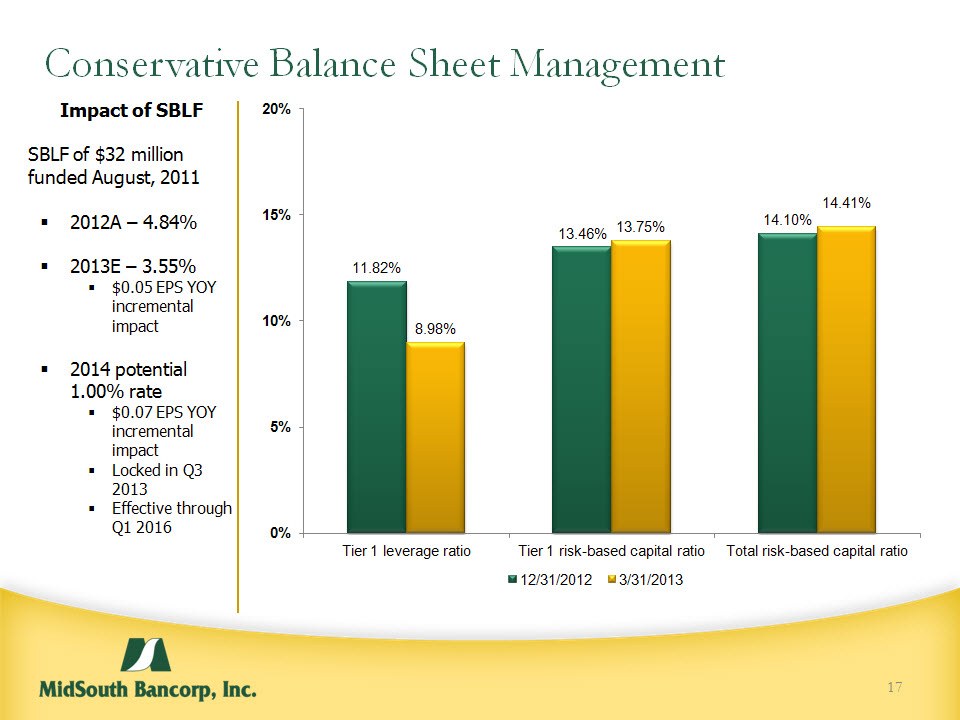
* Impact of SBLF SBLF of $32 million funded August, 2011 2012A – 4.84% 2013E – 3.55% $0.05 EPS YOY incremental impact 2014 potential 1.00% rate $0.07 EPS YOY incremental impact Locked in Q3 2013 Effective through Q1 2016 Conservative Balance Sheet Management

* Investment Considerations NYSE MKT: MSL Deep & experienced management team Located in resilient markets Long-term conservative operating philosophy Well capitalized, well diversified loan portfolio and trophy deposit base Disciplined and opportunistic industry consolidator organic growth and efficiency opportunities in existing markets

* RustyJerry Reaux James R. McLemore, CFA Lorraine Miller, CFA President and CEO Vice Chairman and COO CFO & SEVP Treasurer\Director of M&A rusty.cloutier@midsouthbank.com jerry.reaux@midsouthbank.com jim.mclemore@midsouthbank.com lorraine.miller@midsouthbank.com