Attached files
| file | filename |
|---|---|
| 8-K - FORM 8-K - ENCORE CAPITAL GROUP INC | d538431d8k.htm |
 ENCORE CAPITAL GROUP, INC.
May 2013
JMP Securities 12th Annual Research Conference
Exhibit 99.1 |
 PROPRIETARY
2
CAUTIONARY NOTE ABOUT FORWARD-LOOKING STATEMENTS
|
 PROPRIETARY
ENCORE IS A GROWING COMPANY WITH SOPHISTICATED
OPERATIONS AND DEEP CONSUMER EXPERTISE
3
1
in
7
American
consumers
have
accounts with us
3.1 million
consumers have
satisfied their obligations
$1.9
billion
in
estimated
remaining collections
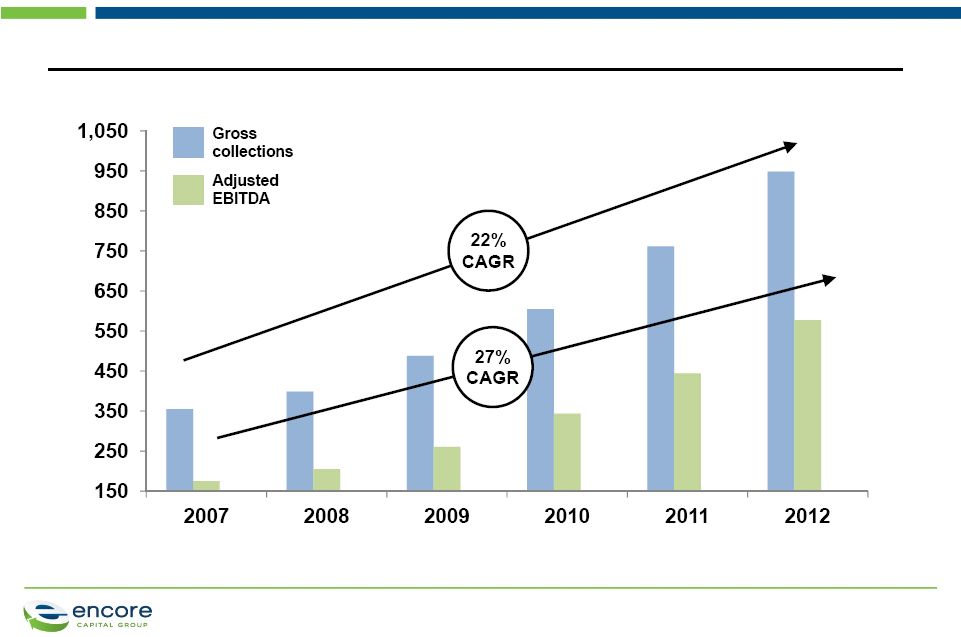
27%
Adjusted
EBITDA
†
5-year
compound annual growth rate
2,800
employees worldwide
$987 million
collected in the last
twelve months
†
See endnote |
 PROPRIETARY
ENCORE IS A LEADING PLAYER IN THE CONSUMER DEBT BUYING AND
RECOVERY INDUSTRY
Global Capabilities
Business Description
•
Purchase and collection of charged-off
unsecured consumer receivables (primarily
credit card)
•
Provision of tax lien transfers, and purchase of
tax lien certificates, through Propel subsidiary
•
Robust business model emphasizing
consumer intelligence and
operational
specialization
•
Invested ~$2.8 billion to acquire receivables
with a face value of ~$80
billion
•
Acquired ~49 million consumer accounts
since
inception
4 |
 PROPRIETARY
OUR FIRST QUARTER RESULTS DEMONSTRATED STRONG
GROWTH
Q1 2013
Q1 2012
Increase/
(Decrease)
Collections
$270
$231
17%
Revenue
$144
$126
14%
Cost to collect
36.5%
38.4%
(190 bps)
Adjusted EBITDA†
$174
$144
21%
EPS*
$0.86
$0.70
23%
5
(in $M -
except CTC and EPS)
†
See endnote for a reconciliation to GAAP
* Excludes one-time deal costs
and non-cash convert interest
Adjusted EBITDA is a non-GAAP number. The Company considers Adjusted EBITDA to
be a meaningful indicator of operating performance and uses it as a measure
to assess the operating performance of the Company. See Reconciliation of Adjusted EBITDA to GAAP Net Income at the end of this presentation. |
 PROPRIETARY
6
WHICH CONTINUES THE TREND WE’VE BEEN EXPERIENCING FOR THE
LAST SEVERAL YEARS
($M)
*
Adjusted EBITDA is a non-GAAP number. The Company considers Adjusted EBITDA to
be a meaningful indicator of operating performance and uses it as a measure
to assess the operating performance of the Company. See Reconciliation of Adjusted EBITDA to GAAP Net Income at the end of this presentation.
Adjusted EBITDA* and gross collections by year
PROPRIETARY |
 PROPRIETARY
WE CONTINUE TO DRIVE DOWN OUR COST-TO-COLLECT DESPITE MAKING
SIGNIFICANT INVESTMENTS IN COMPLIANCE AND INTERNAL LEGAL
7
Overall cost to collect |
 PROPRIETARY
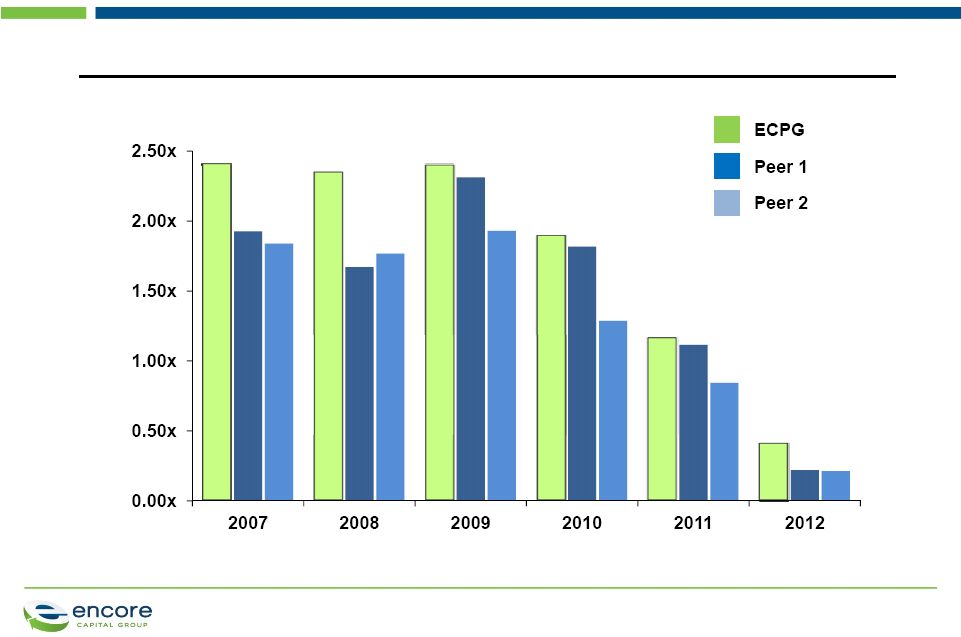
OUR VALUATION AND OPERATING CAPABILITIES HAVE
ESTABLISHED ENCORE AS THE INDUSTRY LEADER
8
Cumulative actual collection multiples by vintage year, as of December 31, 2012
(Total collections / Purchase price)
Source: SEC filings –
For ECPG includes court costs recovered |
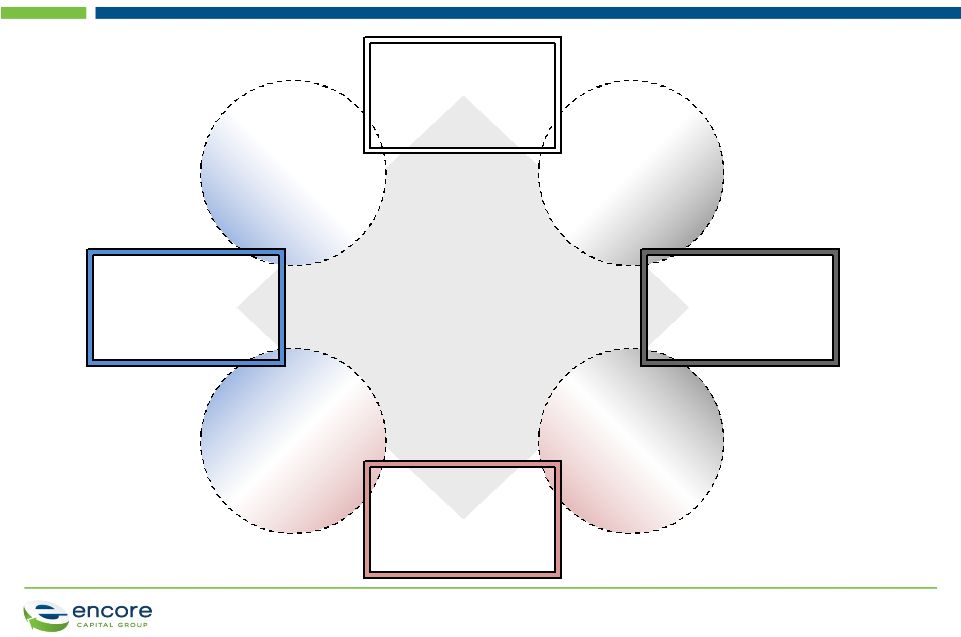 PROPRIETARY
ENCORE’S KEY
COMPETITIVE
ADVANTAGES
OUR SUCCESS IS DRIVEN BY OUR CORE COMPETENCIES
9
Portfolio
valuation
and
purchasing
Operational
modeling
International
operations
Account
Manager
expertise
Consumer
Credit
Research
Institute
Marketing
analytics
Legal
collections
COST
LEADERSHIP
PRINCIPLED
INTENT
ANALYTIC
STRENGTH
CONSUMER
INTELLIGENCE |
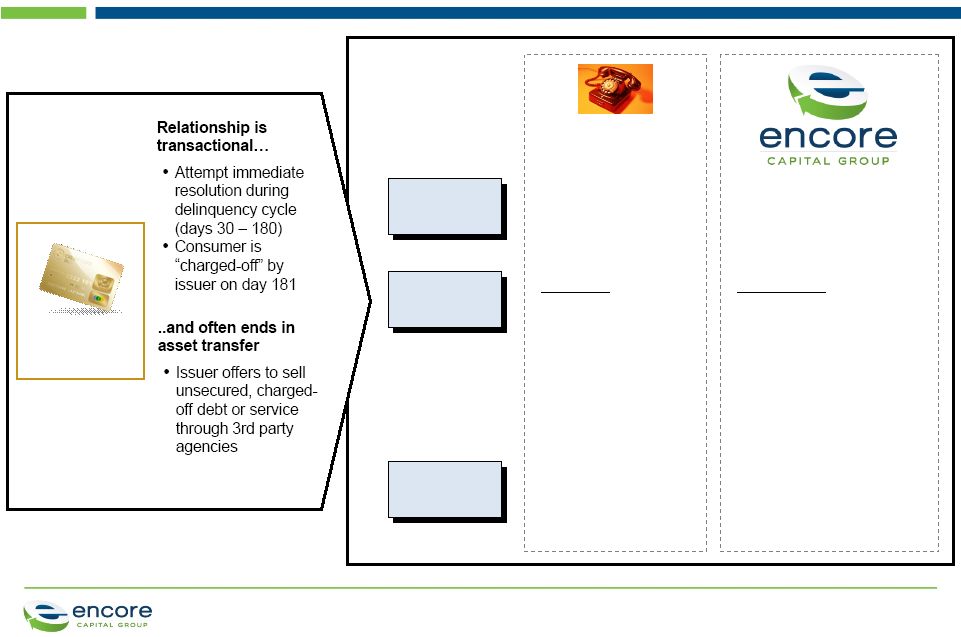 PROPRIETARY
ENCORE PROVIDES AN ESSENTIAL SERVICE AND ITS MODEL SHOULD
BECOME THE INDUSTRY STANDARD
10
Collection
time frame
Consumer
treatment
Outcome
Contingency
collection agency
•
Four-to-six month
collection cycle
Pressure
•
Artificial deadlines
•
Multiple collection
companies
•
Counterproductive
incentive structure
•
Consumer is
confused and
frustrated
•
Consumer has 84
months to recover
financially
Partnership
•
Create partnership
strategy and set goals
•
Tailor work strategies to
individual circumstances,
giving time for a
consumer to recover
•
Maximizes repayment
likelihood, creates
consistency, and
ensures fair treatment
Original
creditor |
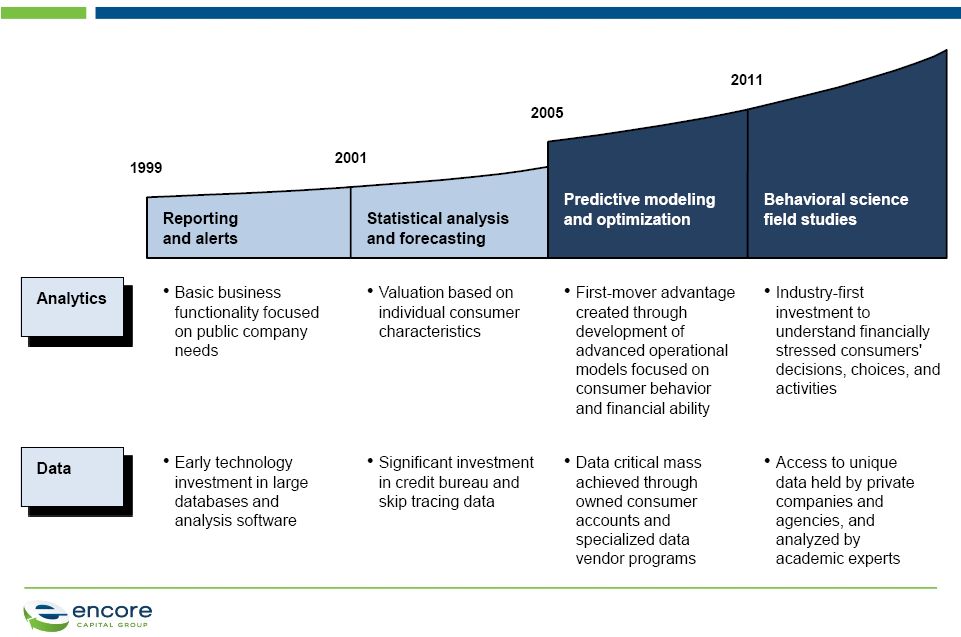 PROPRIETARY
UNDERSTANDING FINANCIALLY STRESSED CONSUMER BEHAVIOR IS
AT THE HEART OF OUR COMPANY’S EVOLUTION
11 |
 PROPRIETARY
Encore’s individual
underwriting approach
to portfolio valuation
accommodates our
specialized operational
strengths
Low willingness
Low ability
High willingness
High capability
High willingness
Moderate capability
High willingness
Low capability
Low willingness
High ability
Low willingness
Moderate ability
THIS IS CLEARLY SEEN IN OUR APPROACH TO ASSET VALUATION
12
The standard industry view
of a consumer debt portfolio
•
Strong partnership and
recovery opportunities
•
Payment plans and
opportunities to build
longer relationships
•
Enforce legal contract
through formal channels
•
Remind consumers
through legal messaging
•
Significant discounts and
many small payments
•
Hardship strategies
and warehousing |
 PROPRIETARY
WE’VE SEEN A SIGNIFICANT INCREASE IN THE NUMBER OF
CONSUMERS WITH MULTIPLE OBLIGATIONS
13
Multiple obligations held within new portfolios, by purchase vintage
(% of unique consumers) |
 PROPRIETARY
WE'RE BUILDING A PLATFORM THAT ENCOURAGES A DIFFERENT
KIND OF RELATIONSHIP WITH OUR CONSUMERS
14
Addressing
debt cycles
•
Acknowledging the limitations of our consumers’
household balance sheets
•
Living the Consumer Bill of Rights
Making focused
investments
•
Creating specialized work groups
•
Leveraging our industry-leading cost efficiency
•
Increasing direct control over consumer experience
Improving
consumer
experience
•
Using market-based surveys and tests to
understand consumer satisfaction
•
Partnering to develop new products and services
•
Pointing consumers to the best external references |
 PROPRIETARY
AS WE LOOK TO THE FUTURE, WE ARE EXPLORING WAYS TO
LEVERAGE OUR CORE COMPETENCIES
15 |
 PROPRIETARY
LAST YEAR, WE BEGAN TO DIVERSIFY THROUGH THE ACQUISITION
OF PROPEL
16
Leading provider of
debt management
and recovery
solutions for
consumers and
property owners
across a broad range
of asset classes
Property
Owners
Structured payment plans to
help residential and commercial
property owners settle tax
obligations and avoid
foreclosure
Consumer
Debt Holders
Robust collection plans to
maximize ability of consumers
to repay obligations and
ensure that consumers are
treated fairly
Financial
Institutions
Payment for
consumer debt
obligations
Local Tax
Authorities
Payment for residential
and commercial
property tax obligations |
 PROPRIETARY
OUR PLAN WAS EXPAND IN OUR CORE MARKET AND INTO OTHER
STATES
17
Working to penetrate
the 80% of the Texas
market that has yet
to use a tax lien
transfer
Existing
market
Lobbying to introduce
legislation in other
states that will create
new markets
New
markets
Exploring alternative
tax lien models that
will allow us to
expand into new
markets
New
opportunities |
 PROPRIETARY
WHICH HAS ALLOWED US TO GROW OUR PORTFOLIO WHILE
MAINTAINING AN EXCEPTIONALLY LOW RISK PROFILE
18
Propel portfolio size
($M)
•
$8,750 average balance
•
9-year term
•
6-year weighted average remaining term
•
13-15% typical interest rate
Portfolio characteristics
•
$230,000 average property value
•
3.84% average LTV at origination
•
0.4% foreclosure rate
•
Zero losses |
 PROPRIETARY
Allows us to be
highly selective
in purchasing
opportunities for
the remainder
of the year
WE RECENTLY ANNOUNCED THE PENDING ACQUISITION OF ASSET
ACCEPTANCE CAPITAL CORP. (NASDAQ: AACC)
Largely satisfies
our 2013
purchasing
goals
Extends
Encore’s
Consumer Bill
of Rights and
best practices
to millions more
consumers
Able to leverage
best practices
across the two
platforms
19 |
 PROPRIETARY
ONE OF THE BENEFITS OF THE TRANSACTION IS THAT WE HAD
FULL VISIBILITY TO HISTORICAL COLLECTIONS
20
Aggregated Portfolio: Actual and projected gross collections by month
($,Ms) |
 PROPRIETARY
Acquisition
of
competitor’s
assets
Significant history
of acquiring assets
in the resale market
gave us an analytic
advantage when
conducting
operational due
diligence
Practice makes
perfect
Industry-leading
models used to
estimate individual
consumer willingness
and ability to pay
•
Enabled us to
identify and
acquire the most
valuable pools
Careful consumer
segmentation
ENCORE IS WELL POSITIONED TO PROVIDE A SOLUTION FOR
COMPETITORS WHO EXIT THE MARKET
21
Our operational
advantages generally
insulate us against
overpaying
•
Powerful operational
models and practices
•
Superior forecasting
methodology
Protection from the
“winner’s curse” |
 PROPRIETARY
OUR CONFIDENCE IS TIED TO THE SUCCESSFUL COMPLETION OF
ONE OF THE INDUSTRY’S FEW DEALS OF THIS SIZE
22
$90M portfolio purchase in 2005, cumulative collections through 3/31/13
($M)
Initial
expectations:
$199M
Results to date:
$237M
Actual
collections
Estimated
collections |
 PROPRIETARY
AND THE CONTINUED STRONG PERFORMANCE ON THE LARGE
PURCHASE COMPLETED LAST MAY
23
$100M+ portfolio purchase in 2012, cumulative collections through 3/31/13
($M)
Initial
expectations:
$59M
Results to date:
$77M
Actual
collections
Estimated
collections |
 PROPRIETARY
WE ARE ALSO WELL WITHIN THE FINANCIAL COVENANTS OF OUR
CREDIT FACILITY
($M)
Covenant analysis
Cash flow leverage ratio
Debt
Trailing 4-quarter Adjusted EBITDA
†
Debt/Adjusted EBITDA (maximum 2.0x)
Minimum net worth
Excess room
Interest coverage ratio
EBIT/interest expense (minimum 2.0x)
Q1 2013
Pro forma
with AACC
811.9
1.03
153.0
24
†
See endnote
785.2
3.9
2012
706.0
577.4
1.22
133.0
5.7
Q1 2013
TTM
646.0
1.08
144.4
600.2
5.8 |
 PROPRIETARY
ENCORE’S LONG-TERM PROSPECTS CONTINUE TO BE STRONG AND
ARE GAINING STRENGTH
•
Operating results continue to be strong and are exceeding
our internal projections
•
Tax lien expansion is part of a longer term diversification
strategy
•
Working collaboratively with legislators and policymakers to
shape the future of the collection industry, likely to be marked
by a significant reduction in competitors
•
Significant purchases in 2012 plus the closing of Asset
Acceptance in June are providing momentum
25 |
 PROPRIETARY
ENDNOTE
26 |
 PROPRIETARY
27
APPENDIX |
 PROPRIETARY
RECONCILIATION OF ADJUSTED EBITDA
Reconciliation of Adjusted EBITDA to GAAP Net Income
(Unaudited, In Thousands)
Three Months Ended
Note:
The
periods
3/31/08
through
12/31/08
have
been
adjusted
to
reflect
the
retrospective
application
of
ASC
470-20.
All
periods
have
been
adjusted
to
show
discontinued
ACG
operations.
PROPRIETARY
28
3/31/08
6/30/08
9/30/08
12/31/08
3/31/09
6/30/09
9/30/09
12/31/09
3/31/10
6/30/10
9/30/10
12/31/10
GAAP net income, as reported
6,751
6,162
3,028
(2,095)
8,997
6,641
9,004
8,405
10,861
11,730
12,290
14,171
(Gain) loss from discontinued operations, net of tax
(422)
(89)
46
(483)
(457)
(365)
(410)
(901)
(687)
(684)
(315)
28
Interest expense
5,200
4,831
5,140
5,401
4,273
3,958
3,970
3,959
4,538
4,880
4,928
5,003
Contingent interest expense
-
-
-
-
-
-
-
-
-
-
-
-
Pay-off of future contingent interest
-
-
-
-
-
-
-
-
-
-
-
-
Provision for income taxes
4,227
4,161
2,429
(1,781)
5,670
3,936
5,676
4,078
6,080
6,356
6,474
9,057
Depreciation and amortization
438
482
396
391
410
402
443
516
522
591
650
789
Amount applied to principal on receivable portfolios
40,212
35,785
35,140
46,364
42,851
48,303
49,188
47,384
58,265
64,901
63,507
53,427
Stock-based compensation expense
1,094
1,228
860
382
1,080
994
1,261
1,049
1,761
1,446
1,549
1,254
Adjusted EBITDA
57,500
52,560
47,039
48,179
62,824
63,869
69,132
64,490
81,340
89,220
89,083
83,729
3/31/11
6/30/11
9/30/11
12/31/11
3/31/12
6/30/12
9/30/12
12/31/12
3/31/13
GAAP net income, as reported
13,679
14,775
15,310
17,134
11,406
16,596
21,308
20,167
19,448
(Gain) loss from discontinued operations, net of tax
(397)
(9)
(60)
101
6,702
2,392
-
-
-
Interest expense
5,593
5,369
5,175
4,979
5,515
6,497
7,012
6,540
6,854
Provision for income taxes
8,349
9,475
9,834
10,418
11,660
12,846
13,887
13,361
12,571
Depreciation and amortization
904
958
1,054
1,165
1,240
1,420
1,533
1,647
1,846
Amount applied to principal on receivable portfolios
85,709
83,939
73,187
69,462
104,603
101,813
105,283
90,895
129,487
Stock-based compensation expense
1,765
1,810
2,405
1,729
2,266
2,539
1,905
2,084
3,001
Acquisition related expense
-
-
-
-
489
3,774
-
-
1,276
Adjusted EBITDA
115,602
116,317
106,905
104,988
143,881
147,877
150,928
134,694
174,483
|
 ENCORE CAPITAL GROUP, INC.
May 2013
JMP Securities 12th Annual Research Conference |