Attached files
| file | filename |
|---|---|
| 8-K - FORM 8-K - DORAL FINANCIAL CORP | d535205d8k.htm |
| EX-99.1 - EX-99.1 - DORAL FINANCIAL CORP | d535205dex991.htm |
 Doral Financial Corporation
Q1 2013 Investor Presentation
May 9, 2013
Exhibit 99.2 |
 Disclaimer
2
This presentation may include forward-looking statements as defined in the
Private Securities Litigation Reform Act of 1995 (the
“PSLRA”). These include comments with respect to our objectives and
strategies, and the results of our operations and our business.
Forward-looking statements can be identified by the fact that they do not relate strictly to historical or current facts.
They
often
include
words
such
as
“expects,”
“anticipates,”
“intends,”
“plans,”
“believes,”
“seeks,”
“estimates,”
or
words
of
similar
meaning,
or
future
or
conditional
verbs
such
as
“will,”
“would,”
“should,”
“could”
or
“may.”
We
intend
these
forward-looking
statements to be covered by the safe harbor provisions of the PSLRA.
Forward-looking statements provide our expectations or predictions of future
conditions, events or results. They are, by their nature, subject to risks
and uncertainties. They are not guarantees of future performance, and actual results may differ materially.
By their nature, these forward-looking statements involve numerous assumptions
and uncertainties, both general and specific, including those discussed in
Doral Financial Corporation’s 2012 Annual Report on Form 10-K and other filings we make with the
Securities and Exchange Commission. Risk factors and uncertainties that could cause
the Company's actual results to differ materially from those described in
forward-looking statements can be found in the Company's 2012 Annual Report on Form 10-K,
which is available in the Company's website at
www.doralfinancial.com, as they may be updated from time to time in the
Company’s periodic and other reports filed with the Securities and Exchange
Commission. The statements in this presentation speak only as of the date
they are made. We do not undertake to update forward-looking
statements
to
reflect
the
impact
of
circumstances
or
events
that
arise
after
the
date
the
forward-looking
statements
were
made,
other than as required by law, including requirements of applicable securities
laws. |
 Q1 2013 Results
3
Doral Growth continues to generate high margins and high returns
o
Net Interest Margin of 3.59% on Net Revenue of $77.6MM
o
1.2% Pre-Tax Return on Average Assets of $6.4B
Established Doral Recovery special servicing operation
o
Transferred $2B of Puerto Rico Residential and Commercial loans to Doral Recovery o
62% of Doral Recovery loans are performing
o
Net Loss
$(12.4)MM
o
Pre-Tax, Pre-Provision Income
$10.2MM
o
Provisions
$18.7MM
o
Net Interest Margin
331bps
o
Book Value per Share
$3.60
o
Tier-1 Leverage Ratio
9.26%
Higher margin and revenues more than offset by credit provisions related to Doral Recovery. |
 Q1
Results Net Loss ($MM)
1
1Q ’13
Net Interest Income
$60.7
Non Interest Income
24.8
Total Net Revenue
$85.5
Non-Interest Expense
75.2
Pre-Tax, Pre-Provision Income
$10.2
Credit Provision
18.7
Pre-Tax Income
(8.5)
Tax Expense (Benefit)
3.9
Reported Net Loss
$(12.4)
Net Revenue reached $85.5MM
Net Interest Margin increased 36bps to 3.31%.
Originated $260MM of Residential Mortgages
during the Quarter
Operating expense down $11.8MM from Q4 2012.
$18.7MM of credit provision primarily tied to Doral
Recovery loans:
4
Credit Provision ($MM)
($MM)
Doral Growth
$3.1
Doral Recovery
15.6
Total
$18.7 |
 5
Doral Operating Segments
Two Operating Segments: High Margin Bank & Special Servicing Group
Puerto Rico Mortgage & Retail Banking
o
$2.4B Residential Mortgage Portfolio
o
#2 Mortgage Originator in Puerto Rico
o
A $11.4B Mortgage Servicer
o
$1.8B of deposits
US Commercial & Retail
o
$2.3B High NIM Specialty Commercial Lender
o
7 retail branches with ~$1B of deposits
Doral’s Core business achieving over 1% Pre -Tax
ROAA
62% of Loans are
Performing. $1.2B
of Puerto Rico Residential Mortgages o
TDRs and Defaulted Loans (180 days past due)
o
66% of loans are Performing
$0.7B of Puerto Rico Commercial Loans
o
CRE, Small Business and Construction & Land
o
56% of loans are Performing
$0.1MM of Mortgage & Commercial OREO
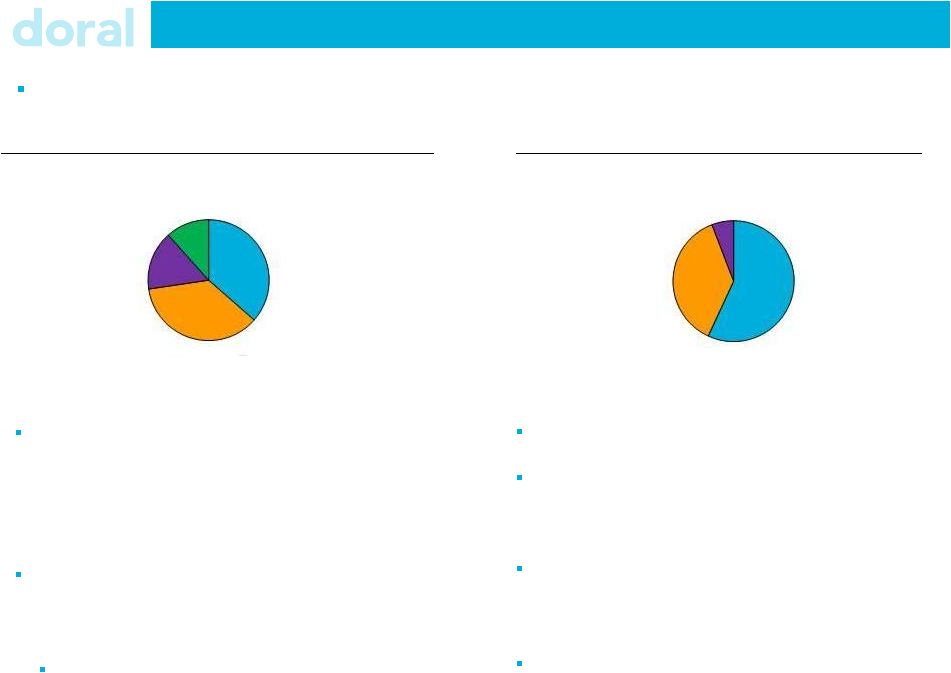
1. Doral Growth: A $6.4B Mortgage & Commercial Bank
2. Doral Recovery: A $2.0B Special Servicing
Group Puerto Rico
Residential Mortgage
(37%)
US Loans
(36%)
Puerto Rico
OREO
(6%)
Cash & Securities
(16%)
Puerto Rico
Commercial
(37%)
Puerto Rico
Residential Mortgage
(57%)
Taxes & Other
(11%) |
 Doral Growth
6
Segment
Results
1
Overview
Doral Growth generated a 1.2% Pre-Tax ROAA in Q1
Asset substitution has created a 3.59% NIM
Originated $260MM mortgages in Puerto Rico
US Assets grew by $103MM to $2.3B
US retail deposits grew by $148MM to $958MM
($MM)
1Q 13
Net Interest Income
$50.9
Non Interest Income
26.7
Total Net Revenue
$77.6
Non-Interest Expense
55.5
Pre-Tax, Pre-Provision Income
$22.1
Credit Provision
3.2
Pre-Tax Income
$18.9
Ratios:
NIM (bps)
359
Efficiency Ratio
72%
Average Assets
$6,363
Pre-Tax ROAA
1.2%
Loan Portfolio
$ MM
Loan Category
PR
US
Total
Residential
$2,321
$12
$2,333
CRE
1
685
686
C&I
14
1,436
1,450
Construction & Land
-
194
194
Consumer / Other
24
-
24
Total
$2,360
$2,327
$4,687
1
Includes Allocation of Administrative Expenses ( Corporate and Treasury)
(for additional details see exhibit B) |
 Doral
Recovery 7
Segment Results
Loan Portfolio
$ MM
Loan Category
Total
NPL
% NPL
Residential
$1,164
$400
34%
Commercial Real Estate
501
223
45%
Commercial
118
5
4%
Land & Construction
144
106
74%
Total
$1,927
$734
38%
($MM)
1Q 13
Net Interest Income
$9.8
Non Interest Income
(1.9)
Total Net Revenue
$8.0
Non-Interest Expense
19.8
Pre-Tax, Pre-Provision Income
$(11.8)
Credit Provision
15.6
Pre-Tax Income
$(27.4)
Ratios:
NIM (bps)
201
Efficiency Ratio
247%
Average Assets
$1,988
NPL %
38%
Overview
Established special servicing operation managing
~13,000 loans with a focus on cash collections.
62% of Total Loans are Performing
Many loans classified as NPL continue to make
payments. ~30% of NPLs made at least one payment
in the past 90 days.
1
1
Includes Allocation of Administrative Expenses ( Corporate and Treasury)
(for additional details see exhibit B) |
 Asset
Quality 8
NPL:
Adjusted
Coverage
Ratios
1
$ MM
UPB
Partial Charge-
Offs, Deferred
Fees and
Discounts
Recorded
Investment
ALLL
ALLL + Partial
Charge-Offs
Adjusted
Coverage
Ratio
Residential
$502.0
$65.4
$436.6
$90.9
$156.3
31.1%
Consumer
0.3
0.2
0.1
2.3
2.5
840.0%
CRE
274.0
50.7
223.3
17.0
67.7
24.7%
C&I
5.6
0.3
5.3
9.7
10.0
178.9%
C&L
186.6
77.4
109.2
5.3
82.7
44.3%
Total
$968.5
$194.0
$774.5
$125.2
$319.2
33.0%
1
Excludes Loans Held for Sale & FHA / VA Loans
2
UPB-
Partial Charge Offs
3
Adjusted Coverage ratio, (ALLL+Partial Charge Offs)/UPB
Valuation driven provision increased coverage ratios
Credit Provision Distribution by Portfolio
($MM)
Portfolio
Valuation
Delinquency
Total
Residential Mortgage
$4.0
$5.5
$9.5
Commercial
7.7
1.5
9.2
Total
$11.7
$7.0
$18.7
2
3 |
 9
Executive Summary
Asset Substitution strategy continues to deliver significant revenue gains.
Successfully established Doral Recovery special servicing operation.
Doral Growth is an attractive 1% Pre Tax Return on Asset business.
Reverse split underway to maintain NYSE compliance.
Leverage ratio of 9.26% continues to be in excess of regulatory requirements.
|
 Investor Relations Contact and Conference Replay Details
10
Investor Relations:
Christopher Poulton
212 / 329-3794
christopher.poulton@doralfinancial.com
Conference Call:
10.00 AM EDT May 9, 2013
(800) 398-9367 or (612) 332-0636
Conference Call Replay:
May 9, 2013 –
June 9, 2013
(800) 475-6701 or (320) 365-3844
Replay Code: 293013 |
 Exhibits |
 Exhibit A –
Financial Summary
12
($ MM)
31-Mar-13
31-Dec-12
30-Sep-12
30-Jun-12
31-Mar-12
Income Statement
Net Interest Income
60.7
56.8
56.2
54.8
52.7
Provision for Credit Losses
18.7
21.3
34.4
5.2
115.2
NII After Provisions
42.0
35.5
21.8
49.6
(62.5)
Non-Interest Income
24.8
29.7
20.0
20.4
15.7
Non-Interest Expense
75.3
87.1
73.8
70.8
63.3
Pre-Tax Income
(8.5)
(21.9)
(32.0)
(0.8)
(110.0)
Taxes
3.9
(50.2)
0.5
0.8
(112.6)
Net Income
(12.4)
28.3
(32.5)
(1.6)
2.6
Pre-Tax Pre-Provision Income
10.2
(0.6)
2.4
4.4
5.2
Balance Sheet
Total Gross Loans (incl. HFS)
$6,614
$6,613
$6,611
$6,487
$6,355
Loan Loss Reserves
125
135
146
153
167
Total Deposits
4,783
4,628
4,614
4,538
4,560
Total Assets
8,369
8,478
8,371
8,345
8,093
Profitability Metrics
Net Interest Margin
3.31%
2.97%
2.95%
2.91%
2.83%
Capital & Credit Ratios
NPL / Loans¹
12.3%
12.2%
11.5%
11.4%
12.1%
Leverage Ratio
9.26%
9.39%
9.32%
9.92%
10.19%
1
Excludes
Loans
Held
for
Sale
and
Residential
loans
guaranteed
by
FHA
/
VA; |
 13
($ MM)
PR
US
Doral Growth¹
Recovery
Corporate
Treasury
Total
Income Statement
Net Interest Income
$25.7
$25.3
$51.0
$9.8
$(0.1)
$0.0
$60.7
Non-Interest Income
23.9
2.0
25.9
(1.8)
0.0
0.8
24.8
Total Net Revenue
49.6
27.3
76.9
8.0
(0.1)
0.8
85.5
Non-Interest Expense
31.4
12.5
43.9
16.2
14.1
1.2
75.3
Pre-Tax , Pre Provision
Income
$18.2
$14.8
$33.0
$(8.2)
$(14.2)
$(0.3)
$10.2
Credit Provision
3.3
(0.2)
3.1
15.6
0.0
0.0
18.7
Pre-Tax Income
$14.9
$15.0
$29.9
$(23.8)
$(14.2)
$(0.3)
$(8.5)
Allocation of Corporate &
Treasury
Adjusted Revenue
0.7
0.0
0.1
(0.8)
0.0
Adjusted Non Interest
Expense
11.6
3.7
(14.1)
(1.2)
0.0
Adjusted Pre-Tax Income
$18.9
$(27.4)
$0.0
$0.0
$(8.5)
Exhibit B –
Segment Reconciliation
1
Doral Growth is the sum of PR and US |