Attached files
| file | filename |
|---|---|
| EX-10.3 - EXHIBIT 10.3 - BRINKS CO | ex10_3.htm |
| EX-10.1 - EXHIBIT 10.1 - BRINKS CO | ex10_1.htm |
| EX-10.4 - EXHIBIT 10.4 - BRINKS CO | ex10_4.htm |
| EX-10.2 - EXHIBIT 10.2 - BRINKS CO | ex10_2.htm |
| 8-K - FORM 8-K - BRINKS CO | form_8k.htm |

The Brink’s Company
Investor Overview
Investor Overview
NYSE:BCO
May 9, 2013
EXHIBIT 99.1

Forward-Looking Statements
This presentation, including questions and answers, contains forward-looking
information within the meaning of the Private Securities Litigation Reform Act
of 1995. Actual results could differ materially from projected results.
Additional information regarding factors that could affect financial
performance is in our press release dated April 25, 2013, and in our filings with
the Securities and Exchange Commission, including our most recent forms 10-K
and 10-Q. Unless otherwise noted herein, information included in this
presentation is representative as of today only and the company assumes no
obligation to update any forward-looking statements.
2

Today’s Presentation
¢ Business Overview
¢ Growth Opportunities

4
¢ Premier Brand
¢ Safety, security, service, trust
¢ Global Footprint
¢ Unique operational advantage
¢ Supports high-value Global Services business
¢ Market Fundamentals
¢ Cash growing worldwide
¢ Increased outsourcing
¢ Dangerous world
¢ Economic recovery, interest rates
¢ Growth Opportunities
¢ Maximize profits in developed markets
¢ Expand in emerging markets
¢ Invest in solutions and adjacent markets
Investment Highlights
4
5
¢ World’s Largest Secure Logistics Company
¢ 2012 Revenue $3.8 billion
¢ Premier global brand
¢ Customers in more than 100 countries
¢ ~70,000 employees; 1,100 facilities and 13,000
vehicles
vehicles
¢ Global Cash-In-Transit (CIT) network supports
growth in High-Value Services
growth in High-Value Services
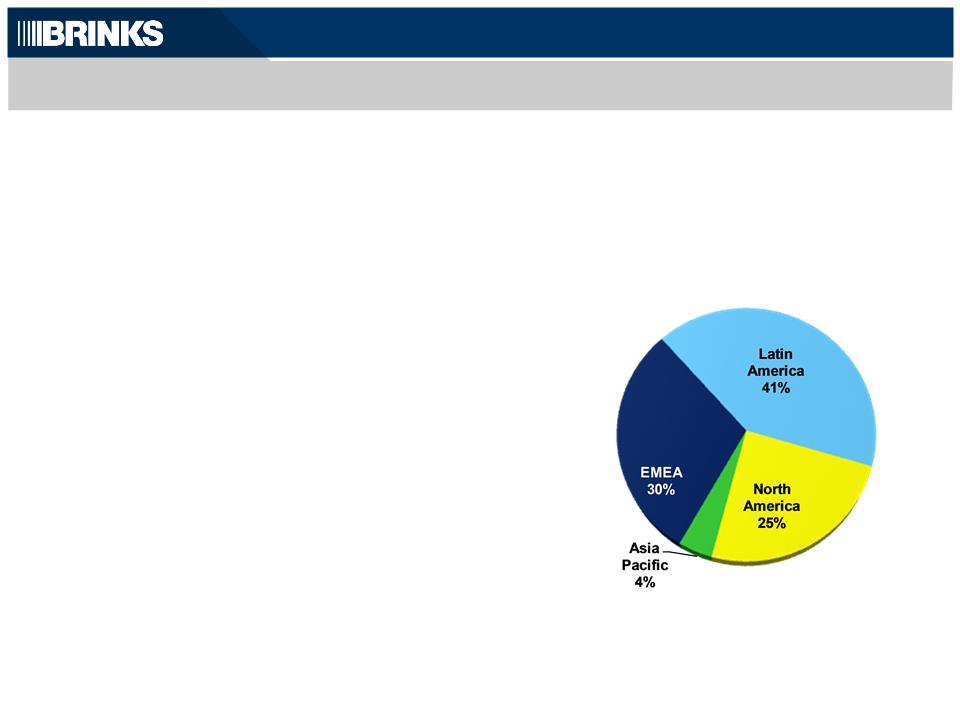
Company Snapshot
2012 Revenue
($3.8 billion)
5
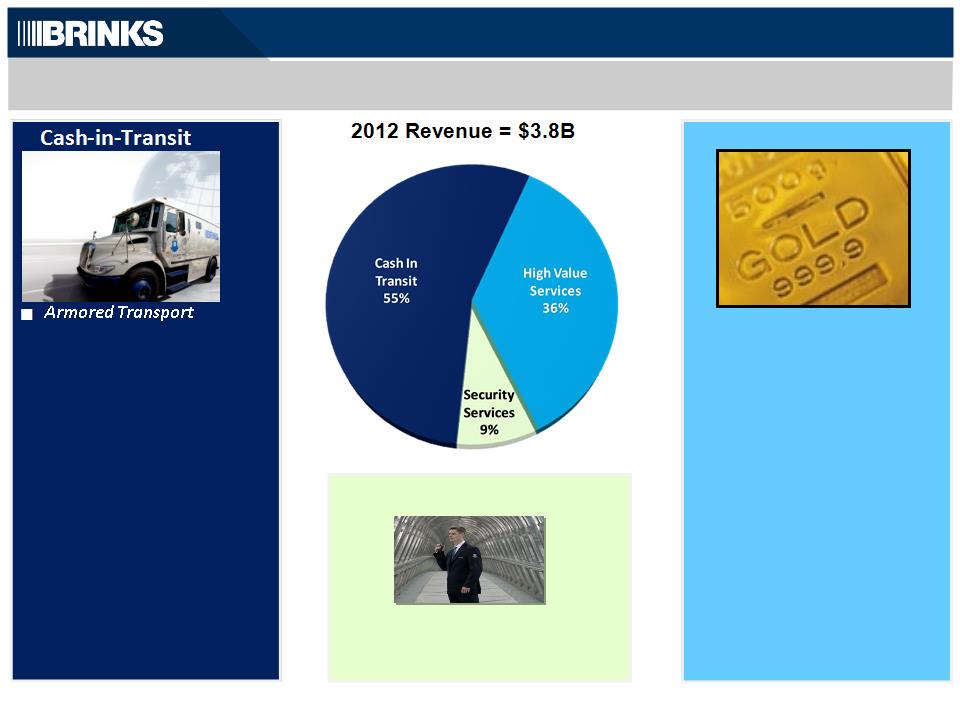
Diverse Business Lines: CIT Drives High-Value Services
– Cash, coins, checks and
other valuables; ATM
services
other valuables; ATM
services
¢ Global Infrastructure
– Supports Global Services
and Cash Logistics
and Cash Logistics
High-Value Services
¢ Global Services
– Secure long-distance
transport of valuables
transport of valuables
¢ Cash Logistics
– Money processing
– Vaulting
– CompuSafe® Service
¢ Adjacencies
– Payment Services
– Commercial Security
Security Services
6
¢ Guarding in select countries
– Airports, embassies
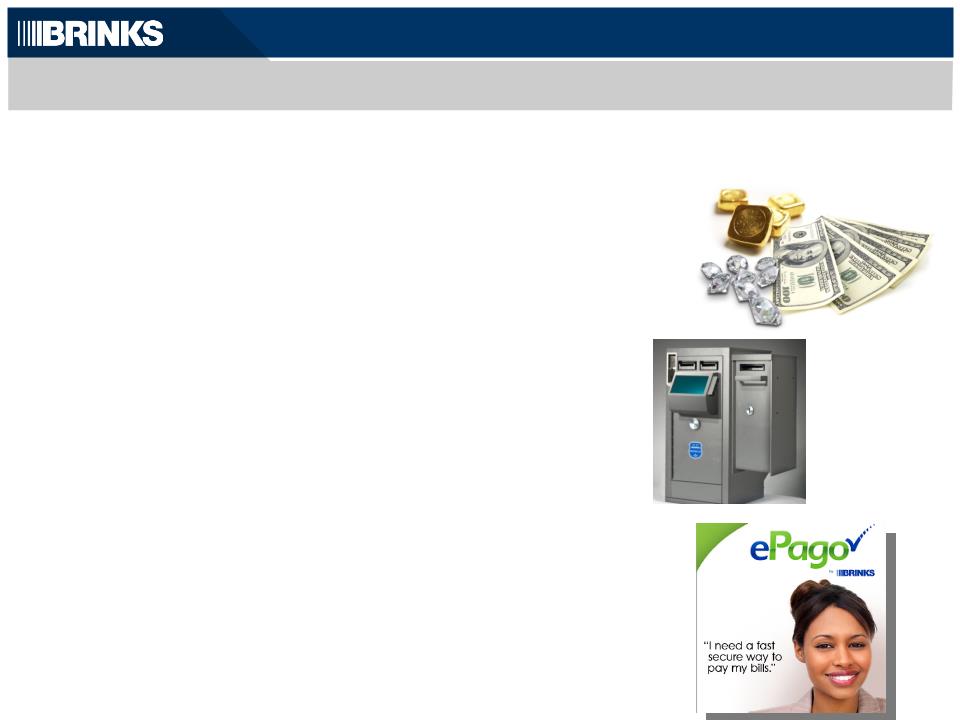
High-Value Services…High-Margin Solutions
CIT Footprint Supports High-Value Services
¢ Global Services
¢ Secure Logistics of valuables over long distances
¢ Diamonds, jewelry, banknotes, precious metals
¢ 12,000 Customers… 5,000 Cities… 1,400 daily shipments
¢ Cash Logistics
¢ Money Processing
¢ Vaulting
¢ CompuSafe® Service
¢ Adjacent Services
¢ Extending our brand into new markets
¢ Payment Processing
¢ Brink’s Money Payroll Card
7
8
¢ Maximize profits in developed markets
¢ EMEA, North America
¢ Invest in growth opportunities
¢ Emerging markets:
BRIC, LATAM, Asia-Pacific
BRIC, LATAM, Asia-Pacific
¢ High-Value Services:
Global Services, Cash Logistics ATM Services
Global Services, Cash Logistics ATM Services
¢ Adjacencies:
Payment Processing
Payment Processing
Brink’s Money Payroll Card
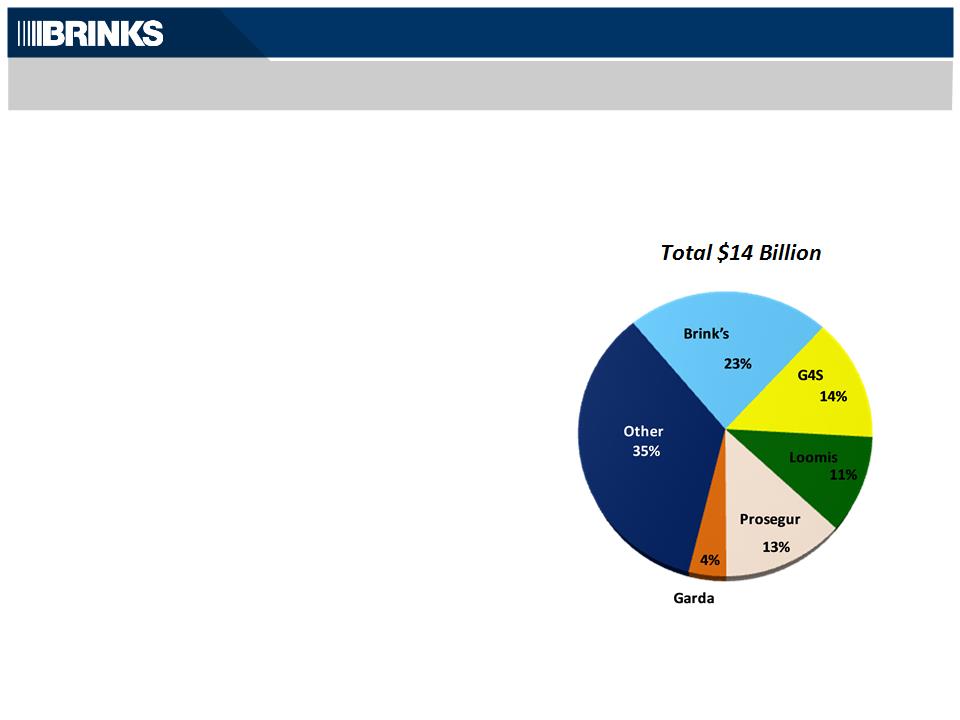
Global Secure Logistics
Market
Market
Source: Internal Company Estimates based fiscal year 2011 data
Global Leader…Global Growth Strategy
8
Leading Share in Fragmented Market
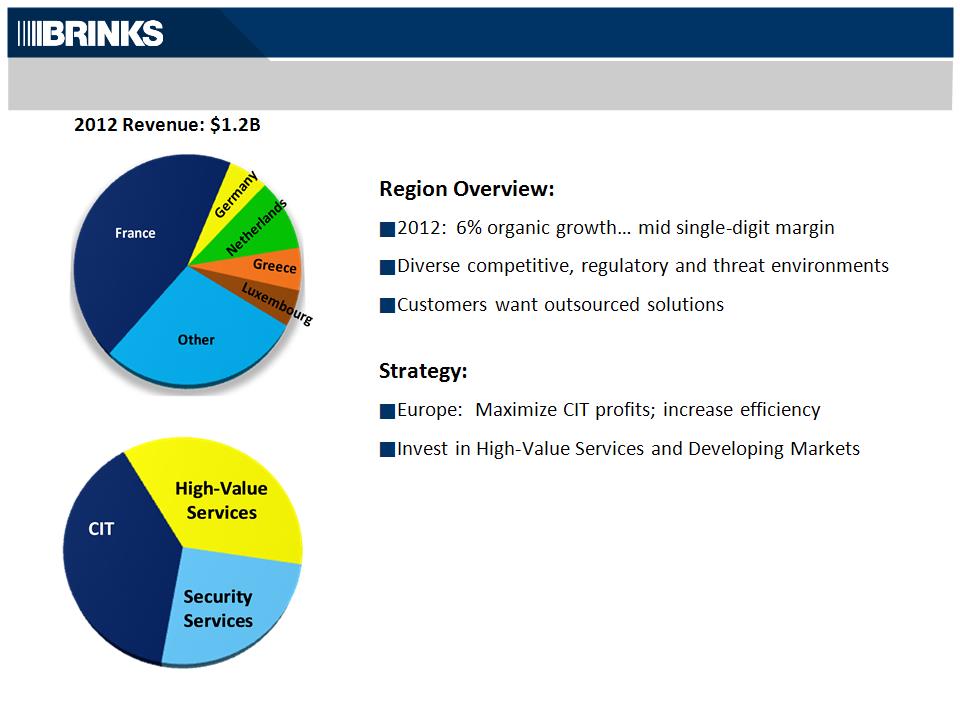
EMEA: Improve Operating Performance
9
2012 Revenue: $945M
Region Overview:
¢ Market leader
¢ 2012: Organic revenue down… 4.4% margin
¢ Volume and price pressure
Strategy:
¢ Maximize CIT profits ─ reduce costs, improve processes
¢ Remain disciplined on price, service and security
¢ Shift mix to High-Value Services
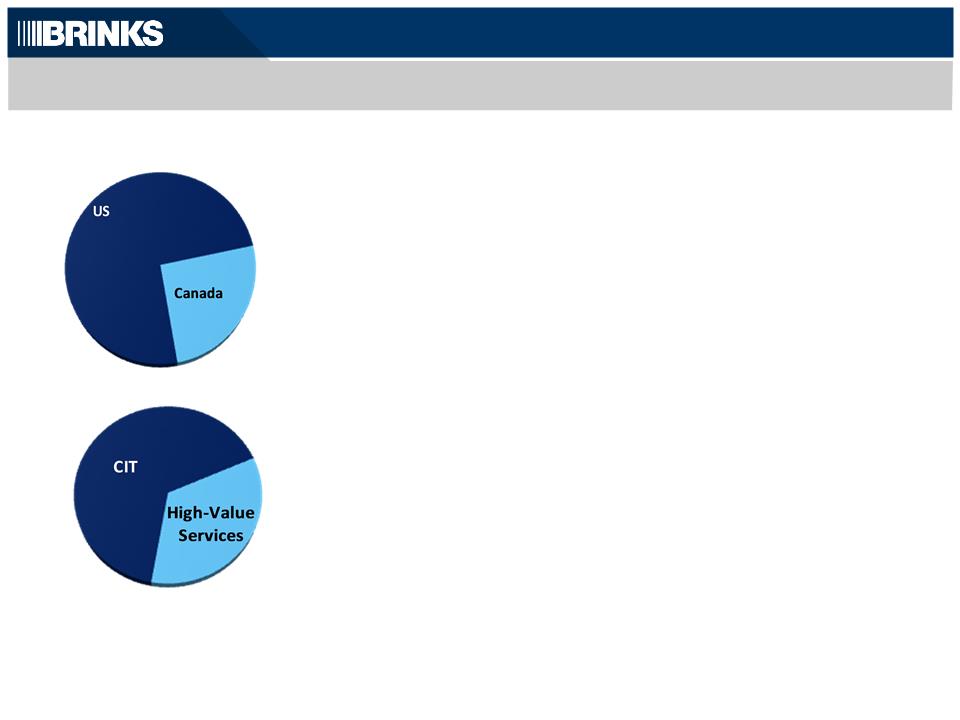
North America: Maximize CIT…Grow High-Value Services
10
Note: Segment margin is calculated on Non-GAAP segment profit.
See Appendix for reconciliation to GAAP.
Region Overview:
¢ Growing economies
¢ High-risk threat environment…customers value security
¢ Growing need to protect product supply chains
¢ 2012: 15% organic growth
Strategy:
¢ Strengthen and expand footprint
¢ Leverage footprint to grow High-Value Services
¢ Mexico: Increase CIT margins, add High-Value Services
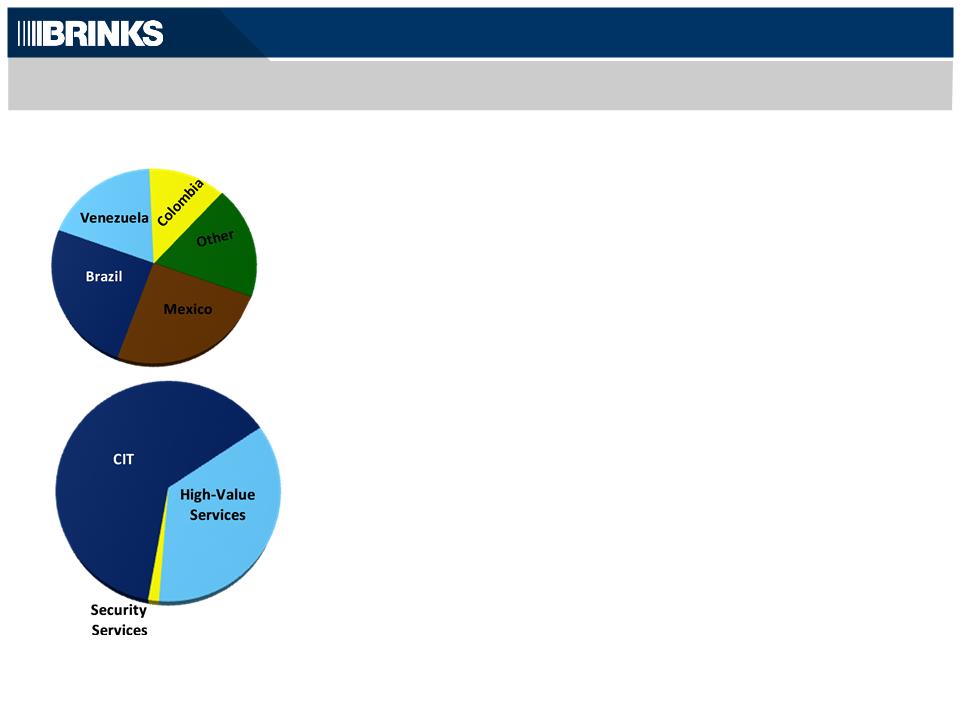
2012 Revenue: $1.6B
Latin America: Continued Strong Growth
11
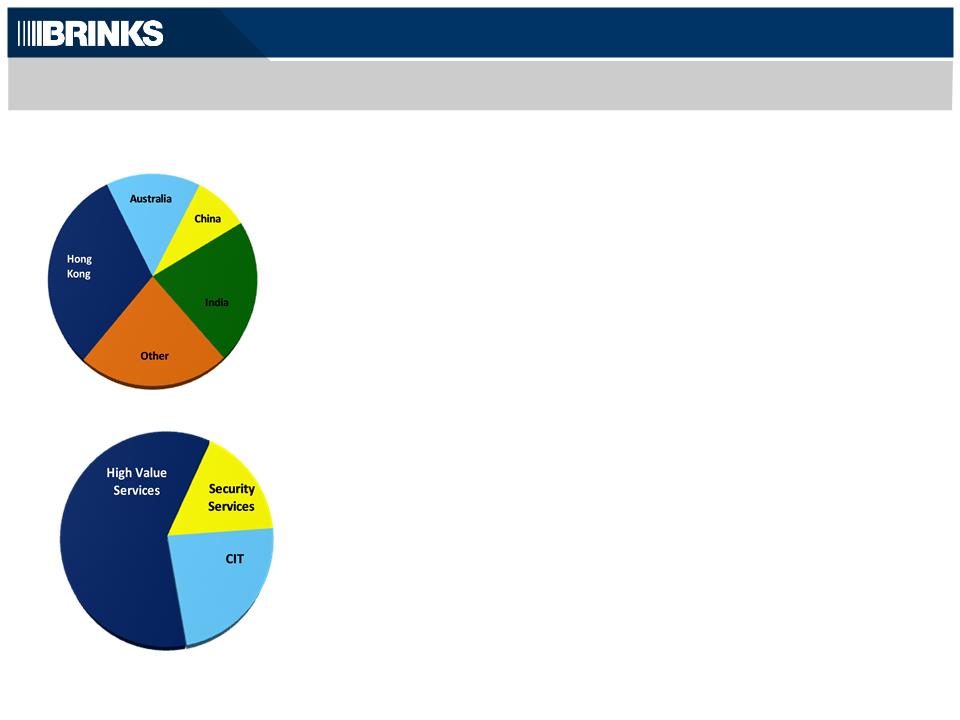
2012 Revenue: $159M
Region Overview:
¢ High-growth, service-driven economies
¢ Varying degrees of banking sophistication, gov’t restrictions
¢ 2012: 7% organic revenue growth
Strategy:
¢ Leverage Global Services network
¢ Accelerate China and India growth
¢ Expand commercial security capabilities
Asia Pacific: Invest and Grow
12

Financial Strength and Flexibility
n Solid Revenue Growth Outlook
n 5% - 8% organic growth in 2013
n Cash Flow Supports Continued Growth
n ~50% of Capex focused on Emerging
Markets and High-Value Services (’10 - ’12)
n Strong Balance Sheet
n Investment grade credit rating
n $336 million net debt; $386 million available
debt capacity (3/31/13)
debt capacity (3/31/13)
n Manageable cash outflow for legacy
liabilities (see appendix page 26)
liabilities (see appendix page 26)
13
Note: Net debt is a Non-GAAP measure.
See appendix for reconciliation to GAAP.

14
¢ Premier Brand
¢ Safety, security, service, trust
¢ Global Footprint
¢ Unique operational advantage
¢ Supports high-value Global Services business
¢ Market Fundamentals
¢ Cash growing worldwide
¢ Increased outsourcing
¢ Dangerous world
¢ Economic recovery, interest rates
¢ Growth Opportunities
¢ Maximize profits in developed markets
¢ Expand in emerging markets
¢ Invest in solutions and adjacent markets
Investment Highlights
14

Appendix

Appendix
Page
3-Year Non-GAAP Revenue Growth .........................................................................17
3-Year Non-GAAP Operating Profit ..........................................................................18
Summary of 2013 Revenue and Segment Margin Outlook .....................................19
Reconciliation to Amounts Reported under GAAP .................................................20
2012 Segment Results, GAAP and non-GAAP ..........................................................24
Legacy Liabilities ........................................................................................................26
16
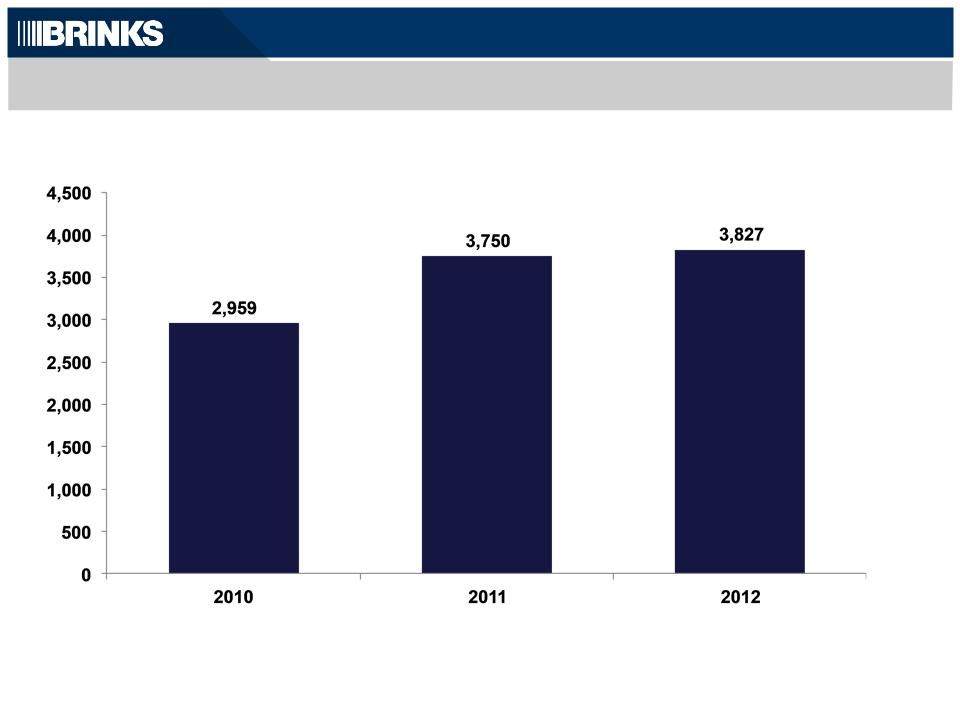
Non-GAAP Revenue (1)
($MM)
(1) Non-GAAP financial information is reconciled to amounts reported under U.S. GAAP on pages 20, 21 & 22.
Non-GAAP Revenue Growth
17
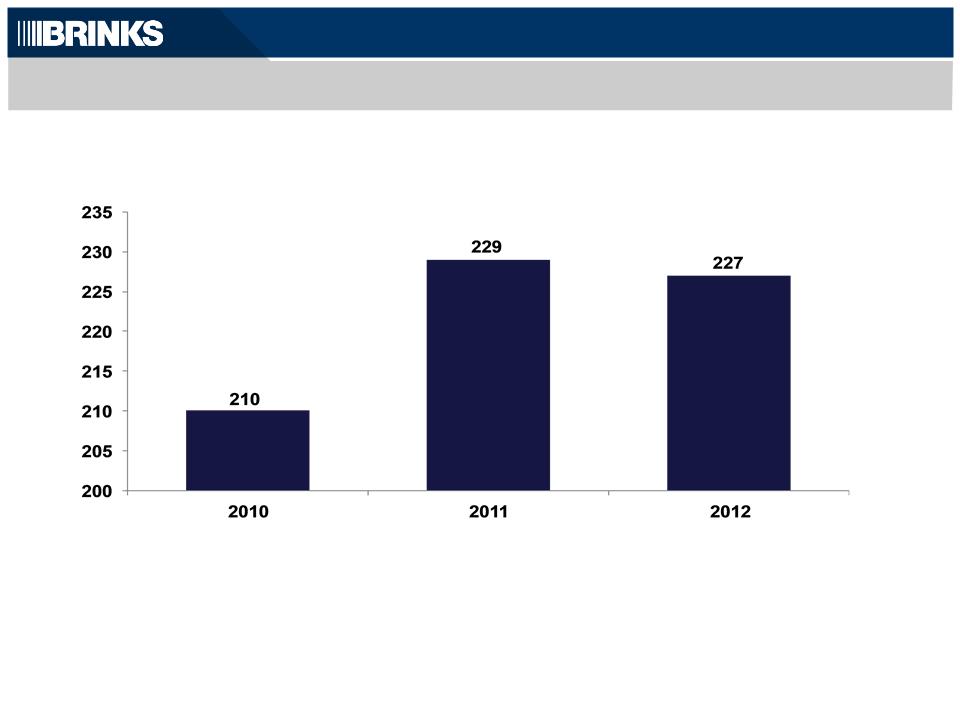
Total Non-GAAP Operating Profit (1)
($MM)
|
Segment
|
247
|
270
|
270
|
|
Non-Segment
|
(36)
|
(41)
|
(42)
|
|
Total
|
210
|
229
|
227
|
(1) Non-GAAP financial information is reconciled to amounts reported under U.S. GAAP on pages 20, 21 & 22.
Non-GAAP Profit Growth
Amounts may not add due to rounding
18
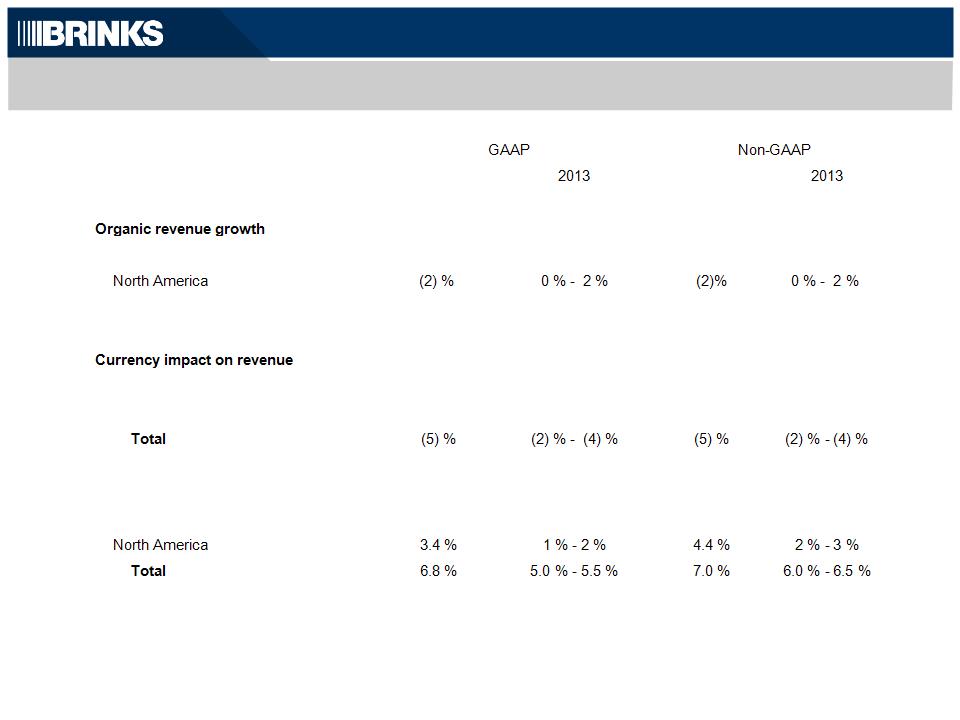
Summary of 2013 Revenue and Segment Margin Outlook (1)
19
|
|
|
|
|
|
|
|
|
||||||
|
|
|
|
|
|
|
|
|
|
|
|
|
||
|
|
|
|
|
|
2012
|
|
Estimate
|
|
|
|
2012
|
|
Estimate
|
|
|
|
|
|
|
|
|
|
|
|
|
|||
|
|
International
|
|
|
11 %
|
|
7 % - 9 %
|
|
|
|
11 %
|
|
7 % - 9 %
|
|
|
|
|
|
|
|
|
|
|
||||||
|
|
|
Total
|
|
|
7 %
|
|
5 % - 8 %
|
|
|
|
7 %
|
|
5 % - 8 %
|
|
|
|
|
|
|
|
|
|
|
|
|
|
|
|
|
|
|
|
|
|
|
|
|
|
|
|
|||
|
|
International
|
|
|
(7) %
|
|
(3) % - (5) %
|
|
|
|
(7) %
|
|
(3) % - (5) %
|
|
|
|
North America
|
|
|
flat
|
|
flat
|
|
|
|
flat
|
|
flat
|
|
|
|
|
|
|
|
|
|
|
|
|||||
|
|
|
|
|
|
|
|
|
|
|
|
|
|
|
|
Segment margin
|
|
|
|
|
|
|
|
|
|
|
|
||
|
|
International
|
|
|
7.9 %
|
|
6.0 % - 7.0 %
|
|
|
|
7.9 %
|
|
7.0 % - 8.0 %
|
|
|
|
|
|
|
|
|
|
|
||||||
|
|
|
|
|
|
|
|
|
|
|||||
|
|
|
|
|
|
|
|
|
|
|
|
|
|
|
(1) As of April 25, 2013

Non-GAAP Results - Reconciled to Amounts Reported under GAAP
20
Non-GAAP results described in this presentation are financial measures that are not required by, or presented in accordance with generally accepted accounting principles
(“GAAP”).
(“GAAP”).
Purpose of Non-GAAP Information
The purpose of the non-GAAP information is to report our financial information
• excluding retirement expenses related to frozen retirement plans and retirement plans from former operations, and
• without certain income and expense items described below in 2010, 2011 and 2012.
The non-GAAP information provides information to assist comparability and estimates of future performance. We believe these measures are helpful in assessing the
performance of our ongoing operations, estimating future results and enabling period-to-period comparability of financial performance. The valuation impact of our legacy
liabilities and related cash outflows can be assessed on a basis that is separate and distinct from ongoing operations. Non-GAAP results should not be considered as an
alternative to revenue, income or earnings per share amounts determined in accordance with GAAP and should be read in conjunction with their GAAP counterparts.
(a) To eliminate results of additional European operations we intend to exit in 2013. Operations do not currently meet requirements to be classified as discontinued operations.
(b) To eliminate gains on acquisitions and dispositions as follows:
|
|
|
|
2012
|
|
2011
|
|
2010
|
|
|
|
Sale of real estate in Venezuela
|
$
|
(7)
|
|
-
|
|
-
|
|
|
|
Sale of U.S. Document Destruction business
|
|
-
|
|
(7)
|
|
-
|
|
|
|
Bargain Purchase of Mexican CIT business
|
|
-
|
|
(2)
|
|
(5)
|
|
|
|
Impairment of Cost Method Investment-Mexico
|
|
-
|
|
-
|
|
14
|
|
|
|
Other gains/losses on acquisitions/dispositions-
Segment |
|
(2)
|
|
-
|
|
-
|
|
|
|
Other gains/losses on acquisitions/dispositions-
NonSegment |
|
(1)
|
|
-
|
|
-
|
|
|
|
Selling costs related to acquisitions/dispositions
|
|
1
|
|
-
|
|
-
|
|
|
|
Sale of former operating assets
|
|
-
|
|
(1)
|
|
-
|
|
|
|
|
$
|
(9)
|
|
(10)
|
|
9
|
|
(c) To eliminate employee benefit settlement and acquisition-related severance losses (Mexico and Argentina). Employee termination benefits in Mexico are accounted for
under FASB ASC Topic 715, Compensation - Retirement Benefits.
under FASB ASC Topic 715, Compensation - Retirement Benefits.
(d) To eliminate the costs related to the retirement of the former chief executive officer.
(e) To eliminate expenses related to U.S. retirement plans.
(f) To reverse remeasurement gains and losses in Venezuela. For accounting purposes, Venezuela is considered a highly inflationary economy. Under U.S. GAAP,
subsidiaries that operate in Venezuela record gains and losses in earnings for the remeasurement of bolivar fuerte-denominated net monetary assets.
subsidiaries that operate in Venezuela record gains and losses in earnings for the remeasurement of bolivar fuerte-denominated net monetary assets.
(g) To eliminate royalty income from former home security business.
See page 20 for explanation of footnotes
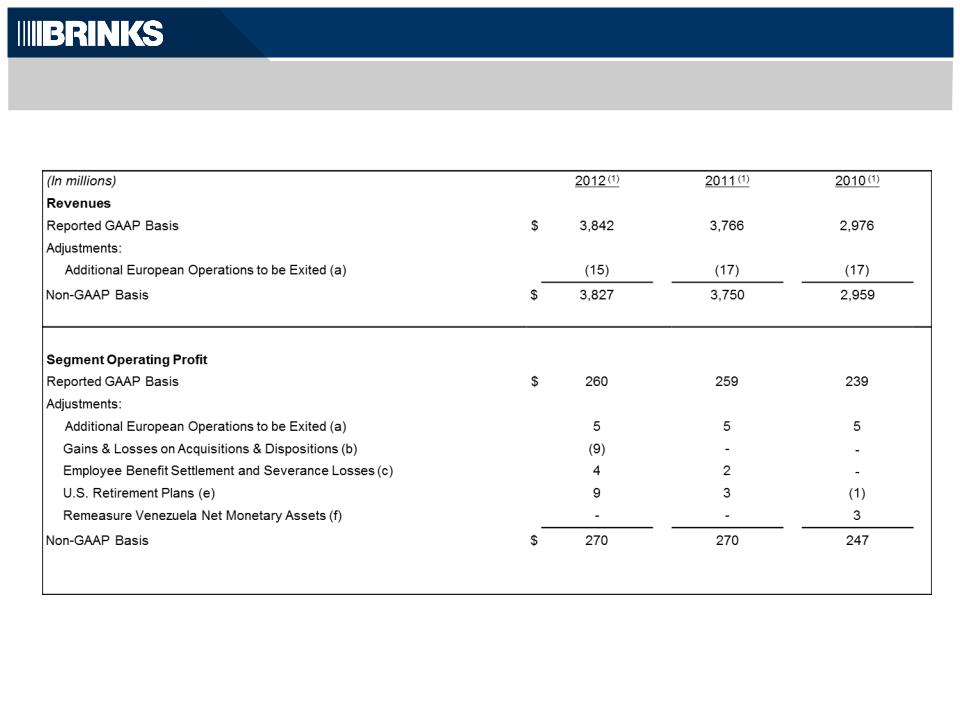
(1) The amounts presented for Non-GAAP Revenues and Segment Operating Profit have been updated to reflect additional European operations that we
expect to exit in 2013.
Reconciliation
Amounts may not add due to rounding
Non-GAAP Results - Reconciled to Amounts Reported under GAAP (Cont.)
21

|
(In millions)
|
|
2012
|
2011
|
2010
|
|||
|
Non-Segment
|
|
|
|
|
|
|
|
|
Reported GAAP Basis
|
$
|
(89)
|
|
(60)
|
|
(63)
|
|
|
Adjustments:
|
|
|
|
|
|
|
|
|
Gains & Losses on Acquisitions and Asset Dispositions (b)
|
|
(1)
|
|
(10)
|
|
9
|
|
|
CEO Retirement cost (d)
|
|
-
|
|
4
|
|
-
|
|
|
U.S. Retirement Plans (e)
|
|
47
|
|
25
|
|
23
|
|
|
Royalty from BHS (g)
|
|
-
|
|
-
|
|
(5)
|
|
|
Non-GAAP Basis
|
$
|
(42)
|
|
(41)
|
|
(36)
|
|
|
|
|
|
|
|
|
|
|
|
|
|
|
|
|
|
|
|
|
Total Operating Profit
|
|
|
|
|
|
|
|
|
Reported GAAP Basis
|
$
|
171
|
|
200
|
|
177
|
|
|
Adjustments:
|
|
|
|
|
|
|
|
|
Additional European Operations to be Exited (a)
|
|
5
|
|
5
|
|
5
|
|
|
Gains & Losses on Acquisitions and Asset Dispositions (b)
|
|
(9)
|
|
(10)
|
|
9
|
|
|
Employee Benefit Settlement & Severance Losses (c)
|
|
4
|
|
2
|
|
-
|
|
|
CEO Retirement Cost(d)
|
|
-
|
|
4
|
|
-
|
|
|
U.S. Retirement Plans (e)
|
|
56
|
|
28
|
|
22
|
|
|
Remeasure Venezuela Net Monetary Assets (f)
|
|
-
|
|
-
|
|
3
|
|
|
Royalty from BHS (g)
|
|
-
|
|
-
|
|
(5)
|
|
|
Non-GAAP Basis
|
$
|
227
|
|
229
|
|
210
|
|
|
|
|
|
|
|
|
|
|
See page 20 for explanation of footnotes
Reconciliation
Amounts may not add due to rounding
Non-GAAP Results - Reconciled to Amounts Reported under GAAP (Cont.)
22

Net Debt
|
|
|
March 31,
|
|
December 31,
|
|
|
|
2013
|
|
2012
|
|
Debt:
|
|
|
|
|
|
Short-term
|
$
|
71.1
|
|
26.7
|
|
Long-term
|
|
438.6
|
|
362.6
|
|
Total Debt
|
|
509.7
|
|
389.3
|
|
|
|
|
|
|
|
Cash and cash equivalents
|
|
234.8
|
|
201.7
|
|
Less amounts held by Cash Management Services operations (a)
|
|
(60.6)
|
|
(44.0)
|
|
Cash and cash equivalents available for general corporate purposes
|
|
174.2
|
|
157.7
|
|
|
|
|
|
|
|
Net Debt
|
$
|
335.5
|
|
231.6
|
(a) Title to cash received and processed in certain of our secure Cash Management Services operations transfers to us for a short
period of time. The cash is generally credited to customers’ accounts the following day and we do not consider it as available
for general corporate purposes in the management of our liquidity and capital resources and in our computation of Net Debt.
period of time. The cash is generally credited to customers’ accounts the following day and we do not consider it as available
for general corporate purposes in the management of our liquidity and capital resources and in our computation of Net Debt.
Net Debt is a supplemental financial measure that is not required by, or presented in accordance with GAAP. We use Net Debt as a
measure of our financial leverage. We believe that investors also may find Net Debt to be helpful in evaluating our financial leverage.
measure of our financial leverage. We believe that investors also may find Net Debt to be helpful in evaluating our financial leverage.
Net Debt should not be considered as an alternative to Debt determined in accordance with GAAP and should be reviewed in
conjunction with our consolidated balance sheets. Set forth above is a reconciliation of Net Debt, a non-GAAP financial measure, to
Debt, which is the most directly comparable financial measure calculated and reported in accordance with GAAP. Net Debt excluding
cash and debt in Venezuelan operations was $395 million at March 31, 2013, and $280 million at December 31, 2012.
NET DEBT RECONCILED TO AMOUNTS REPORTED UNDER GAAP
(in millions)
23

2012 Segment Results, GAAP
|
|
|
|
|
|
||||||||||
|
|
|
|
|
Organic
|
|
Acquisitions/
|
|
Currency
|
|
|
|
|
|
|
|
|
|
2011
|
|
Change
|
|
Dispositions (b)
|
|
(c)
|
|
2012
|
|
Total
|
|
Organic
|
|
Revenues:
|
|
|
|
|
|
|
|
|
|
|
|
|
|
|
|
Latin America
|
$
|
1,461
|
|
215
|
|
2
|
|
(98)
|
|
1,579
|
|
8%
|
|
15%
|
|
EMEA
|
|
1,178
|
|
70
|
|
-
|
|
(90)
|
|
1,158
|
|
(2)%
|
|
6%
|
|
Asia Pacific
|
|
154
|
|
10
|
|
-
|
|
(5)
|
|
159
|
|
3%
|
|
7%
|
|
International
|
|
2,792
|
|
296
|
|
2
|
|
(193)
|
|
2,897
|
|
4%
|
|
11%
|
|
North America
|
|
974
|
|
(24)
|
|
(3)
|
|
(3)
|
|
945
|
|
(3)%
|
|
(2)%
|
|
Total
|
$
|
3,766
|
|
272
|
|
(1)
|
|
(196)
|
|
3,842
|
|
2%
|
|
7%
|
|
Operating profit:
|
|
|
|
|
|
|
|
|
|
|
|
|
|
|
|
International
|
$
|
288
|
|
17
|
|
(2)
|
|
(15)
|
|
228
|
|
-
|
|
7%
|
|
North America
|
|
31
|
|
1
|
|
-
|
|
-
|
|
33
|
|
4%
|
|
3%
|
|
Segment operating profit
|
|
259
|
|
18
|
|
(2)
|
|
(15)
|
|
260
|
|
-
|
|
7%
|
|
Non-segment (a)
|
|
(60)
|
|
(21)
|
|
(8)
|
|
-
|
|
(89)
|
|
49%
|
|
35%
|
|
Total
|
$
|
200
|
|
(3)
|
|
(11)
|
|
(15)
|
|
171
|
|
(14)%
|
|
(1)%
|
|
|
|
|
|
|
|
|
|
|
|
|
|
|
|
|
|
Segment operating margin:
|
|
|
|
|
|
|
|
|
|
|
|
|
|
|
|
International
|
|
8.2%
|
|
|
|
|
|
|
|
7.9%
|
|
|
|
|
|
North America
|
|
3.2%
|
|
|
|
|
|
|
|
3.4%
|
|
|
|
|
|
Segment operating margin
|
|
6.9%
|
|
|
|
|
|
|
|
6.8%
|
|
|
|
|
Full Year 2012 vs. 2011
(In millions)
Segment Results - GAAP
See footnotes on page 25.
24
Amounts may not add due to rounding

2012 Segment Results, non-GAAP
|
|
|
|
|
|
||||||||||
|
(In millions)
|
|
|
|
Organic
|
|
Acquisitions/
|
|
Currency
|
|
|
|
|
|
|
|
|
|
2011
|
|
Change
|
|
Dispositions (b)
|
|
(c)
|
|
2012
|
|
Total
|
|
Organic
|
|
Revenues:
|
|
|
|
|
|
|
|
|
|
|
|
|
|
|
|
Latin America
|
$
|
1,461
|
|
215
|
|
2
|
|
(98)
|
|
1,579
|
|
8%
|
|
15%
|
|
EMEA
|
|
1,161
|
|
70
|
|
-
|
|
(89)
|
|
1,143
|
|
(2)%
|
|
6%
|
|
Asia Pacific
|
|
154
|
|
10
|
|
-
|
|
(5)
|
|
159
|
|
3%
|
|
7%
|
|
International
|
|
2,776
|
|
296
|
|
2
|
|
(192)
|
|
2,881
|
|
4%
|
|
11%
|
|
North America
|
|
974
|
|
(24)
|
|
(3)
|
|
(3)
|
|
945
|
|
(3)%
|
|
(2)%
|
|
Total
|
$
|
3,750
|
|
272
|
|
(1)
|
|
(194)
|
|
3,827
|
|
2%
|
|
7%
|
|
Operating profit:
|
|
|
|
|
|
|
|
|
|
|
|
|
|
|
|
International
|
$
|
235
|
|
8
|
|
1
|
|
(15)
|
|
228
|
|
(3)%
|
|
3%
|
|
North America
|
|
35
|
|
7
|
|
-
|
|
-
|
|
41
|
|
19%
|
|
19%
|
|
Segment operating profit
|
|
270
|
|
14
|
|
1
|
|
(15)
|
|
270
|
|
-
|
|
5%
|
|
Non-segment (a)
|
|
(41)
|
|
(2)
|
|
-
|
|
-
|
|
(42)
|
|
4%
|
|
4%
|
|
Total
|
$
|
229
|
|
13
|
|
1
|
|
(15)
|
|
227
|
|
(1)%
|
|
5%
|
|
|
|
|
|
|
|
|
|
|
|
|
|
|
|
|
|
Segment operating margin:
|
|
|
|
|
|
|
|
|
|
|
|
|
|
|
|
International
|
|
8.5%
|
|
|
|
|
|
|
|
7.9%
|
|
|
|
|
|
North America
|
|
3.6%
|
|
|
|
|
|
|
|
4.4%
|
|
|
|
|
|
Segment operating margin
|
|
7.2%
|
|
|
|
|
|
|
|
7.0%
|
|
|
|
|
(a) Includes income and expense not allocated to segments.
(b) Includes operating results and gains/losses on acquisitions, sales and exit of businesses.
(c) Revenue and Segment Operating Profit: The “Currency” amount in the table is the summation of the monthly currency changes, plus (minus) the U.S.
dollar amount of remeasurement currency gains (losses) of bolivar fuerte-denominated net monetary assets recorded under highly inflationary accounting
rules related to the Venezuelan operations. The monthly currency change is equal to the Revenue or Operating Profit for the month in local currency, on a
country-by-country basis, multiplied by the difference in rates used to translate the current period amounts to U.S. dollars versus the translation rates used in
the year-ago month. The functional currency in Venezuela is the U.S. dollar under highly inflationary accounting rules. Remeasurement gains and losses
under these rules are recorded in U.S. dollars but these gains and losses are not recorded in local currency. Local currency Revenue and Operating Profit
used in the calculation of monthly currency change for Venezuela have been derived from the U.S. dollar results of the Venezuelan operations under U.S.
GAAP (excluding remeasurement gains and losses) using current period currency exchange rates.
Amounts may not add due to rounding
25
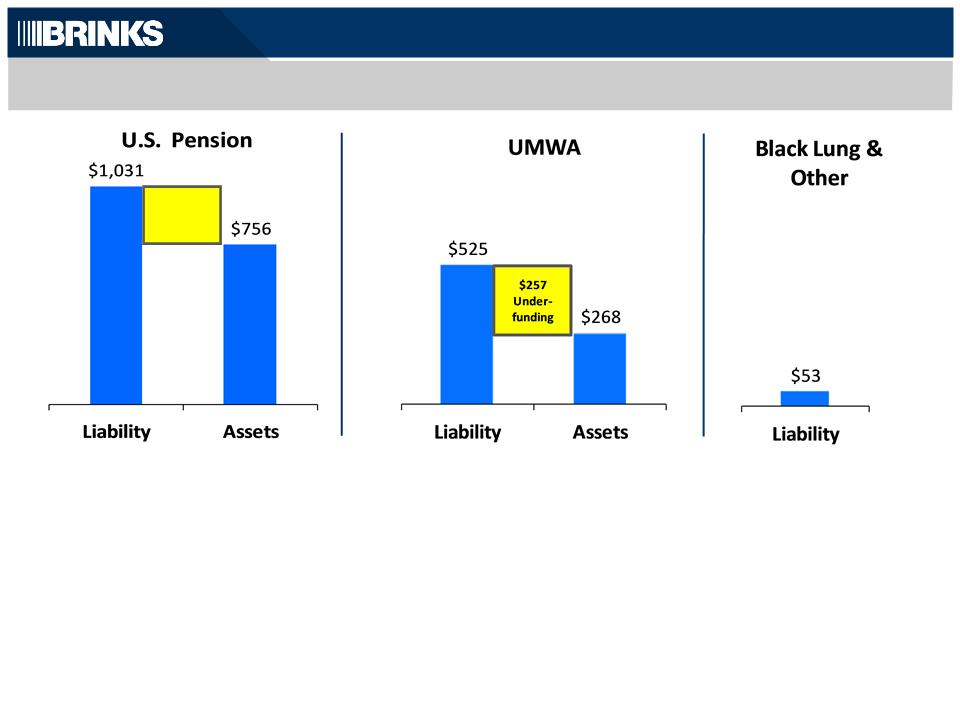
Legacy Liabilities
|
|
Estimated Contributions to U.S. Plans
|
|
||||||||||||
|
|
|
2012A
|
2013
|
2014
|
2015
|
2016
|
2017
|
|||||||
|
|
US Pension
|
$ 37
|
|
14
|
|
29
|
|
42
|
|
44
|
|
38
|
|
|
|
|
UMWA
|
0
|
|
0
|
|
0
|
|
0
|
|
0
|
|
0
|
|
|
|
|
Black Lung/Other
|
7
|
|
5
|
|
5
|
|
5
|
|
4
|
|
4
|
|
|
|
|
Total
|
$ 44
|
|
19
|
|
34
|
|
47
|
|
48
|
|
42
|
|
|
($ millions)
$275
Under-
funding
Under-
funding
Note: Above amounts based on actuarial assumptions at December 31, 2012.
26