Attached files
| file | filename |
|---|---|
| 8-K - FORM 8-K - HERITAGE FINANCIAL CORP /WA/ | d534195d8k.htm |
 Q2
2013
Investor
Presentation
Brian L. Vance
CEO & President
Exhibit 99.1
Heritage
Financial
Corporation |
 Forward
Looking Statement 2
This presentation contains forward-looking statements that are subject to
risks and uncertainties, including, but not limited to: The credit and
concentration risks of lending activities; Changes in general economic
conditions, either nationally or in our market areas; Competitive market
pricing factors and interest rate risks; Market interest rate
volatility; Balance sheet (for example, loans) concentrations;
Fluctuations in demand for loans and other financial services in our market
areas; Changes in legislative or regulatory requirements or the results
of regulatory examinations; The ability to recruit and retain key
management and staff; Risks associated with our ability to implement our
expansion strategy and merger integration; Stability of funding sources
and continued availability of borrowings; Adverse changes in the
securities markets; The inability of key third-party providers to
perform their obligations to us; Changes in accounting policies and
practices and the use of estimates in determining fair value of certain of our
assets, which estimates may prove to be incorrect and result in significant
declines in valuation; and These and other risks as may be detailed from
time to time in our filings with the Securities and Exchange
Commission.
The Company cautions readers not to place undue reliance on any
forward-looking statements. Moreover, you should treat these
statements as speaking only as of the date they are made and based only on information then actually known to the
Company. The Company does not undertake and specifically disclaims any
obligation to revise any forward-looking statements to
reflect
the
occurrence
of
anticipated
or
unanticipated
events
or
circumstances
after
the
date
of
such
statements.
These
risks could cause our actual results for 2013 and beyond to differ materially
from those expressed in any forward-looking statements by, or on
behalf of, us, and could negatively affect the Company’s operating and stock price performance. |
 Overview
•
Company Information
•
Financial Performance
•
Strategic Initiatives
3 |
 Company
Information 4 |
 Our
Market Area |
 2013
Announcements 6
•
January 9, 2013 –
Completed Merger with Northwest Commercial Bank
•
Results in an Auburn location, consolidation of Lakewood branches and $65
million in total assets. Completed systems conversion March 9,
2013. •
March 11, 2013 –
Announced Definitive Agreement to Acquire Valley Community
Bancshares, Inc.
•
9 branches in Pierce & King Counties and $234 million in total
assets •
Transaction is anticipated to close in Q3 2013 with conversion in October
2013
•
April 8, 2013 –
Heritage to Consolidate Bank Subsidiary
•
Central Valley Bank has been a wholly-owned subsidiary of Heritage
Financial Corporation for 14 years
•
Central Valley Bank will merge into Heritage Bank to gain efficiencies and as
a result of the President’s planned retirement in 2014
•
Merger anticipated to be completed in Q2 2013 with conversion in
October
2013 |
 Valley
Bank Transaction Overview Transaction Value:
Approximately $44.2 million (including cash out of stock options)
Offer Price Per Share:
$39.00
Consideration Mix:
50% of Valley shares exchanged for $19.50 cash
50% of Valley shares exchanged for 1.3611 HFWA shares
Stock Option Treatment:
In-the-money stock options cashed out (approximately $232
thousand) Board Representation:
One Valley Board member will join the Board of HFWA
Exchange Ratio:
Fixed exchange ratio
Collars:
A 20% collar above and below HFWA’s stock price of $14.33
Walk-away Provision:
If HFWA’s stock price drops below $11.46 HFWA has the option to fill with
cash or stock or walk-away
Termination Fee:
$1.76 million
Required Approvals:
Customary regulatory approvals and Valley shareholder approval
Expected Closing:
Q3 2013
7
Source: Company documents and SNL Financial. |
 Valley
Bank Transaction Overview Purchase Accounting Adjustments
(pre-tax): •
Estimated credit mark of 2.0% or ~$279 thousand
•
Estimated $1.5 million mark-up on real estate and other assets
•
Estimated core deposit intangible equaling 1.0% of Valley’s core deposits
(1)
Other Financial Impacts:
•
Estimated cost savings of between 45% and 50%
–
Phased-in 50% in 2013 and 100% in 2014
–
Assumes consolidation of four branches
•
Estimated after-tax deal related expenses of $2.0 million
8
(1)
Core deposits represent total deposits less total certificates
of deposit. |
 Valley
Bank Transaction Overview 9
•
Valley Bank has a history of strong and stable profitability with an average
ROAA of 0.97% over the past 5 years
•
Strong
asset
quality
has
been
maintained
throughout
the
economic
recession
•
Attractive low-cost funding mix (total cost of funds was 0.17% as of
12/31/2012) Overview:
Headquarters:
Year Established (BHC / Bank):
Number of Branches:
FTE:
Assets / FTE ($000s):
Puyallup, WA
1998 / 1972
9*
67
$3,615
Balance Sheet & Capital
Assets ($000s):
Deposits ($000s):
Gross Loans:
Loans / Deposits:
Securities / Assets:
TCE / TA:
Tier 1 Leverage Ratio:
$242,220
$212,501
$125,085
58.9%
25.9%
11.7%
11.2%
Profitability
ROAA:
ROAE:
Net Interest Margin:
Cost of Interest-Bearing Deposits:
Efficiency Ratio:
0.78%
6.57%
3.68%
0.25%
69.82%
Asset Quality
NPAs / Assets:
NPAs / (Loans + OREO):
Reserves / Loans:
Reserves / NPAs:
NCOs / Avg. Loans:
1.00%
1.93%
1.78%
91.94%
0.04%
Note: Consolidated Valley Community Bancshares, Inc. financials not publicly
available. *1 location is a drive-up facility only
FTE = Full-time employees
Source: SNL Financial & Valley Bank call report data as of and for the year
ended 12/31/2012. |
 Valley
Bank Transaction Overview 10
•
Valley has maintained strong asset quality throughout the economic downturn,
despite being located in a region that was not immune to the
recession Valley Net Charge-Off History
Cumulative net charge-offs since
2008 total $1.1 million |
 Valley
Bank Transaction Overview 11
Earnings Accretion & Return
(1)
:
2014 EPS Accretion:
2015 EPS Accretion:
IRR:
Tangible Book Value Earnback Period:
> 19%
> 24%
> 16%
<4.5 years, using incremental earnings
(2)
<1.5 years, on static basis
(3)
Capital Ratios (as of 03/31/13):
TCE / TA:
Leverage Ratio:
Tier 1 Ratio:
Total Risk-Based Capital Ratio:
13.0%
13.3%
17.8%
19.1%
12.2%
11.6%
20.1%
21.4%
11.7%
11.7%
16.4%
17.7%
Pro Forma
(1)
Based on internal earnings estimates
(2)
Incremental tangible book value earnback represents the number of years
to eliminate tangible book value dilution at closing utilizing just the incremental earnings
realized through the merger (it ignores HFWA stand alone earnings)
(3)
Static tangible book value earnback represents the number of years to eliminate
tangible book value dilution at closing utilizing combined pro forma earnings |
 Benefits of the Central Valley Bank Merger
12
•
Leadership transition
•
Operational efficiencies
•
Improved financial performance
•
Regulatory risks reduced
•
Improved shareholder value through
improved efficiencies |
 Financial Performance
13 |
 Balance
Sheet 14 |
 Total
Loan Portfolio 15
Financial data as of March 31, 2013 |
 Loan
Trends Net Loan Balance
16
2009
2010
2011
2012
Q1 2013
CAGR
Originated
Loans
$746.1
$720.0
$815.6
$855.4
$869.2
3.89%
Purchased
Covered
Loans
-
$128.7
$105.4
$84.0
$81.4
n/a
Purchased
Non-Covered
Loans
-
$131.0
$83.5
$59.0
$104.9
n/a
Total
$746.1
$979.8
$1,004.5
$998.4
$1,055.5
9.06%
Dollars in millions |
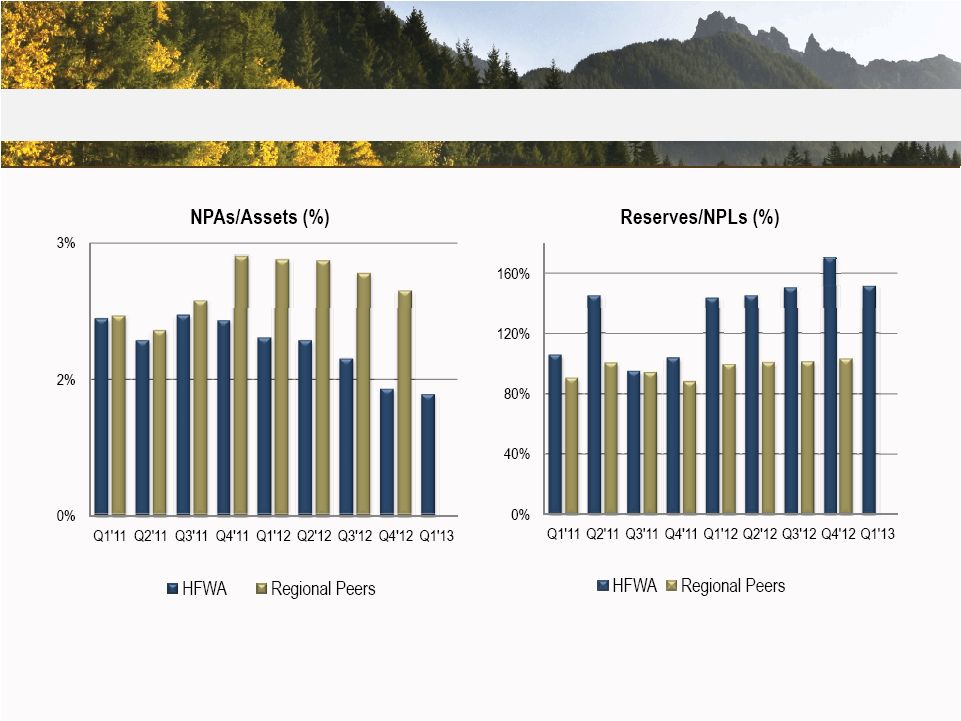 Credit
Quality 17
* HFWA ratios relate to originated loan portfolios only. Regional Peer data not
available for Q1’13 Regional
Peer
Group
(10):
Ticker
Symbols
–
BANR,
CACB,
COLB,
FFNW,
HOME,
NRIM,
PCBK,
RVSB,
TSBK,
WBCO
Source: SNL Financial |
 Deposit
Base 18
Financial data as of and for the quarter ending March 31, 2013.
|
 Deposit
Growth 19 |
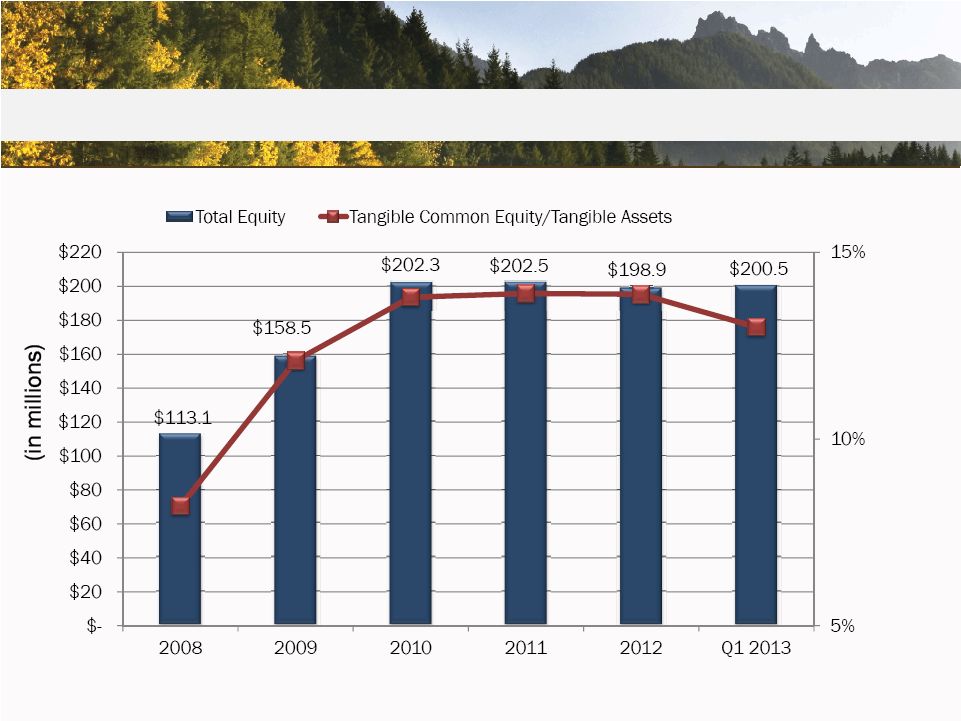 Equity
20
*After the anticipated acquisition of Valley Bank Tangible Common
Equity/Tangible Assets is estimated to be 11.7% |
 Earnings
21
*Includes after-tax gain of $7.7 million for FDIC-assisted bank
acquisitions. |
 Diluted
Earnings Per Share 22
*Includes $0.69 earnings per share related to the after-tax gain on
FDIC-assisted acquisitions. |
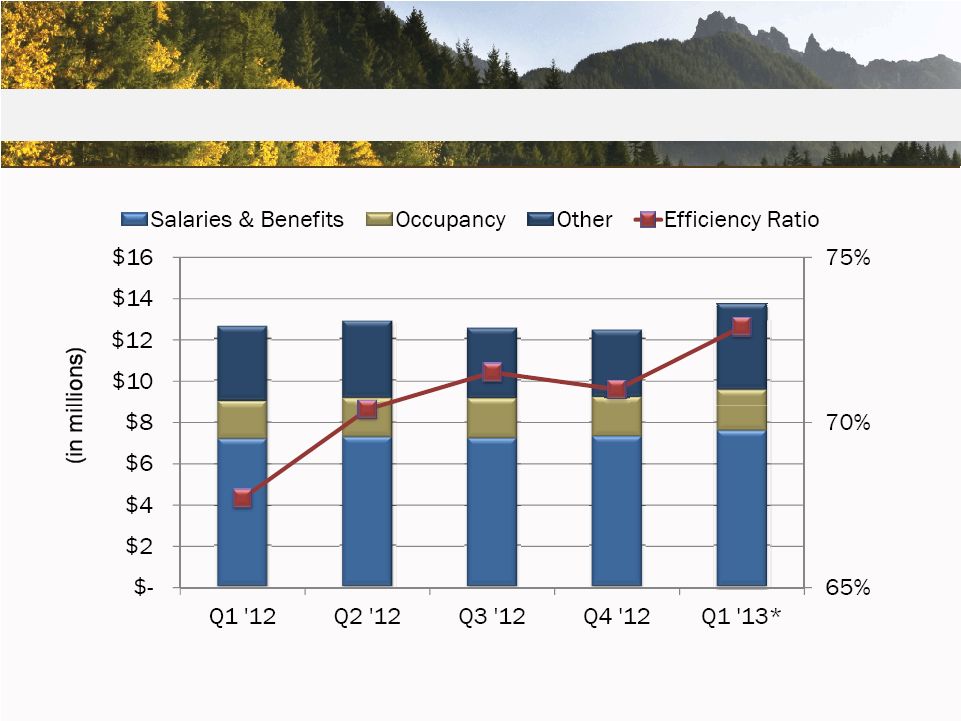 Operating Expenses
23
*Includes Northwest Commercial Bank acquisition expenses of $665,000
and the proposed Valley Bank acquisition expenses of $148,000
|
 24
Strategic Initiatives
24 |
 2013
Strategic Initiatives •
Acquisitions
•
Enhance Pacific Northwest footprint
•
Balance Sheet Growth
•
2013 projected originated loan growth of 3-5%
•
Maintain loan to deposit ratio 85-90%
•
Efficiency Improvements
•
A disciplined approach to managing expenses
•
Merge Central Valley Bank into Heritage Bank
•
Core System Conversion
25 |
 2013
Strategic Initiatives •
Branching
•
De Novo branch -
East Vancouver, WA
•
Re-locating branches –
Tumwater and Kent, WA
•
Valley Bank branch consolidation
•
Wealth Management
•
Continue growth focus on Trust, Brokerage, Advisory
Management Services
•
Grow Assets under Management
26 |
 Strategic Efficiency Initiatives
•
Emphasis on improving:
•
Assets per employee (ApE)
•
Deposits per branch (DpB)
•
Loan commitments per lender
•
Efficiency Ratio
27 |
 Strategic Capital Management
•
Cash Dividends
•
Continued focus on
•
Regular dividends in the 35% to 40% payout range
•
Special dividend as appropriate but dependent on acquisition
activities
•
Stock buybacks on an opportunistic basis
28
2011
2012
2013
Q2
Q3
Q4
Q1
Q2
Q3
Q4
Q1
Q2
Quarterly
Dividend
$0.03
$0.05
$0.05
$0.06
$0.08
$0.08
$0.08
$0.08
$0.08
Special
Dividend
-
-
$0.25
-
$0.20
-
$0.30
-
- |
 Capital
Return 29
Total
Capital
Returned*
Since
Q1
2011
(%
of
Tg.
Common
Equity
in
Q1
2011)
Source: SNL Financial, as of 12/31/2012 unless noted otherwise
*Total capital returned includes all cash dividends and stock buybacks since Q1
2011 HFWA has returned
more capital to
shareholders than
most peers since Q1
2011 based on
beginning balance of
tangible common
equity
14.0%
5.1%
8.2%
12.7%
7.3%
9.7%
8.1%
9.4%
6.9%
9.9%
6.6%
12.1%
8.2%
0%
2%
4%
6%
8%
10%
12%
14%
16%
HFWA
BMRC
COLB
CVBF
FIBK
GBCI
PCBK
PACW
TCBK
UMPQ
WBCO
WAFD
Median |
 Capital
Return 30
Source: SNL Financial, as of 12/31/2012 unless noted otherwise
*Total capital returned includes all cash dividends and stock buybacks since Q1
2011 HFWA has
returned more
capital to
shareholders
than
accumulated net
income since Q1
2011
Total Capital Returned* / Net Income (Since Q1 2011)
138.7%
22.1%
54.7%
52.6%
39.0%
80.0%
74.4%
40.9%
37.0%
59.2%
34.9%
81.8%
52.6%
0%
20%
40%
60%
80%
100%
120%
140%
160%
HFWA
BMRC
COLB
CVBF
FIBK
GBCI
PCBK
PACW
TCBK
UMPQ
WBCOWAFD
Median |
 Capital
Return 31
Source: SNL Financial, as of 12/31/2012
*Total capital returned includes all cash dividends and stock buybacks since Q1
2011 HFWA has returned capital through both dividends and stock
buybacks 68.3% through dividends and 31.7% through buybacks
vs. peer median 93.3% through dividends and 6.7% through buybacks
More advantageous for shareholders from a tax perspective for stock buybacks
vs. dividends None of the selected companies had a buyback program in
place without a dividend program as well Mix of Capital Returned* (Since Q1 2011)
0%
10%
20%
30%
40%
50%
60%
70%
80%
90%
100%
HFWA
BMRC
COLB
CVBF
FIBK
GBCI
PCBK
PACW
TCBK
UMPQ
WBCO
WAFD
Median
Buyback
Dividends |
 32
Conclusion
32 |
 Investment Value
•
Strong financial foundation performance
trends
•
Positioned to take advantage of the right
opportunities
•
Continued focus on building long-term
franchise value
•
Disciplined approach to acquisitions
33 |
 Thank
You Questions? |