Attached files
| file | filename |
|---|---|
| 8-K - FORM 8-K - GAIN Capital Holdings, Inc. | d532588d8k.htm |
| EX-99.1 - EX-99.1 - GAIN Capital Holdings, Inc. | d532588dex991.htm |
 1 Quarter 2013
Financial and Operating Results
May 7, 2013
st
Exhibit 99.2 |
 Special Note Regarding Forward-Looking Information
2
In addition to historical information, this presentation contains
"forward-looking" statements that reflect
management's expectations for the future. The forward-looking
statements contained in this earnings presentation include,
without limitation, statements relating to GAIN Capital’s expectations regarding the opportunities and
strengths of the combined company created by the proposed business
combination of GAIN and GFT, anticipated cost and revenue
synergies as well as expected growth in financial and operating metrics, the strategic rationale for
the proposed business combination, including expectations regarding
product offerings, growth opportunities, value creation, and
financial strength, and the timing of the closing. A variety of important factors could cause results to
differ materially from such statements. These factors are noted
throughout GAIN Capital's annual report on Form 10-K, as
filed with the Securities and Exchange Commission on March 18, 2013, and include, but are not limited to,
the actions of both current and potential new competitors, fluctuations
in market trading volumes, financial market volatility, evolving
industry regulations, including changes in regulation of the futures companies, errors or
malfunctions in our systems or technology, rapid changes in technology,
effects of inflation, customer trading patterns, the success of
our products and service offerings, our ability to continue to innovate and meet the demands
of our customers for new or enhanced products, our ability to
successfully integrate assets and companies we have acquired,
including the successful integration of Open E Cry and Global Forex & Futures, LTD, our ability to
effectively compete in the futures industry, changes in tax policy or
accounting rules, fluctuations in foreign exchange rates and
commodity prices, adverse changes or volatility in interest rates, as well as general economic,
business, credit and financial market conditions, internationally or
nationally, and our ability to continue paying a quarterly
dividend in light of future financial performance and financing needs. The forward-looking statements
included herein represent GAIN Capital's views as of the date of this
presentation. GAIN Capital undertakes no obligation to revise or
update publicly any forward-looking statement for any reason unless required by law. |
 Overview
Glenn Stevens, CEO |
 Highlights
•
Strong organic growth with revenue and EBITDA up 50% and 481%, respectively,
compared to prior year quarter
•
Revenue diversification accelerating with run-rate of 22% of total revenue
coming from commission or fee-based activities
•
Institutional volume and revenue up 90% and 65%, respectively, compared to
prior year quarter
•
April metrics show continued positive momentum
•
Transformational acquisition of GFT to accelerate growth in financial
and
operating
metrics
(1)
–
Combined 2013 run-rate revenue: $329mm
–
Combined 2013 run-rate pro forma EBITDA: $77mm (20+% margin)
–
Potential operating expense synergies: $35mm-$45mm
–
Pro forma client assets: ~$650mm
–
Pro forma funded accounts: ~140,000
4
(1)
Financial metrics based on simple addition of first quarter 2013 results for both
companies projected over four quarters and includes the implementation of $40mm in year 1
operating synergies.
|
 (1)
EBITDA is a non-GAAP financial measure that represents our earnings before
interest, taxes, depreciation, amortization and non- recurring expenses.
A reconciliation of net income to EBITDA is available in the appendix to this presentation.
(2)
Definitions for all our operating metrics are available in the appendix to this
presentation. 1 Quarter 2013 Results Overview
•
Q1 2013 Financial Summary
•
Net revenue of $49.8 million compared with $33.2 million
•
EBITDA
(1)
of $7.5 million compared with $1.3 million
•
Net Income of $4.3 million compared with a net loss of $1.3 million
•
EPS (Diluted): $0.11
•
Operating Metrics
(2)
•
Total trading volume up 55% to $1.3 trillion
•
Retail volume increased 12% to $431.8 billion
•
Institutional volume increased 90% to $889.9 billion
•
Funded accounts up 36% to 100,020
•
Client assets up 40% to $456.9 million as of March 31, 2013
(Comparisons are referenced to Q1 2012)
5
st
•
Q1 2013 positive momentum continuing in April |
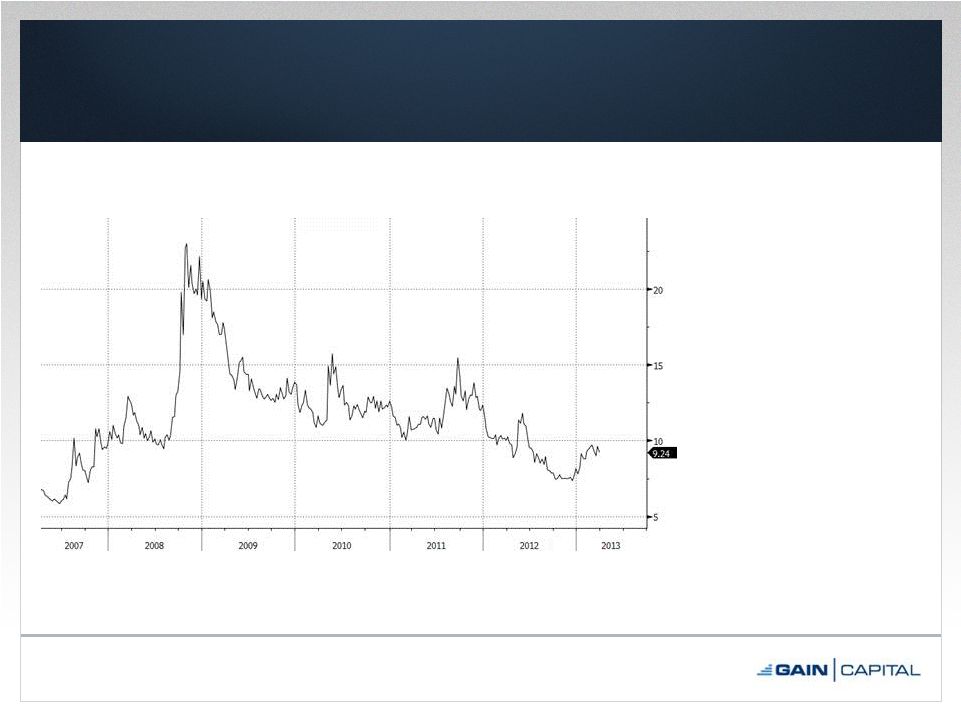 Q1
2013 Market Conditions 6
Source: JPMorgan’s G7 Volatility Index
•
Volatility higher in Q1
2013, but still well
below 2008-2011
averages
•
Index looks to be
forming a base,
indicating support for
sustained levels of
volatility |
 Retail
OTC •
Significant growth in all key operating metrics
reflects Company’s strong position to take
advantage of improved market conditions
–
Funded retail accounts up 36% to 100,020
–
Approximately 15,000 net new accounts in Q1
–
Highest quarterly trading volume since Q2 2011
–
Strong asset gathering continues
•
Leading market consolidation in the U.S.
–
FX Solutions U.S. customer acquisition (February 2013)
–
GFT U.S. customer acquisition (December 2012)
7 |
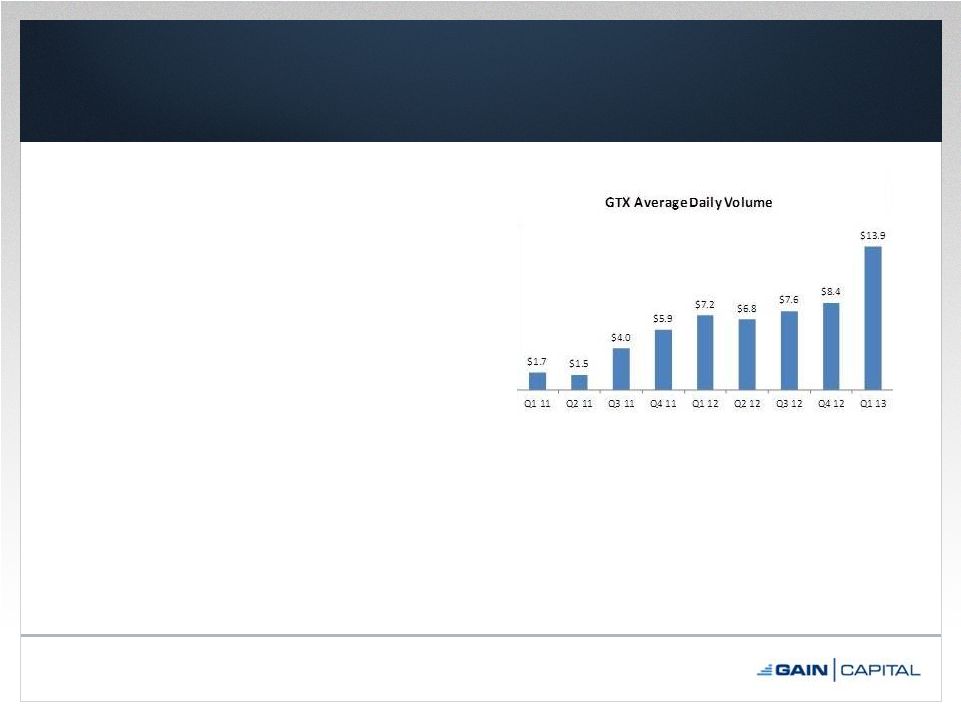 Commission-Based Business
8
•
GTX –
Institutional
–
Significant volume growth since Q1 2011 –
average of 30% per quarter
–
On-boarded new money center bank in Q1
–
Strong pipeline of additional customers
–
Opportunity to leverage GTX in connection
with GFT’s Sales Trader business to drive
additional growth
•
OEC –
Futures
–
OEC customer assets up 21% since
acquisition announced in July 2012
–
Expanded institutional sales team to
accelerate futures growth
•
On track to contribute more than 20% of
total 2013 revenue, based on Q1 run rate
–
Provides significant source of steady non-
trading revenue with substantial growth
prospects |
 Growth
Through M&A – GFT Acquisition
•
GAIN previously announced its acquisition of GFT on April 25, 2013
•
GFT has ~40,000 customer accounts with over $190mm of customer assets
–
Pro forma GAIN Capital operating metrics:
•
~140,000 funded accounts
•
~$650mm client assets
•
Transaction Overview
–
Structure:
•
~4.9mm GAIN Capital shares
•
$40mm cash
•
$40mm senior secured note
–
8.0% annual interest rate, payable quarterly
–
$1.5mm quarterly amortization
–
Anticipated operating expense synergies: $35mm-$45mm
–
Targeted close: Q3 2013 (on track)
–
Existing revolving credit facility with JPM/SVB will terminate at closing
•
Will seek replacement facility as financing needs develop
•
Transaction expected to be accretive in the first full quarter after closing
•
Acquisition demonstrates GAIN’s position as a trusted partner for both asset
transfers and acquisitions
–
Another example of GAIN’s successful market consolidation strategy
9 |
 GFT
Acquisition – Strategic Rationale
•
Immediate scale increase
–
Combination enhances scale and positioning in the global OTC market
•
Combined
2013
run-rate
revenue:
$329mm
(1)
•
Pro forma client assets: ~$650mm
•
Pro forma FY 2012 volume: $4.6 trillion
–
Increases GAIN’s key financial, trading and client metrics
–
Greater ability to withstand potential regulatory changes and market
volatility •
Broader product offering
–
Total of 12,500 financial markets
–
OTC FX, CFDs, binary options, spread betting, FX options, exchange-traded
futures and options •
Significant operating synergies anticipated
–
Potential to realize approximately $35mm-$45mm of cost savings via
first-year synergies –
Potential to capitalize on additional operating and capital synergies
•
Diversifies revenue streams
–
Significant expansion of CFDs and spread betting products
–
Enhances GAIN’s indirect distribution network by leveraging GFT’s skill
and experience in servicing large brokerage partners
–
Institutionally-focused Sales Trader team complements and augments existing
institutional services and GTX business
10
(1)
Based
on
simple
addition
of
first
quarter
2013
results
for
both
companies
projected
over
four
quarters. |
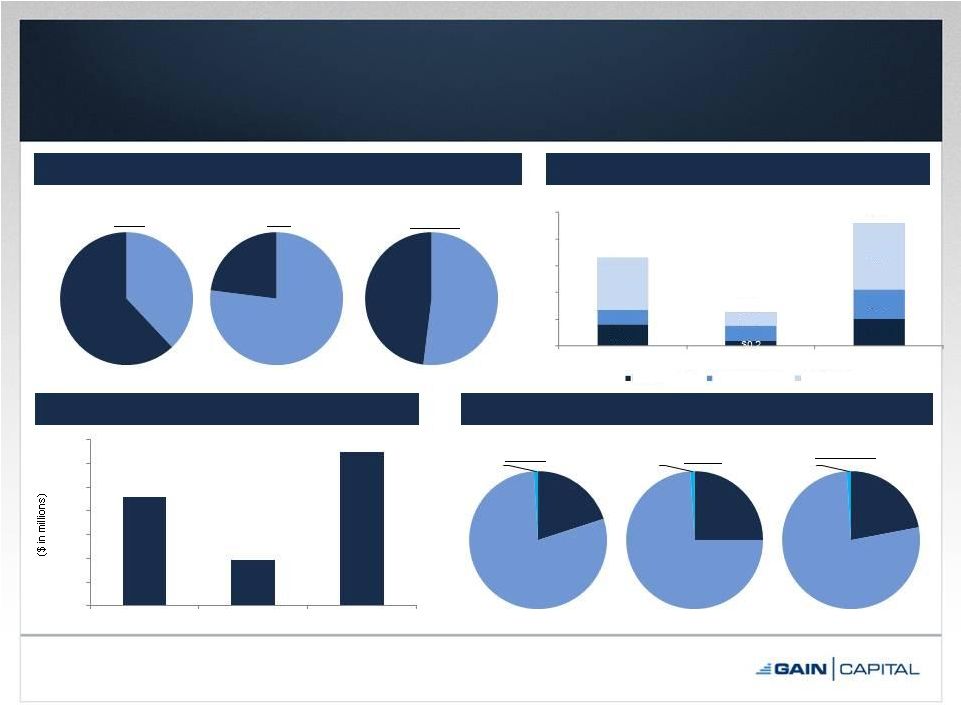 Pro
Forma Financial & Operating Metrics 11
FY 2012 Retail Volume Contribution %
FY 2012 Revenue Contribution %
(1)
Institutional volume reflects GTX for GAIN and Sales Trader for GFT.
(2)
Commission revenue represents PF 2012 to include full-year impact of OEC
acquisition. (3)
Commission revenue represents revenue from Sales Trader clients.
(4)
Commission
revenue
represents
revenue
from
Sales
Trader
clients,
GTX
and
full-year
impact
of
OEC
acquisition.
FY 2012 Trading Volume ($ in trillions)
3/31/2013 Client Assets
(1)
Indirect
38%
Direct
62%
GAIN
Indirect
77%
Direct
23%
GFT
Indirect
52%
Direct
48%
PF GAIN
$456.9
$192.2
$649.1
$0
$100
$200
$300
$400
$500
$600
$700
GAIN
GFT
PF GAIN
$0.8
$1.0
$0.5
$0.6
$1.1
$2.0
$0.5
$2.5
$3.3
$1.3
$4.6
$0.0
$1.0
$2.0
$3.0
$4.0
$5.0
GAIN
GFT
PF GAIN
Retail -
Direct
Retail -
Indirect
Institutional
Commission
Revenue
20%
Trading
Revenue
79%
Other
1%
GAIN
(2)
Commission
Revenue
25%
Trading
Revenue
74%
Other
1%
GFT
(3)
Commission
Revenue
22%
Trading
Revenue
77%
Other
1%
PF GAIN
(4) |
 Financial Review
Daryl Carlough, Interim CFO |
 1 Quarter 2013 Financial Results
13
Note: Dollars in millions.
(1)
Reconciliation of net income to EBITDA is available in the appendix to this
presentation. $35.1
$44.6
$0
$10
$20
$30
$40
$50
Q1 2012
Q1 2013
Total Expenses
Comp & Benefits
Marketing
Trading
All Other
$33.2
$49.8
$1.3
$7.5
$0.0
$10.0
$20.0
$30.0
$40.0
$50.0
$60.0
Q1 2012
Q1 2013
Net Revenue & EBITDA
(1)
Net Revenue
EBITDA
$99.0
$76.4
$80.3
$129.0
$107.1
$98.3
$0.0
$20.0
$40.0
$60.0
$80.0
$100.0
$120.0
$140.0
$160.0
1Q 11
2Q 11
3Q 11
4Q 11
1Q 12
2Q 12
3Q 12
4Q 12
1Q 13
Retail Trading Revenue per Million
Retail Trading Revenue per Million (Quarterly)
Retail Trading Revenue per Million (Last Twelve Months)
st
($1.3)
$4.3
($2.0)
($1.0)
$0.0
$1.0
$2.0
$3.0
$4.0
$5.0
Q1 2012
Q1 2013
Net Income/(Loss) |
 Quarterly Dividend & Share Buyback
•
$0.05 per share quarterly dividend approved
•
Board approved to increase share repurchase program by
$15.0 million to opportunistically buy back undervalued
GAIN shares
14
–
Record Date: June 12, 2013
–
Payment Date: June 21, 2013 |
 Monthly
Operating
Metrics
(1)
15
(1)
Definitions for all our operating metrics are available in the appendix to this
presentation. •
GAIN will begin providing monthly operating metrics
beginning with April 2013 (next week)
–
Metrics for subsequent months will be provided in the
middle of the following month
(Volume in billions; assets in millions)
Oct-12
Nov-12
Dec-12
Jan-13
Feb-13
Mar-13
Retail
OTC Trading Volume
$99.5
$105.7
$93.6
$147.5
$143.6
$140.7
Average Daily Volume
$4.3
$4.8
$4.9
$6.4
$7.2
$6.7
Active OTC Accounts
(1)
58,869
58,775
60,219
60,776
60,967
62,606
Futures DARTs
12,909
12,971
12,598
11,776
14,742
13,406
Funded Accounts
82,222
81,511
85,099
85,557
85,873
100,020
Customer Assets
$438.0
$440.6
$446.3
$442.7
$444.6
$456.9
Institutional
Trading Volume
$174.9
$169.1
$194.4
$314.5
$306.0
$269.4
Average Daily Volume
$7.6
$7.7
$10.2
$13.7
$15.3
$12.8 |
 Closing Remarks
16
•
Strong Q1 operating and financial metrics;
diversification strategy showing results
•
Focus on controlling fixed expenses to drive
margins
•
Record client assets position GAIN to continue
taking advantage of improved market conditions
•
Continued strength in financial and operating
metrics through April 2013
•
Steady progress towards closing transformational
GFT acquisition
•
Pursuing further organic growth opportunities |
 Appendix |
 Condensed Consolidated Statements of Operations
18
Note: Unaudited. Dollars in millions, except per share data.
Three Months Ended
March 31,
Revenue
2013
2012
Trading revenue
35.3
$
29.5
$
Commission revenue
10.9
3.7
Other revenue
3.6
0.1
Total non-interest revenue
49.8
33.3
Interest revenue
0.1
0.1
Interest expense
(0.1)
(0.2)
Total net interest revenue/(expense)
-
(0.1)
Net revenue
49.8
33.2
Expenses
Employee compensation and benefits
13.3
10.3
Selling and marketing
5.4
7.1
Trading expenses and commissions
15.7
8.7
General & Administrative
5.6
4.2
Depreciation and amortization
1.6
1.1
Purchased intangible amortization
0.6
1.9
Communication and data processing
2.2
1.8
Bad debt provision
0.2
-
Total
44.6
35.1
Income/(loss) before tax expense
5.2
(1.9)
Income tax expense/(benefit)
0.9
(0.6)
Net income/(loss)
4.3
$
(1.3)
$
Basic
0.12
$
(0.04)
$
Diluted
0.11
$
(0.04)
$
Weighted averages common shares outstanding used
in computing earnings per common share:
Basic
35,052,375
34,480,705
Diluted
37,331,592
34,480,705
Earnings/(loss) per common share: |
 Consolidated Balance Sheet
19
Note: Unaudited. Dollars in millions.
March 31,
December 31,
2013
2012
ASSETS:
Cash and cash equivalents
12.1
$
36.8
$
Cash and securities held for customers
456.9
446.3
Short term investments
1.4
1.4
Receivables from banks and brokers
124.7
89.9
Property and equipment - net of accumulated
depreciation 10.7
11.0
Prepaid assets
7.7
7.7
Goodwill
9.0
9.0
Intangible assets, net
9.2
9.9
Other assets
18.8
17.9
Total assets
650.5
$
629.9
$
LIABILITIES AND SHAREHOLDERS' EQUITY:
Payables to customer, brokers, dealers, FCM'S and other regulated entities
456.9
$
446.3
$
Accrued compensation & benefits payable
5.5
6.1
Accrued expenses and other liabilities
11.5
12.5
Income tax payable
3.0
1.3
Note payable
10.0
-
Total
liabilities 486.9
$
466.2
$
Shareholders' Equity
163.6
$
163.7
$
Total
liabilities and shareholders' equity 650.5
$
629.9
$
|
 Current Liquidity
20
Note: Dollars in millions.
(1)
(2)
Reflects cash that would be received from brokers following the close-out of all
open positions. Excludes current liabilities of $20.0mm and $19.9mm as of
March 31, 2013 and December 31, 2012, respectively, and capital charges associated with open
positions.
As of
3/31/2013
12/31/2012
Cash and cash equivalents
$12.1
$36.8
Cash and securities held for customers
456.9
446.3
Short term investments
1.4
1.4
Receivables
from
banks
and
brokers
(1)
124.7
89.9
Total Operating Cash
$595.1
$574.4
Less: Cash and securities held for customers
(456.9)
(446.3)
Free Operating Cash
$138.2
$128.1
Less: Minimum regulatory capital requirements
(49.3)
(45.6)
Less: Note payable
(10.0)
-
Free Cash Available
(2)
$78.9
$82.5 |
 1 Quarter 2013 Financial Summary
21
Note: Dollars in millions, except per share data.
(1)
See page 22 for a reconciliation of GAAP net income to EBITDA.
(2)
EBITDA margin is calculated as EBITDA divided by net revenue (ex. interest
expense). st
3 Months Ended March 31,
'13 v '12
2013
2012
% Change
Net Revenue
$49.8
$33.2
50%
Interest Expense
0.1
0.2
(33%)
Net Revenue (ex. Interest Expense)
$49.9
$33.4
50%
Operating Expenses
42.4
32.1
32%
EBITDA
(1)
$7.5
$1.3
481%
Net Income/(Loss)
$4.3
($1.3)
NM
EPS (Diluted)
$0.11
($0.04)
NM
EBITDA Margin %
(1)(2)
15.0%
3.9%
11 pts
Net Income Margin %
8.6%
(3.9%)
13 pts |
 EBITDA & Margin Reconciliation
22
Note: Dollars in millions.
(1)
EBITDA margin is calculated as EBITDA divided by net revenue (ex. interest
expense). Three Months Ended December 31,
2013
2012
Net Revenue
49.8
$
33.2
$
Interest Expense
0.1
0.2
Net Revenue (ex. Interest Expense)
49.9
$
33.4
$
Net income/(loss)
4.3
$
(1.3)
$
Depreciation & amortization
1.6
1.1
Purchase intangible amortization
0.6
1.9
Interest expense on note
0.1
0.2
Income tax expense/(benefit)
0.9
(0.6)
EBITDA
7.5
$
1.3
$
EBITDA Margin %
(1)
15.0%
3.9% |
 Operating Metrics
(1)
23
Note: Volume in billions. Assets in millions.
(1)
Definitions for all our operating metrics are available on page 24.
3 Months Ended,
31-Mar-12
30-Jun-12
30-Sep-12
31-Dec-12
31-Mar-13
Retail
OTC Trading Volume
$385.1
$340.8
$278.7
$298.8
$431.8
Average Daily Volume
$5.9
$5.2
$4.2
$4.7
$6.7
Active OTC Accounts
62,723
61,746
59,166
60,219
62,606
Futures DARTs
-
-
15,270
(2)
13,000
13,238
Funded Accounts
73,483
74,620
82,394
85,099
100,020
Customer Assets
$325.9
$320.2
$426.6
$446.3
$456.9
Institutional
Trading Volume
$468.0
$442.5
$503.7
$538.4
$889.9
Average Daily Volume
$7.2
$6.8
$7.6
$8.4
$13.9 |
 Definition of Metrics
•
Funded Accounts
–
Retail accounts who maintain a cash balance
•
Active OTC Accounts
–
Retail accounts who executed a transaction during a given period
•
Trading Volume
–
Represents the U.S. dollar equivalent of notional amounts traded
•
Futures DARTs
–
Represents the average daily trades transacted by OEC customers
•
Customer Assets
–
Represents amounts due to clients, including customer deposits and
unrealized gains or losses arising from open positions
24 |
 1 Quarter 2013
Financial and Operating Results
May 7, 2013
st |