Attached files
| file | filename |
|---|---|
| EX-99.1 - EXHIBIT 99.1 - Clearwater Paper Corp | a50616892ex99_1.htm |
| 8-K - CLEARWATER PAPER CORPORATION 8-K - Clearwater Paper Corp | a50616892.htm |
Exhibit 99.2
Clearwater Paper Corporation First Quarter 2013 Supplemental Information Linda Massman President, Chief Executive Officer and Director John Hertz Senior Vice President, Finance and Chief Financial Officer
Forward-Looking Statements 1 This supplemental information contains, in addition to historical information, certain forward-looking statements within the meaning of the Private Securities Litigation Reform Act of 1995, including statements regarding outlook for 2013, production, product volumes shipped, pricing for our products, pulp costs, wood fiber costs and supply, chemical costs, transportation costs, energy costs, including natural gas, costs and timing of major maintenance and repairs, production and shipments from our new tissue machine and converting lines in Shelby, North Carolina and our Pro Forma Adjusted EBITDA target. These forward-looking statements are based on management’s current expectations, estimates, assumptions and projections that are subject to change. Our actual results of operations may differ materially from those expressed or implied by the forward-looking statements contained in this presentation. Important factors that could cause or contribute to such differences include the risks and uncertainties described from time to time in the company's public filings with the Securities and Exchange Commission, as well as the following: •difficulties with the optimization and realization of the benefits expected from our new through-air-dried paper machine and converting lines in Shelby, North Carolina; •increased dependence on wood pulp; •changes in the cost and availability of wood fiber and wood pulp; •changes in transportation costs and disruptions in transportation services; •manufacturing or operating disruptions, including equipment malfunction and damage to our manufacturing facilities; •changes in costs for and availability of packaging supplies, chemicals, energy and maintenance and repairs; •competitive pricing pressures for our products, including as a result of increased capacity as additional manufacturing facilities are operated by our competitors; •changes in customer product preferences and competitors' product offerings; •changes in the U.S. and international economies and in general economic conditions in the regions and industries in which we operate; •cyclical industry conditions; •reliance on a limited number of third-party suppliers for raw materials; •labor disruptions; and •inability to successfully implement our expansion strategies. Forward-looking statements contained in this presentation present management’s views only as of the date of this presentation. We undertake no obligation to publicly update forward-looking statements, whether as a result of new information, future events or otherwise.
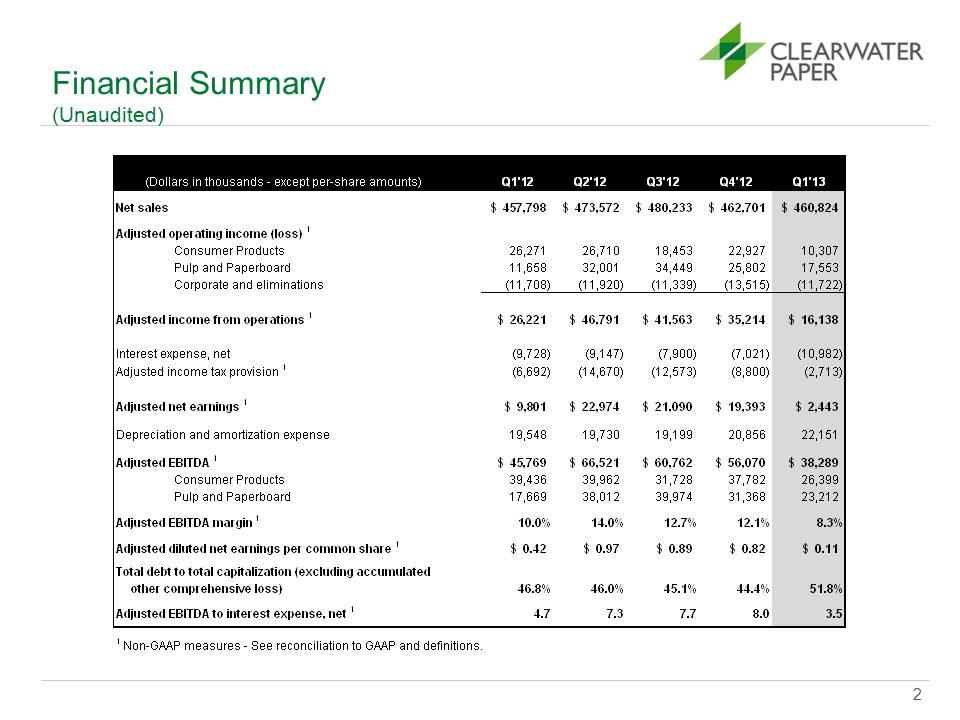
Financial Summary (Unaudited) 2 Q1'12 Q2'12 Q3'12 Q4'12 Q1'13 Net sales $ 457,798 $ 473,572 $ 480,233 $ 462,701 $ 460,824 Adjusted operating income (loss) 1 Consumer Products 26,271 26,710 18,453 22,927 10,307 Pulp and Paperboard 11,658 32,001 34,449 25,802 17,553 Corporate and eliminations (11,708) (11,920) (11,339) (13,515) (11,722) Adjusted income from operations 1 $ 26,221 $ 46,791 $ 41,563 $ 35,214 $ 16,138 Interest expense, net (9,728) (9,147) (7,900) (7,021) (10,982) Adjusted income tax provision 1 (6,692) (14,670) (12,573) (8,800) (2,713) Adjusted net earnings 1 $ 9,801 $ 22,974 $ 21,090 $ 19,393 $ 2,443 Depreciation and amortization expense 19,548 19,730 19,199 20,856 22,151 Adjusted EBITDA 1 $ 45,769 $ 66,521 $ 60,762 $ 56,070 $ 38,289 Consumer Products 39,436 39,962 31,728 37,782 26,399 Pulp and Paperboard 17,669 38,012 39,974 31,368 23,212 Adjusted EBITDA margin 1 10.0% 14.0% 12.7% 12.1% 8.3% Adjusted diluted net earnings per common share 1 $ 0.42 $ 0.97 $ 0.89 $ 0.82 $ 0.11 Total debt to total capitalization (excluding accumulated other comprehensive loss) 46.8% 46.0% 45.1% 44.4% 51.8% Adjusted EBITDA to interest expense, net 1 4.7 7.3 7.7 8.0 3.5 1 Non-GAAP measures - See reconciliation to GAAP and definitions. (Dollars in thousands - except per-share amounts)
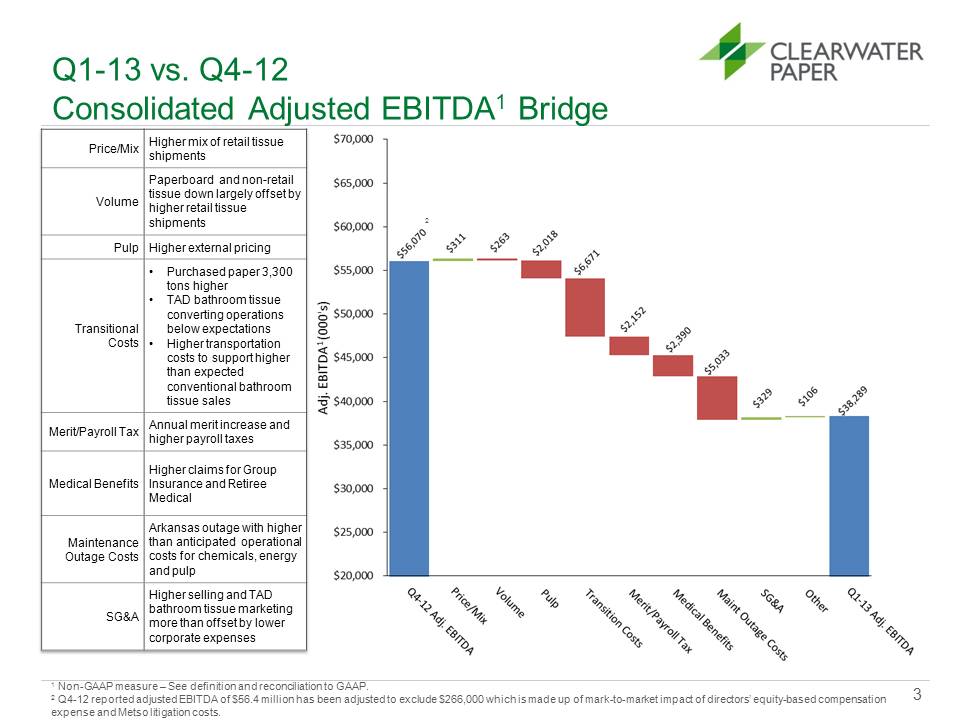
Q1-13 vs. Q4-12 Consolidated Adjusted EBITDA1 Bridge 3 Price/Mix Higher mix of retail tissue shipments Volume Paperboard and non-retail tissue down largely offset by higher retail tissue shipments Pulp Higher external pricing Transitional Costs • Purchased paper 3,300 tons higher • TAD bathroom tissue converting operations below expectations • Higher transportation costs to support higher than expected conventional bathroom tissue sales Merit/Payroll Tax Annual merit increase and higher payroll taxes Medical Benefits Higher claims for Group Insurance and Retiree Medical Maintenance Outage Costs Arkansas outage with higher than anticipated operational costs for chemicals, energy and pulp SG&A Higher selling and TAD bathroom tissue marketing more than offset by lower corporate expenses 1 Non-GAAP measure – See definition and reconciliation to GAAP. 2 Q4-12 reported adjusted EBITDA of $56.4 million has been adjusted to exclude $266,000 which is made up of mark-to-market impact of directors’ equity-based compensation expense and Metso litigation costs. 2
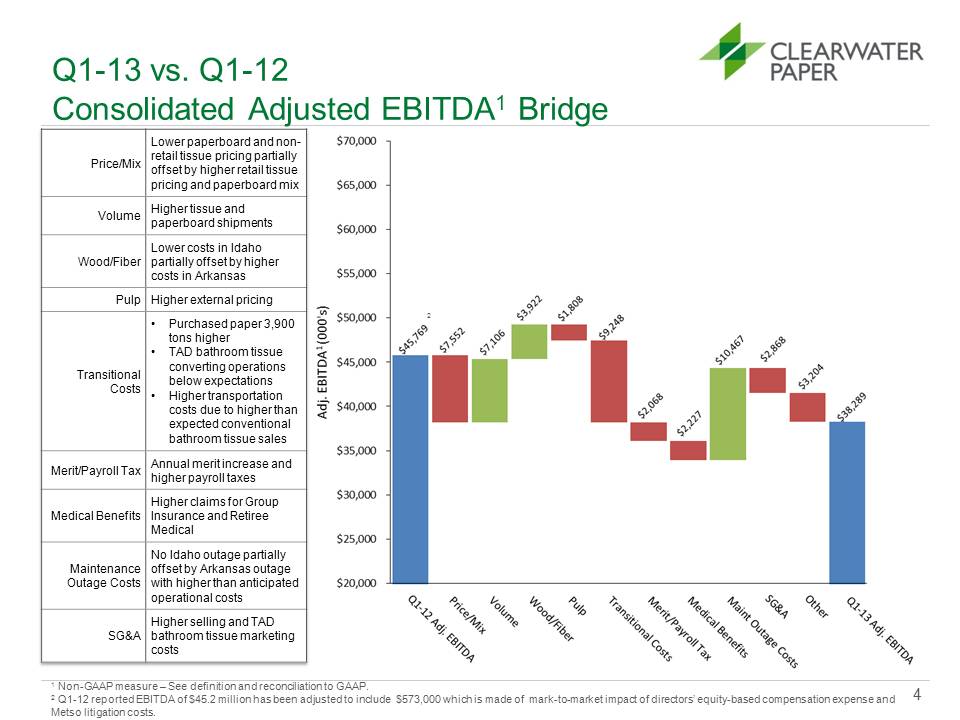
Q1-13 vs. Q1-12 Consolidated Adjusted EBITDA1 Bridge 4 Price/Mix Lower paperboard and nonretail tissue pricing partially offset by higher retail tissue pricing and paperboard mix Volume Higher tissue and paperboard shipments Wood/Fiber Lower costs in Idaho partially offset by higher costs in Arkansas Pulp Higher external pricing Transitional Costs • Purchased paper 3,900 tons higher • TAD bathroom tissue converting operations below expectations • Higher transportation costs due to higher than expected conventional bathroom tissue sales Merit/Payroll Tax Annual merit increase and higher payroll taxes Medical Benefits Higher claims for Group Insurance and Retiree Medical Maintenance Outage Costs No Idaho outage partially offset by Arkansas outage with higher than anticipated operational costs SG&A Higher selling and TAD bathroom tissue marketing costs 1 Non-GAAP measure – See definition and reconciliation to GAAP. 2 Q1-12 reported EBITDA of $45.2 million has been adjusted to include $573,000 which is made of mark-to-market impact of directors’ equity-based compensation expense and Metso litigation costs. 2 $45,769 $7,552 $7,106 $3,922 $1,808 $9,248 $2,068 2,227 10,467 2,868 3,204 38,289 Volume Wood/Fiber Pulp Transitional Costs Merit/Payroll Tax Medical Benefits Maint Outage Cost SG&A Other Q1-13 Adj. EBITDA Q1-12
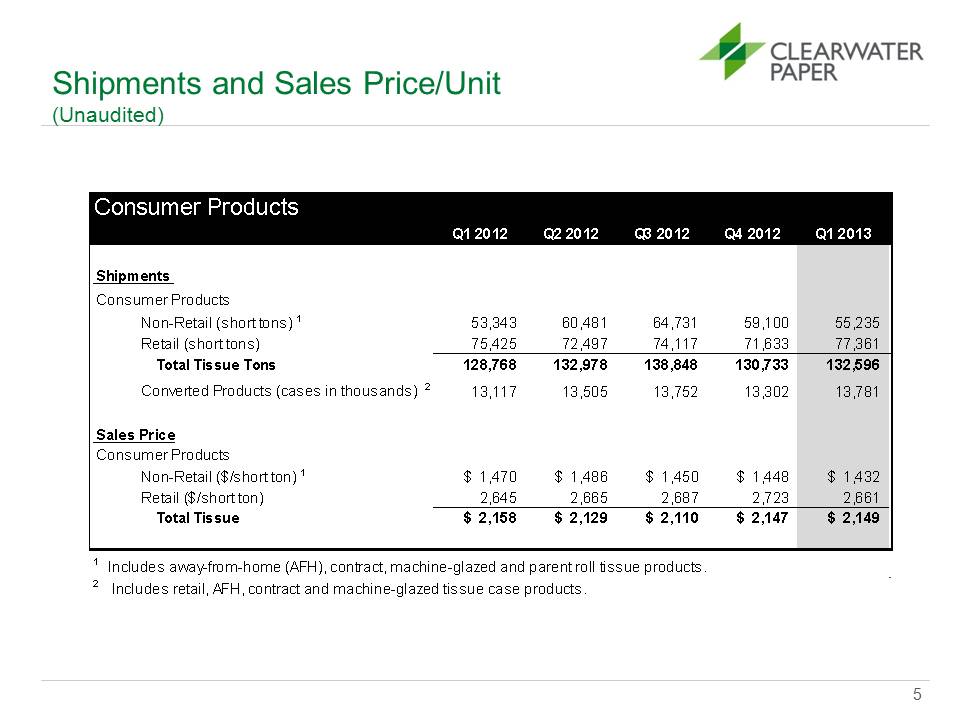
Shipments and Sales Price/Unit (Unaudited) 5 Consumer ProductsQ1 2012Q2 2012Q3 2012Q4 2012Q1 2013 Shipments Consumer ProductsNon-Retail (short tons) 153,343 60,481 64,731 59,100 55,235 Retail (short tons) 75,425 72,497 74,117 71,633 77,361 Total Tissue Tons128,768 132,978 138,848 130,733 132,596 Converted Products (cases in thousands) 213,117 13,505 13,752 13,302 13,781 Sales Price Consumer ProductsNon-Retail ($/short ton) 1$ 1,470$ 1,486$ 1,450$ 1,448$ 1,432Retail ($/short ton) 2,645 2,665 2,687 2,723 2,661 Total Tissue$ 2,158$ 2,129$ 2,110$ 2,147$ 2,1491 Includes away-from-home (AFH), contract, machine-glazed and parent roll tissue products.2 Includes retail, AFH, contract and machine-glazed tissue case products.
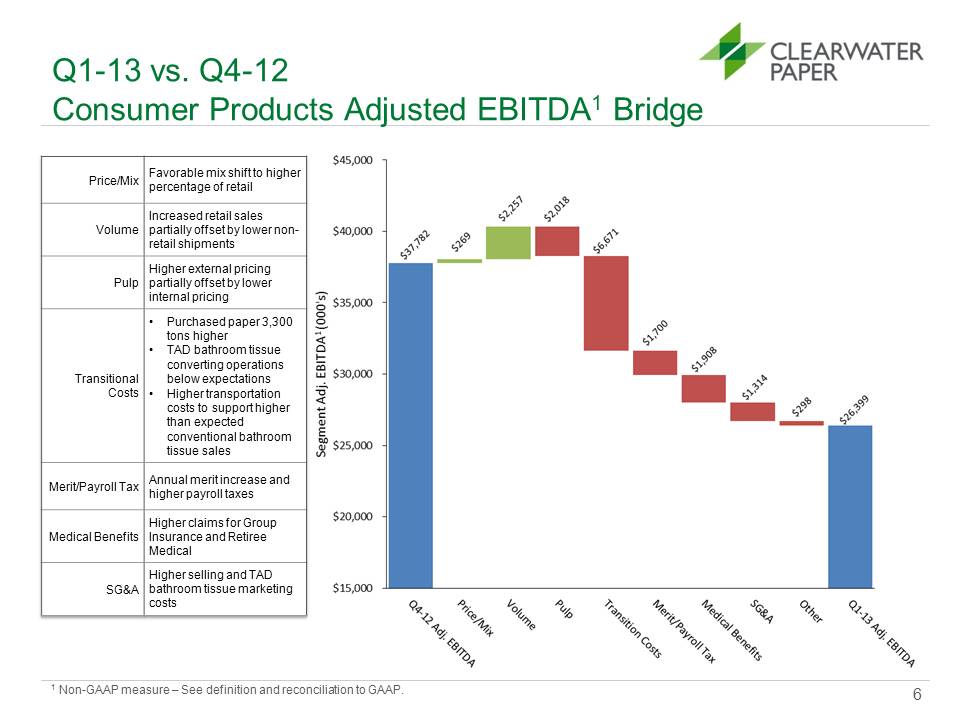
Q1-13 vs. Q4-12 Consumer Products Adjusted EBITDA1 Bridge 6 Price/Mix Favorable mix shift to higher percentage of retail Volume Increased retail sales partially offset by lower nonretail shipments Pulp Higher external pricing partially offset by lower internal pricing Transitional Costs • Purchased paper 3,300 tons higher • TAD bathroom tissue converting operations below expectations • Higher transportation costs to support higher than expected conventional bathroom tissue sales Merit/Payroll Tax Annual merit increase and higher payroll taxes Medical Benefits Higher claims for Group Insurance and Retiree Medical SG&A Higher selling and TAD bathroom tissue marketing costs 1 Non-GAAP measure – See definition and reconciliation to GAAP. $37,782 269 2,257 2,018 6,671 1,700 1,908 1,314 298 26,399 Q4-12 Adj. EBITDA Price/Mix Volume Pulp Transition Cost merit/Paroll Tax Medical Benefits SG&A Other q1-13
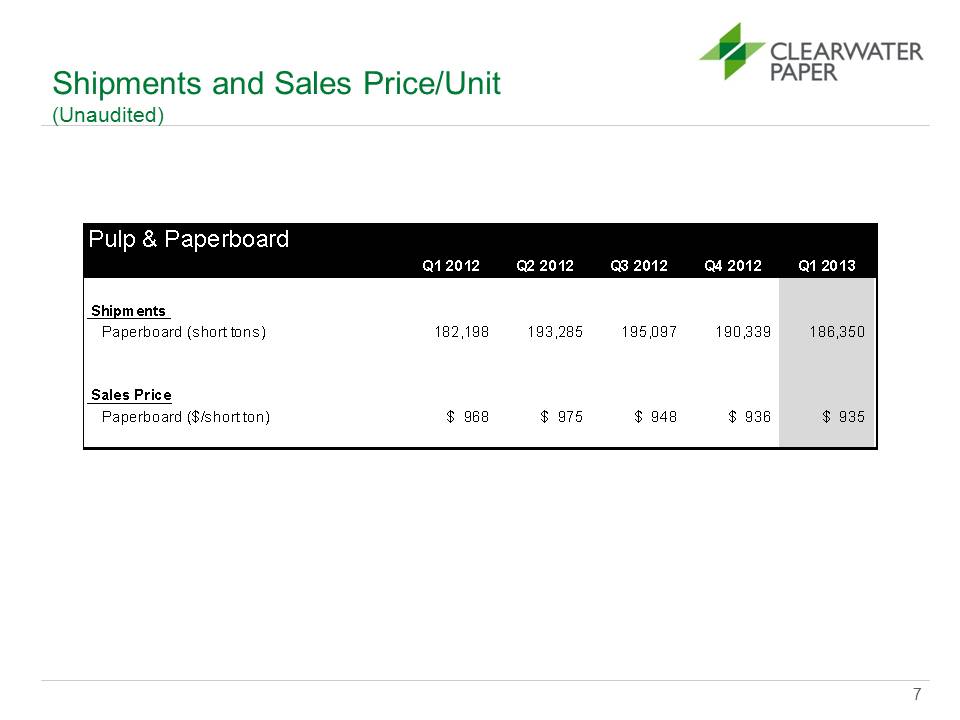
Shipments and Sales Price/Unit (Unaudited) 7 Pulp & PaperboardQ1 2012Q2 2012Q3 2012Q4 2012Q1 2013 Shipments Paperboard (short tons)182,198 193,285 195,097 190,339 186,350 Sales PricePaperboard ($/short ton)$ 968$ 975$ 948$ 936$ 935
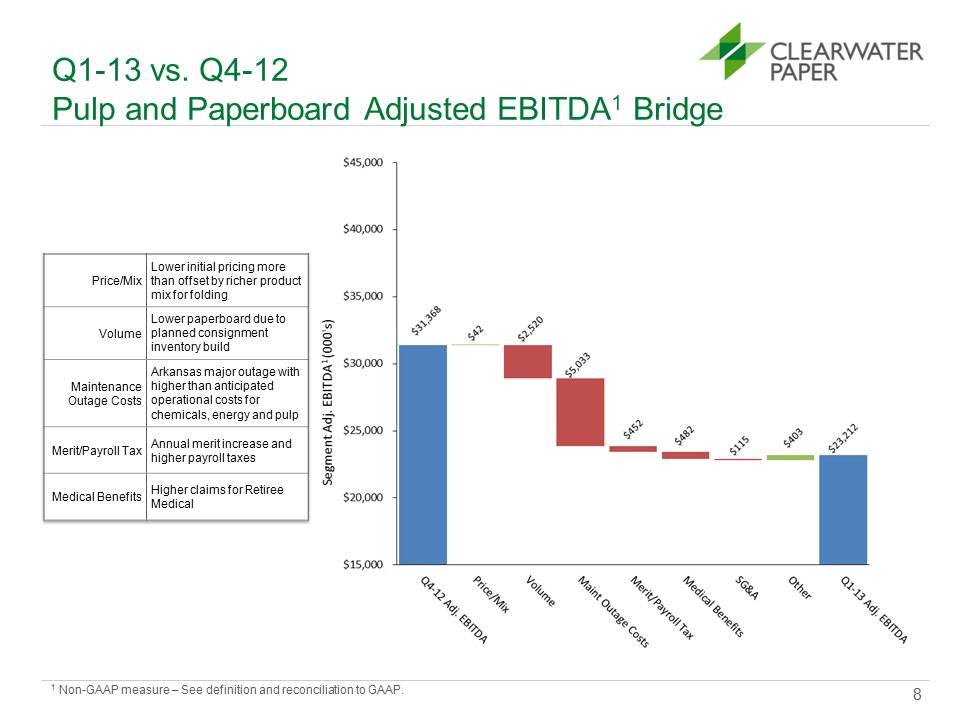
Q1-13 vs. Q4-12 Pulp and Paperboard Adjusted EBITDA1 Bridge 8 Price/Mix Lower initial pricing more than offset by richer product mix for folding Volume Lower paperboard due to planned consignment inventory build Maintenance Outage Costs Arkansas major outage with higher than anticipated operational costs for chemicals, energy and pulp Merit/Payroll Tax Annual merit increase and higher payroll taxes Medical Benefits Higher claims for Retiree Medical 1 Non-GAAP measure – See definition and reconciliation to GAAP. Price/Mix Volume Maint Outage Costs Merit/Payroll Tax Medical benefits SG&A Other Q1-13 $31,368 42 2,520 5,033 452 482 115 403 23,212
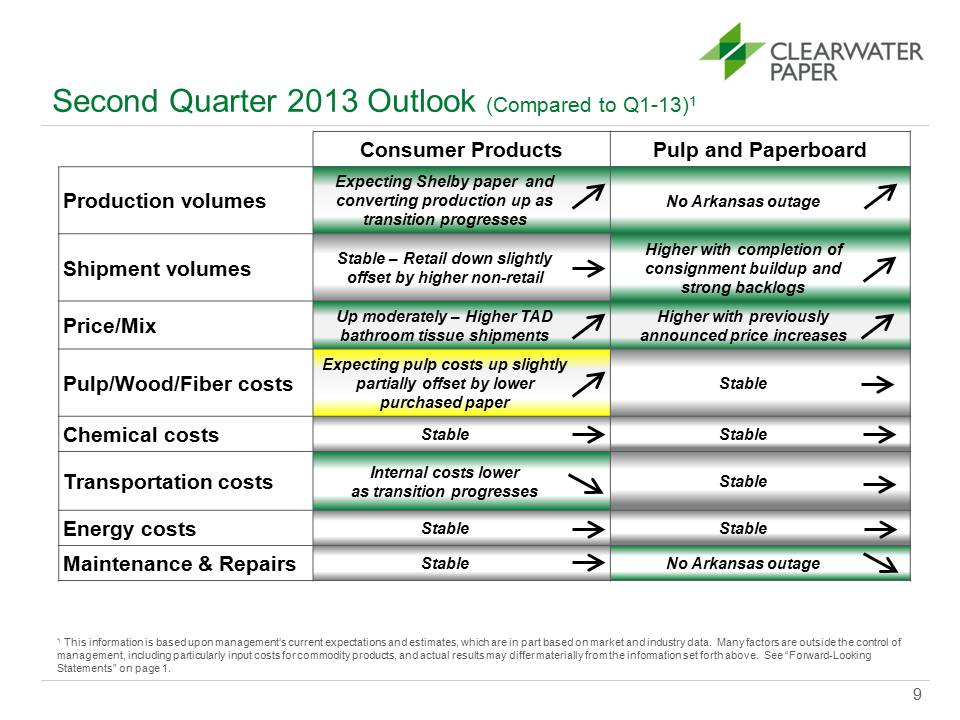
Second Quarter 2013 Outlook (Compared to Q1-13)1 Consumer Products Pulp and Paperboard Production volumes Expecting Shelby paper and converting production up as transition progresses No Arkansas outage Shipment volumes Stable – Retail down slightly offset by higher non-retail Higher with completion of consignment buildup and strong backlogs Price/Mix Higher TAD bathroom tissue shipments Higher with previously announced price increases Pulp/Wood/Fiber costs Expecting pulp costs up slightly partially offset by lower purchased paper Stable Chemical costs Stable Stable Transportation costs Internal costs lower as transition progresses Stable Energy costs Stable Stable Maintenance & Repairs Stable No Arkansas outage 9 1 This information is based upon management’s current expectations and estimates, which are in part based on market and industry data. Many factors are outside the control of management, including particularly input costs for commodity products, and actual results may differ materially from the information set forth above. See “Forward-Looking Statements” on page 1.Up moderately -
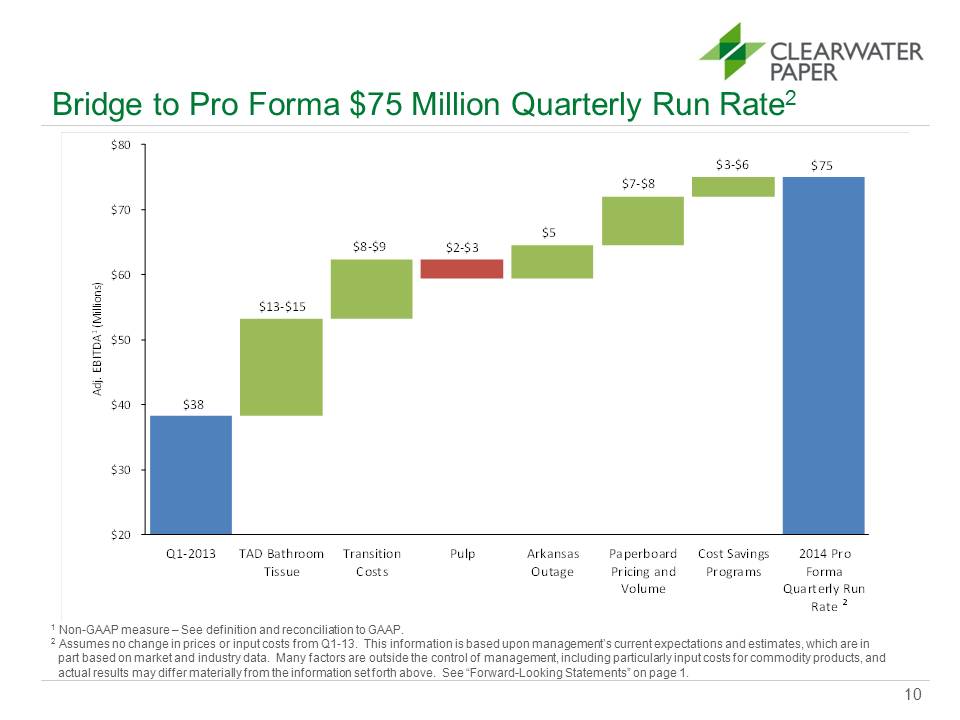
Bridge to Pro Forma $75 Million Quarterly Run Rate2 10 1 Non-GAAP measure – See definition and reconciliation to GAAP. 2 Assumes no change in prices or input costs from Q1-13. This information is based upon management’s current expectations and estimates, which are in part based on market and industry data. Many factors are outside the control of management, including particularly input costs for commodity products, and actual results may differ materially from the information set forth above. See “Forward-Looking Statements” on page 1. $20 $30 $40 $50 $60 $70 $80 Q1‐2013 TAD Bathroom Tissue Transition Costs Pulp Arkansas Outage Paperboard Pricing and Volume Cost Savings Programs 2014 Pro Forma Quarterly Run Rate Adj. EBITDA1 (Millions) $8‐$9 $5 $7‐$8 $75 $13‐$15 $38 $2‐$3 $3‐$6 2
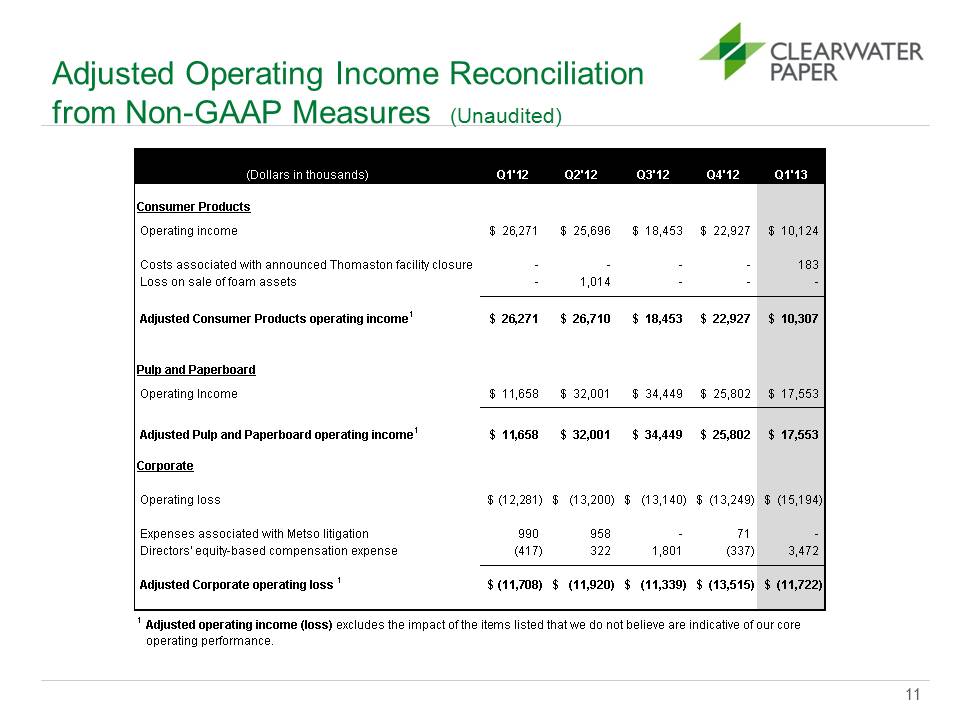
Adjusted Operating Income Reconciliation from Non-GAAP Measures (Unaudited) 11 (Dollars in thousands)Q1'12Q2'12Q3'12Q4'12Q1'13Consumer Products Operating income$ 26,271$ 25,696$ 18,453$ 22,927$ 10,124 Costs associated with announced Thomaston facility closure- - - - 183 Loss on sale of foam assets- 1,014 - - - Adjusted Consumer Products operating income1$ 26,271$ 26,710$ 18,453$ 22,927$ 10,307Pulp and Paperboard Operating Income$ 11,658$ 32,001$ 34,449$ 25,802$ 17,553 Adjusted Pulp and Paperboard operating income1$ 11,658$ 32,001$ 34,449$ 25,802$ 17,553Corporate Operating loss(12,281)$ (13,200)$ (13,140)$ (13,249)$ (15,194)$ Expenses associated with Metso litigation990 958 - 71 - Directors' equity-based compensation expense(417) 322 1,801 (337) 3,472 Adjusted Corporate operating loss 1(11,708)$ (11,920)$ (11,339)$ (13,515)$ (11,722)$ 1 Adjusted operating income (loss) excludes the impact of the items listed that we do not believe are indicative of our core operating performance.
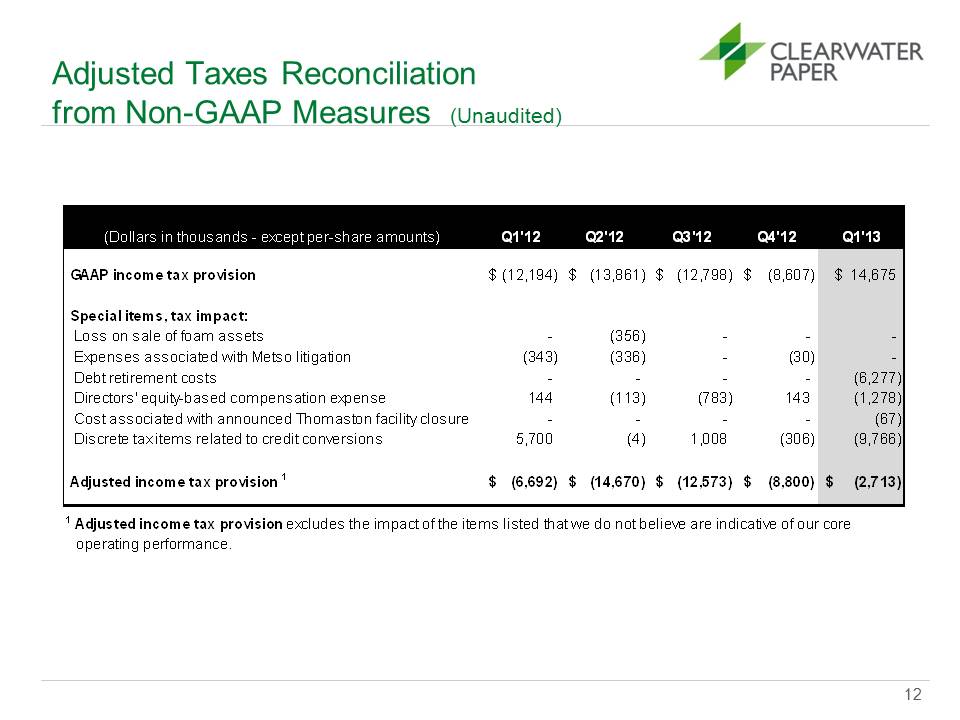
Adjusted Taxes Reconciliation from Non-GAAP Measures (Unaudited) 12 (Dollars in thousands - except per-share amounts) Q1'12 Q2'12 Q3'12 Q4'12 Q1'13 GAAP income tax provision (12,194) $ (13,861) $ (12,798) $ (8,607) $ $ 14,675 Special items, tax impact: Loss on sale of foam assets - (356) - - - Expenses associated with Metso litigation (343) (336) - (30) - Debt retirement costs - - - - (6,277) Directors' equity-based compensation expense 144 (113) (783) 143 (1,278) Cost associated with announced Thomaston facility closure - - - - (67) Discrete tax items related to credit conversions 5,700 (4) 1,008 (306) (9,766) Adjusted income tax provision 1 (6,692) $ (14,670) $ (12,573) $ (8,800) $ (2,713) $ 1 Adjusted income tax provision excludes the impact of the items listed that we do not believe are indicative of our core operating performance.
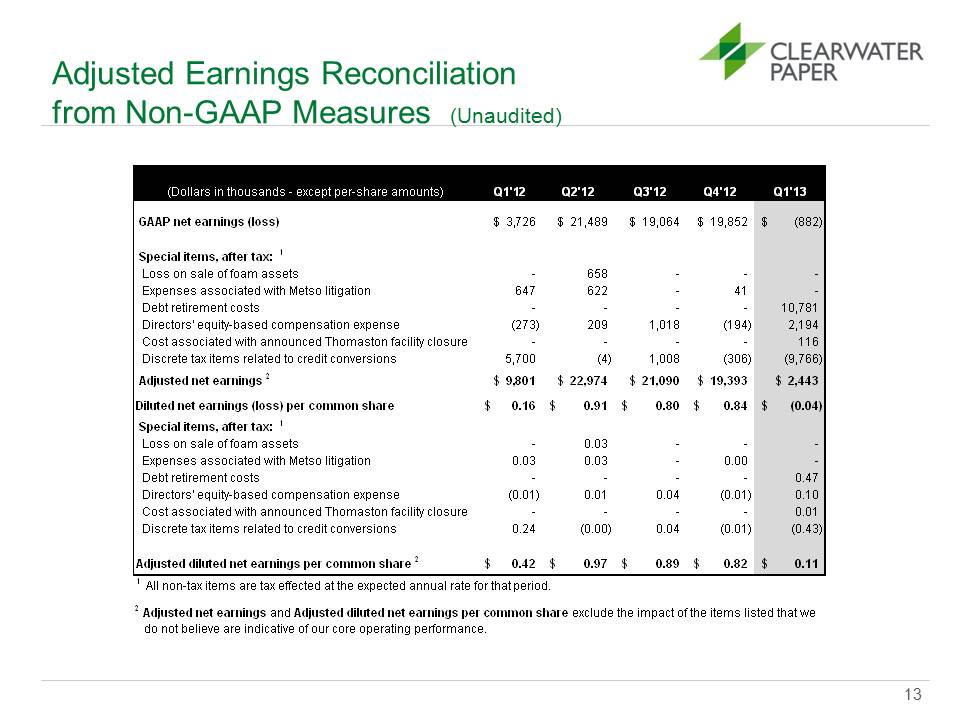
Adjusted Earnings Reconciliation from Non-GAAP Measures (Unaudited) 13 (Dollars in thousands - except per-share amounts)Q1'12Q2'12Q3'12Q4'12Q1'13 GAAP net earnings (loss)$ 3,726$ 21,489$ 19,064$ 19,852(882)$ Special items, after tax: 1 Loss on sale of foam assets- 658 - - - Expenses associated with Metso litigation647 622 - 41 - Debt retirement costs- - - - 10,781 Directors' equity-based compensation expense(273) 209 1,018 (194) 2,194 Cost associated with announced Thomaston facility closure- - - - 116 Discrete tax items related to credit conversions5,700 (4) 1,008 (306) (9,766) Adjusted net earnings 2$ 9,801$ 22,974$ 21,090$ 19,393$ 2,443Diluted net earnings (loss) per common share0.16$ 0.91$ 0.80$ 0.84$ (0.04)$ Special items, after tax: 1 Loss on sale of foam assets- 0.03 - - - Expenses associated with Metso litigation0.03 0.03 - 0.00 - Debt retirement costs- - - - 0.47 Directors' equity-based compensation expense(0.01) 0.01 0.04 (0.01) 0.10 Cost associated with announced Thomaston facility closure- - - - 0.01 Discrete tax items related to credit conversions0.24 (0.00) 0.04 (0.01) (0.43) Adjusted diluted net earnings per common share 20.42$ 0.97$ 0.89$ 0.82$ 0.11$ 2 Adjusted net earnings and Adjusted diluted net earnings per common share exclude the impact of the items listed that we do not believe are indicative of our core operating performance.1 All non-tax items are tax effected at the expected annual rate for that period.
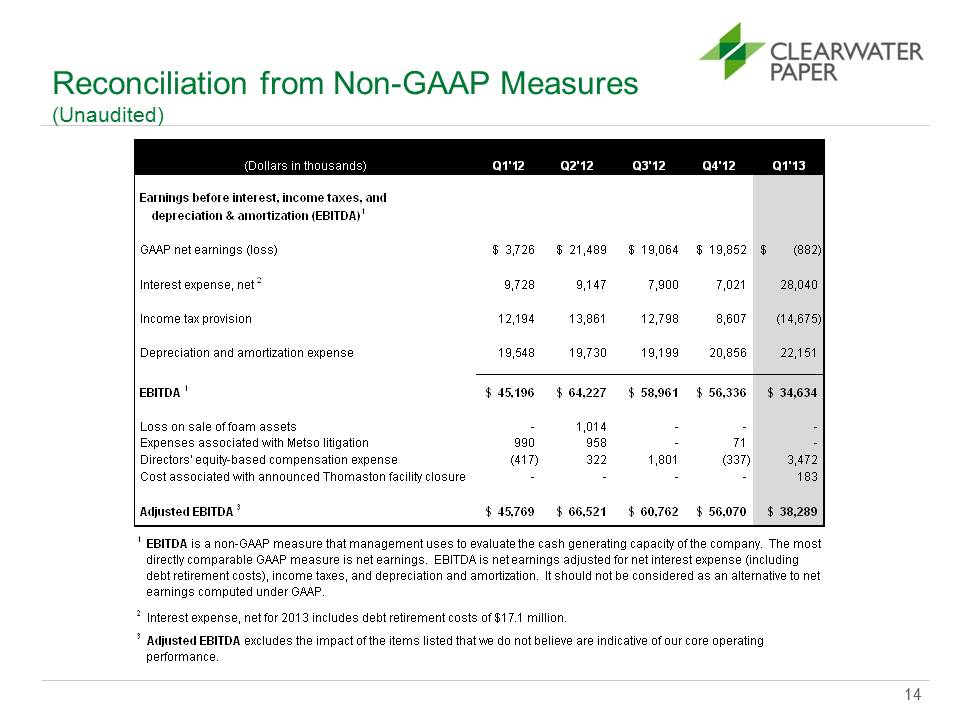
Reconciliation from Non-GAAP Measures (Unaudited) 12 (Dollars in thousands)Q1'12Q2'12Q3'12Q4'12Q1'13 Earnings before interest, income taxes, and depreciation & amortization (EBITDA)1 GAAP net earnings (loss)$ 3,726$ 21,489$ 19,064$ 19,852(882)$ Interest expense, net 29,7289,1477,9007,02128,040 Income tax provision12,19413,86112,7988,607(14,675) Depreciation and amortization expense19,54819,73019,19920,85622,151 EBITDA 1$ 45,196$ 64,227$ 58,961$ 56,336$ 34,634 Loss on sale of foam assets- 1,014 - - - Expenses associated with Metso litigation990 958 - 71 - Directors' equity-based compensation expense(417) 322 1,801 (337) 3,472 Cost associated with announced Thomaston facility closure- - - - 183 Adjusted EBITDA 3$ 45,769$ 66,521$ 60,762$ 56,070$ 38,2891 EBITDA is a non-GAAP measure that management uses to evaluate the cash generating capacity of the company. The most directly comparable GAAP measure is net earnings. EBITDA is net earnings adjusted for net interest expense (including debt retirement costs), income taxes, and depreciation and amortization. It should not be considered as an alternative to net earnings computed under GAAP.2 Interest expense, net for 2013 includes debt retirement costs of $17.1 million.3 Adjusted EBITDA excludes the impact of the items listed that we do not believe are indicative of our core operating performance.
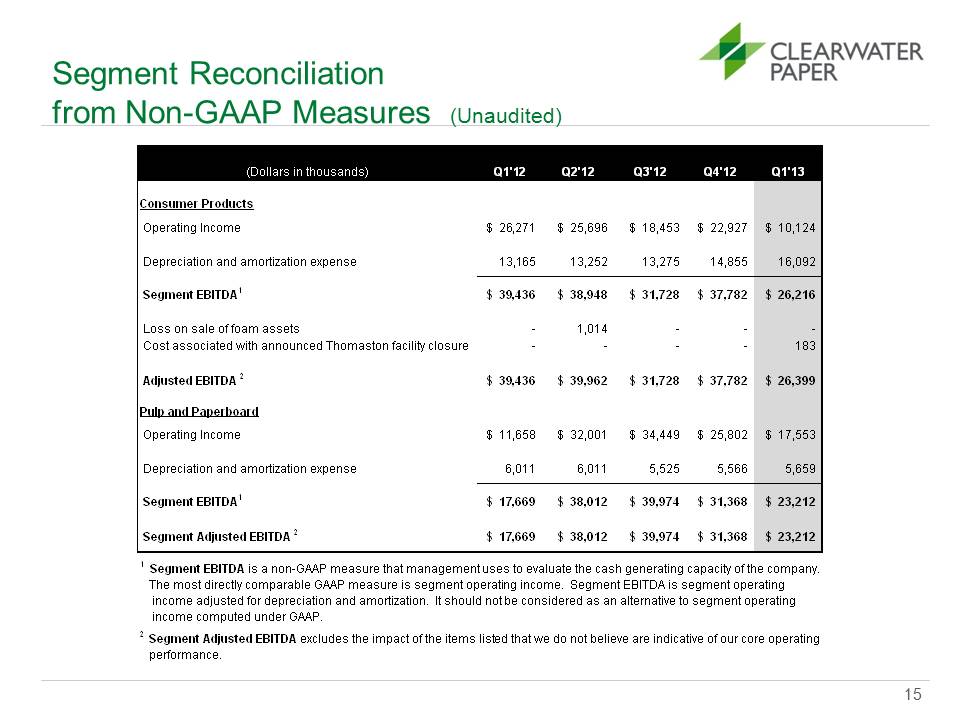
Segment Reconciliation from Non-GAAP Measures (Unaudited) 14 (Dollars in thousands)Q1'12Q2'12Q3'12Q4'12Q1'13Consumer Products Operating Income$ 26,271$ 25,696$ 18,453$ 22,927$ 10,124 Depreciation and amortization expense13,165 13,252 13,275 14,855 16,092 Segment EBITDA1$ 39,436$ 38,948$ 31,728$ 37,782$ 26,216 Loss on sale of foam assets- 1,014 - - - Cost associated with announced Thomaston facility closure- - - - 183 Adjusted EBITDA 2$ 39,436$ 39,962$ 31,728$ 37,782$ 26,399Pulp and Paperboard Operating Income$ 11,658$ 32,001$ 34,449$ 25,802$ 17,553 Depreciation and amortization expense6,011 6,011 5,525 5,566 5,659 Segment EBITDA1$ 17,669$ 38,012$ 39,974$ 31,368$ 23,212 Segment Adjusted EBITDA 2$ 17,669$ 38,012$ 39,974$ 31,368$ 23,212 1 Segment EBITDA is a non-GAAP measure that management uses to evaluate the cash generating capacity of the company. The most directly comparable GAAP measure is segment operating income. Segment EBITDA is segment operating income adjusted for depreciation and amortization. It should not be considered as an alternative to segment operating income computed under GAAP.2 Segment Adjusted EBITDA excludes the impact of the items listed that we do not believe are indicative of our core operating performance

For more information: www.clearwaterpaper.com