Attached files
| file | filename |
|---|---|
| 8-K - DISCOVER FINANCIAL SERVICES 8-K - Discover Financial Services | a50614348.htm |
| EX-99.2 - EXHIBIT 99.2 - Discover Financial Services | a50614348ex99_2.htm |
| EX-99.1 - EXHIBIT 99.1 - Discover Financial Services | a50614348ex99_1.htm |
Exhibit 99.3

Discover 1Q13 Financial Results April 23, 2013 ©2013 DISCOVER FINANCIAL SERVICES
Notice The following slides are part of a presentation by Discover Financial Services (the "Company") in connection with reporting quarterly financial results and are intended to be viewed as part of that presentation. No representation is made that the information in these slides is complete. For additional financial, statistical, and business related information, as well as information regarding business and segment trends, see the earnings release and financial supplement included as exhibits to the Company’s Current Report on Form 8-K filed today and available on the Company’s website (www.discoverfinancial.com) and the SEC’s website(www.sec.gov). Company financial data presented herein is based on a calendar year. As previously reported, the Company changed its fiscal year end from November 30 to December 31 of each year, effective beginning with the 2013 fiscal year. For more information, see the Company's Current Report on Form 8-K dated March 5, 2013, which includes the Company's financial results on a calendar-year basis for each quarter in 2012 and 2011, as well as the twelve months ended December 31, 2012, 2011 and 2010, and is available on the Company’s website and the SEC’s website. The information provided herein includes certain non-GAAP financial measures. The reconciliations of such measures to the comparable GAAP figures are included at the end of this presentation, which is available on the Company’s website and the SEC’s website. The presentation contains forward-looking statements. You are cautioned not to place undue reliance on forward-looking statements, which speak only as of the date on which they are made, which reflect management’s estimates, projections, expectations or beliefs at that time, and which are subject to risks and uncertainties that may cause actual results to differ materially. For a discussion of certain risks and uncertainties that may affect the future results of the Company, please see "Special Note Regarding Forward-Looking Statements," "Risk Factors," "Business –Competition," "Business –Supervision and Regulation" and "Management’s Discussion and Analysis of Financial Condition and Results of Operations" in the Company’s Annual Report on Form 10-K for the year ended November 30, 2012, which is available on the Company’s website and the SEC’s website. The Company does not undertake to update or revise forward-looking statements as more information becomes available. 2
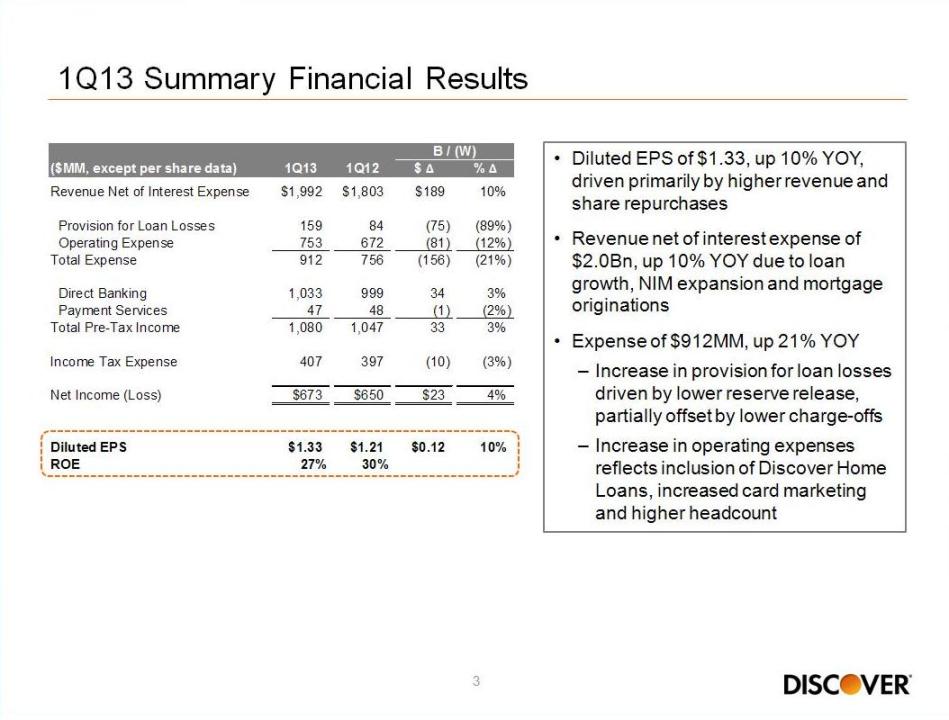
1Q13 Summary Financial Results ($MM, except per share data) 1Q13 1Q12 B/(W) $ % Revenue Net of Interest Expense $1,992 $1,803 $189 10% Provision for Loan Losses 159 84 (75) (89%) Operating Expense 753 672 (81) (12%) Total Expense 912 756 (156) (21%) Direct Banking 1,033 999 34 3% Payment Services 47 48 (1) (2%) Total Pre-Tax Income 1,080 1,047 33 3% Income Tax Expense 407 397 (10) (3%) Net Income (Loss) $673 $650 $23 4% Diluted EPS $1.33 $1.21 $0.12 10% ROE 27% 30% Diluted EPS of $1.33, up 10% YOY, driven primarily by higher revenue and share repurchases Revenue net of interest expense of $2.0Bn, up 10% YOY due to loan growth, NIM expansion and mortgage originations Expense of $912MM, up 21% YOY Increase in provision for loan losses driven by lower reserve release, partially offset by lower charge-offs Increase in operating expenses reflects inclusion of Discover Home Loans, increased card marketing and higher headcount 3
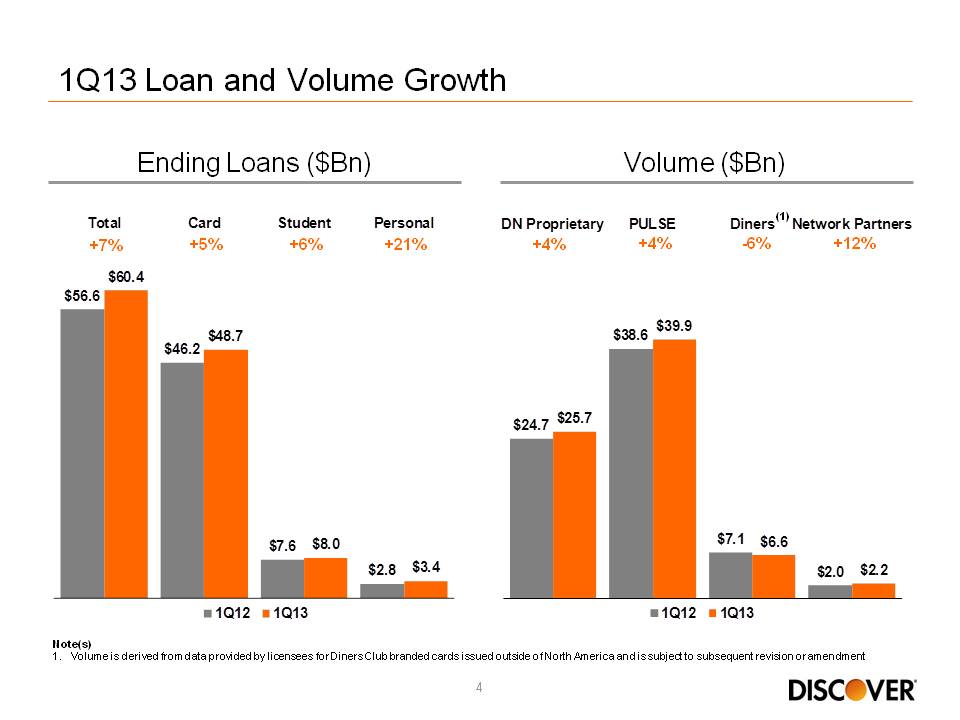
1Q13 Loan and Volume Growth Ending Loans ($Bn) Volume ($Bn) Total +7% Card +5% Student +6% Personal +21% $56.6 $60.4 $46.2 $8.7 $7.6 $8.0 $2.8 $3.4 1Q12 1Q13 DN Proprietary +4% PULSE +4% Diners(1) -6% Network Partners +12% $24.7 $25.7 $38.6 $39.9 $7.1 $6.6 $2.0 $2.2 1Q12 1Q13 Note(s) 1.Volume is derived from data provided by licensees for Diners Club branded cards issued outside of North America and is subject to subsequent revision or amendment 4
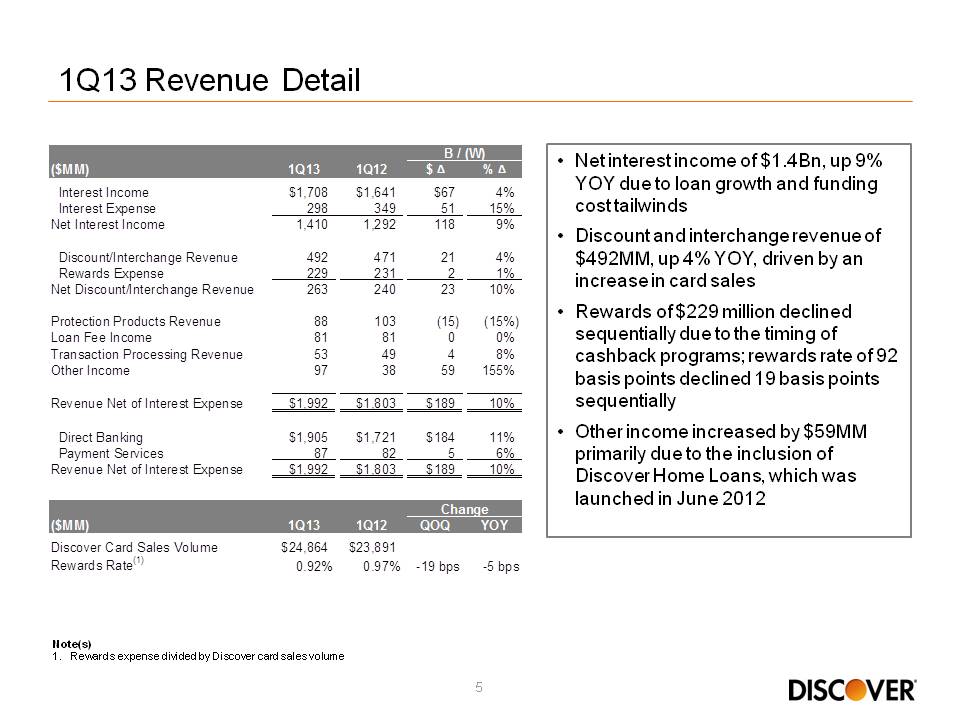
1Q13 Revenue Detail ($MM) 1Q13 1Q12 B/(W) $ % Interest Income $1,708 $1,641 $67 4% Interest Expense 298 349 51 15% Net Interest Income 1,410 1,292 118 9% Discount/Interchange Revenue 492 471 21 4% Rewards Expense 229 231 2 1% Net Discount/Interchange Revenue 263 240 23 10% Protection Products Revenue 88 103 (15) (15%) Loan Fee Income 81 81 0 0% Transaction Processing Revenue 53 49 4 8% Other Income 97 38 59 155% Revenue Net of Interest Expense $1,992 $1,803 $189 10% Direct Banking $1,905 $1,721 $184 11% Payment Services 87 82 5 6% Revenue Net of Interest Expense $1,992 $1,803 $189 10% ($MM) 1Q13 1Q12 Change QOQ YOY Discover Card Sales Volume $24,864 $23,891 Rewards Rate(1) 0.92% 0.97% -19 bps -5 bps Net interest income of $1.4Bn, up 9% YOY due to loan growth and funding cost tailwinds Discount and interchange revenue of $492MM, up 4% YOY, driven by an increase in card sales Rewards of $229 million declined sequentially due to the timing of cashback programs; rewards rate of 92 basis points declined 19 basis points sequentially Other income increased by $59MM primarily due to the inclusion of Discover Home Loans, which was launched in June 2012 Note(s) 1.Rewards expense divided by Discover card sales volume 5
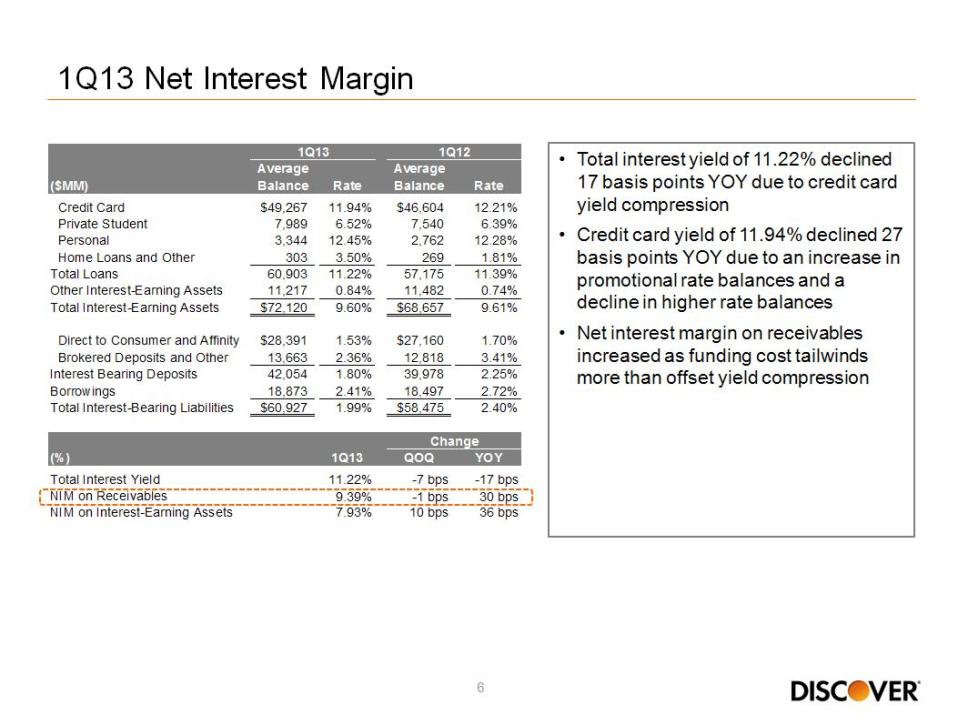
1Q13 Net Interest Margin ($MM) 1Q13 Average Balance Rate 1Q12 Average Balance Rate Credit Card $49,267 11.94% $46,604 12.21% Private Student 7,989 6.52% 7,540 6.39% Personal 3,344 12.45% 2,762 12.28% Home Loans and Other 303 3.50% 269 1.81% Total Loans 60,903 11.22% 57,175 11.39% Other Interest-Earning Assets 11,217 0.84% 11,482 0.74% Total Interest-Earning Assets $72,120 9.60% $68,657 9.61% Direct to Consumer and Affinity $28,391 1.53% $27,160 1.70% Brokered Deposits and Other 13,663 2.36% 12,818 3.41% Interest Bearing Deposits 42,054 1.80% 39,978 2.25% Borrowings 18,873 2.41% 18,497 2.72% Total Interest-Bearing Liabilities $60,927 1.99% $58,475 2.40% (%) 1Q13 Change QOQ YOY Total Interest Yield 11.22% -7 bps -17 bps NIM on Receivables 9.39% -1 bps 30 bps NIM on Interest-Earning Assets 7.93% 10 bps 36 bps Total interest yield of 11.22% declined 17 basis points YOY due to credit card yield compression Credit card yield of 11.94% declined 27 basis points YOY due to an increase in promotional rate balances and a decline in higher rate balances Net interest margin on receivables increased as funding cost tailwinds more than offset yield compression 6
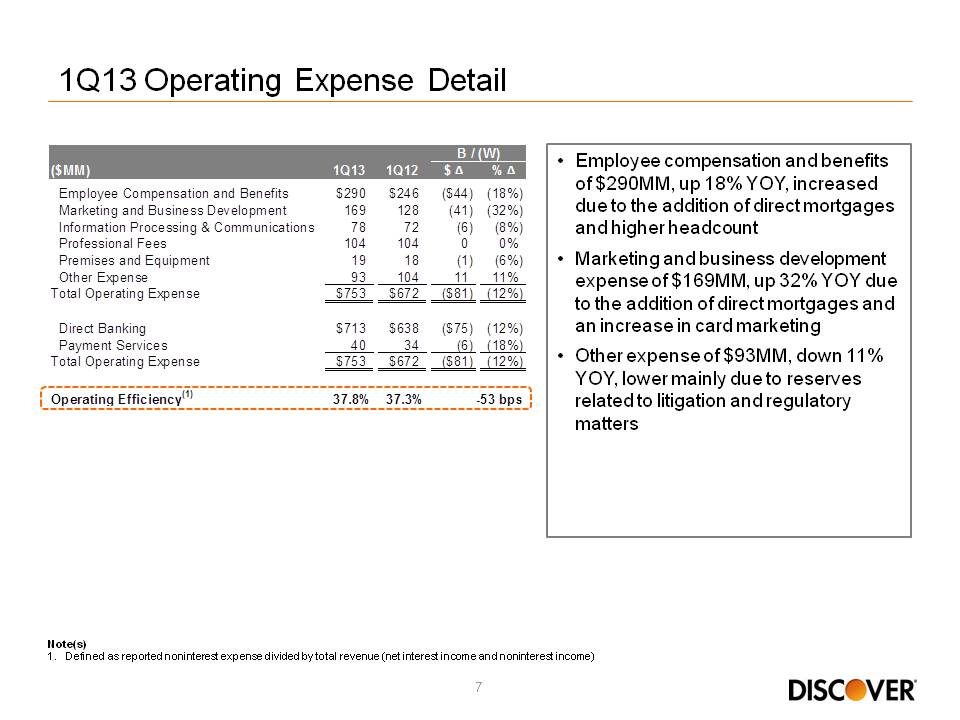
1Q13 Operating Expense Detail ($MM) 1Q13 1Q12 B/(W) $ % Employee Compensation and Benefits $290 $246 ($44) (18%) Marketing and Business Development 169 128 (41) (32%) Information Processing & Communications 78 72 (6) (8%) Professional Fees 104 104 0 0% Premises and Equipment 19 18 (1) (6%) Other Expense 93 104 11 11% Total Operating Expense $753 $672 ($81) (12%) Direct Banking $713 $638 ($75) (12%) Payment Services 40 34 (6) (18%) Total Operating Expense $753 $672 ($81) (12%) Operating Efficiency(1) 37.8% 37.3% -53 bps Employee compensation and benefits of $290MM, up 18% YOY, increased due to the addition of direct mortgages and higher headcount Marketing and business development expense of $169MM, up 32% YOY due to the addition of direct mortgages and an increase in card marketing Other expense of $93MM, down 11% YOY, lower mainly due to reserves related to litigation and regulatory matters Note(s) 1.Defined as reported noninterest expense divided by total revenue (net interest income and noninterest income) 7
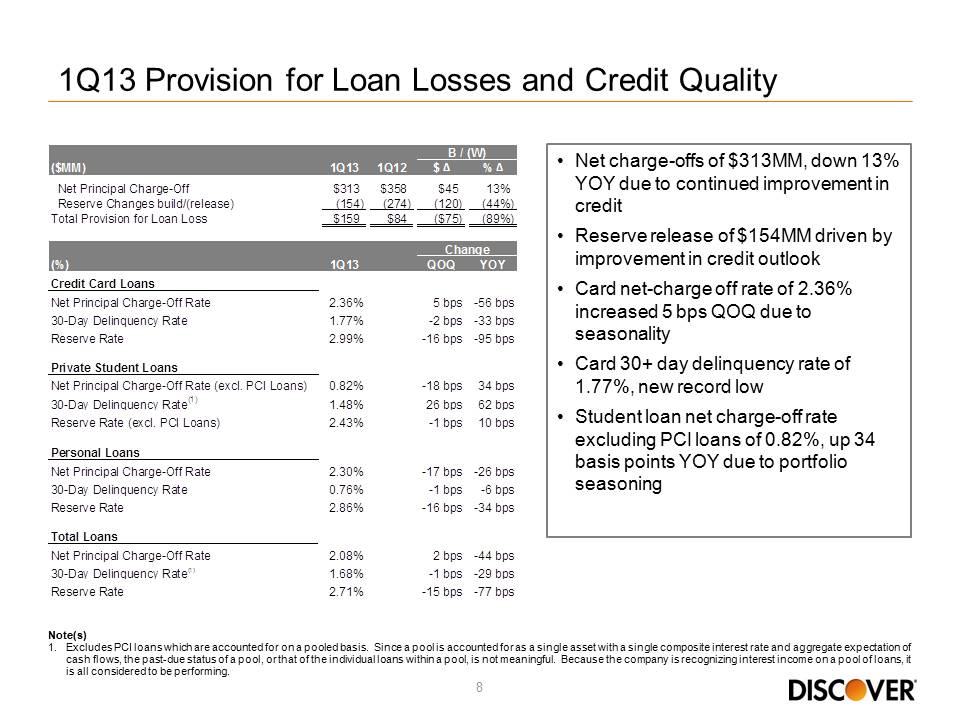
1Q13 Provision for Loan Losses and Credit Quality ($MM) 1Q13 1Q12 B/(W) $ % Net Principal Charge-Off $313 $358 $45 13% Reserve Changes build/(release) (154) (274) (120) (44%) Total Provision for Loan Loss $159 $84 ($75) (89%) (%) 1Q13 Change QOQ YOY Credit Card Loans Net Principal Charge-Off Rate 2.36% 5 bps -56 bps 30-Day Delinquency Rate 1.77% -2 bps -33 bps Reserve Rate 2.99% -16 bps -95 bps Private Student Loans Net Principal Charge-Off Rate (excl. PCI Loans) 0.82% -18 bps 34 bps 30-Day Delinquency Rate(1) 1.48% 26 bps 62 bps Reserve Rate (excl. PCI Loans) 2.43% -1 bps 10 bps Personal Loans Net Principal Charge-Off Rate 2.30% -17 bps -26 bps 30-Day Delinquency Rate 0.76% -1 bps -6 bps Reserve Rate 2.86% -16 bps -34 bps Total Loans Net Principal Charge-Off Rate 2.08% 2 bps -44 bps 30-Day Delinquency Rate(1) 1.68% -1 bps -29 bps Reserve Rate 2.71% -15 bps -77 bps Net charge-offs of $313MM, down 13% YOY due to continued improvement in credit Reserve release of $154MM driven by improvement in credit outlook Card net-charge off rate of 2.36% increased 5 bps QOQ due to seasonality Card 30+ day delinquency rate of 1.77%, new record low Student loan net charge-off rate excluding PCI loans of 0.82%, up 34 basis points YOY due to portfolio seasoning Note(s) 1.Excludes PCI loans which are accounted for on a pooled basis. Since a pool is accounted for as a single asset with a single composite interest rate and aggregate expectation of cash flows, the past-due status of a pool, or that of the individual loans within a pool, is not meaningful. Because the company is recognizing interest income on a pool of loans, it is all considered to be performing 8
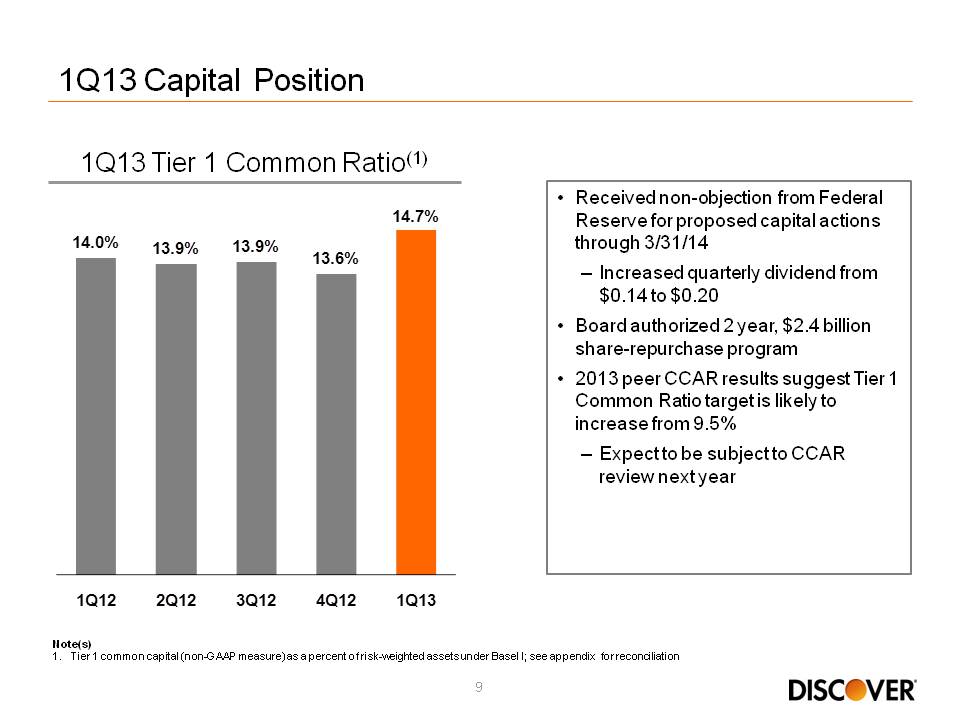
1Q13 Capital Position 1Q13 Tier 1 Common Ratio(1) 14.0% 13.9% 13.9% 13.6% 14.7% 1Q12 2Q12 3Q12 4Q12 1Q13 Received non-objection from Federal Reserve for proposed capital actions through 3/31/14 Increased quarterly dividend from $0.14 to $0.20 Board authorized 2 year, $2.4 billion share-repurchase program 2013 peer CCAR results suggest Tier 1 Common Ratio target is likely to increase from 9.5% Expect to be subject to CCAR review next year Note(s) 1.Tier 1 common capital (non-GAAP measure) as a percent of risk-weighted assets under Basel I; see appendix for reconciliation 9

Appendix
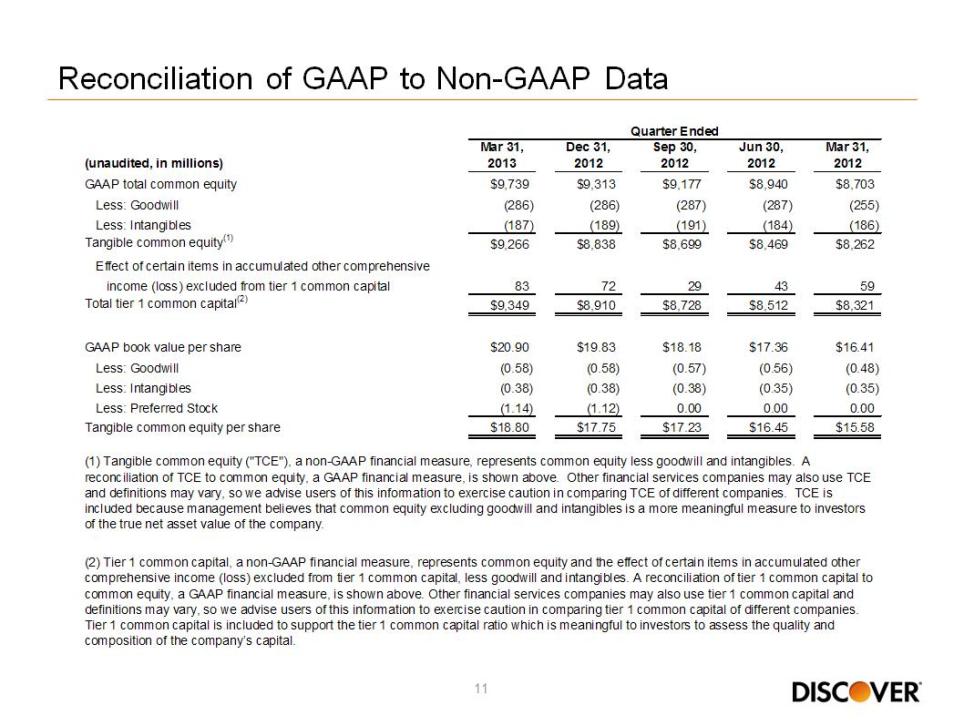
Reconciliation of GAAP to Non-GAAP Data (unaudited, in millions) Quarter Ended Mar 31, 2013 Dec 31, 2012 Sep 30, 2012 Jun 30, 2012 Mar 31, 2012 GAAP total common equity $9,739 $9,313 $9,177 $8,940 $8,703 Less: Goodwill (286) (286) (287) (287) (255) Less: Intangibles (187) (189) (191) (184) (186) Tangible common equity 1 $9,266 $8,838 $8,699 $8,469 $8,262 Effect of certain items in accumulated other comprehensive income (loss) excluded from tier 1 common capital 83 72 29 43 59 Total tier 1 common capital 2 $9,349 $8,910 $8,728 $8,512 $8,321 GAAP book value per share $20.90 $19.83 $18.18 $17.36 $16.41 Less: Goodwill (0.58) (0.58) (0.57) (0.56) (0.48) Less: Intangibles (0.38) (0.38) (0.38) (0.35) (0.35) Less: Preferred Stock (1.14) (1.12) 0.00 0.00 0.00 Tangible common equity per share $18.80 $17.75 $17.23 $16.45 $15.58 1. Tangible common equity ("TCE"), a non-GAAP financial measure, represents common equity less goodwill and intangibles. A reconciliation of TCE to common equity, a GAAP financial measure, is shown above. Other financial services companies may also use TCE and definitions may vary, so we advise users of this information to exercise caution in comparing TCE of different companies. TCE is included because management believes that common equity excluding goodwill and intangibles is a more meaningful measure to investors of the true net asset value of the company. 2. Tier 1 common capital, a non-GAAP financial measure, represents common equity and the effect of certain items in accumulated other comprehensive income (loss) excluded from tier 1 common capital, less goodwill and intangibles. A reconciliation of tier 1 common capital to common equity, a GAAP financial measure, is shown above. Other financial services companies may also use tier 1 common capital and definitions may vary, so we advise users of this information to exercise caution in comparing tier 1 common capital of different companies. Tier 1 common capital is included to support the tier 1 common capital ratio which is meaningful to investors to assess the quality and composition of the company’s capital. 11