Attached files
| file | filename |
|---|---|
| EX-99.1 - PRESS RELEASE DATED APRIL 19, 2013 - ManpowerGroup Inc. | exhibit_99-1.htm |
| 8-K - FORM 8-K - ManpowerGroup Inc. | form_8k.htm |
Exhibit 99.2

ManpowerGroup First Quarter Results April 19, 2013

Forward-Looking Statement This presentation includes forward-looking statements, including earnings projections which are subject to risks and uncertainties. Actual results might differ materially from those projected in the forward-looking statements. Additional information concerning factors that could cause actual results to materially differ from those in the forward-looking statements is contained in the ManpowerGroup Inc. Annual Report on Form 10-K dated December 31, 2012, which information is incorporated herein by reference, and such other factors as may be described from time to time in the Company’s SEC filings. *

As Reported Excluding Non-recurring Items Q1 Financial Highlights 6% 6% Revenue $4.8B 6% CC 6% CC Revenue $4.8B 0 bps 0 bps Gross Margin 16.6% 42% 5% Operating Profit $54M 41% CC 3% CC Operating Profit $54M 70 bps 10 bps OP Margin 1.1% 38% 26% EPS $.31 36% CC 28% CC EPS $.31 Throughout this presentation, the difference between reported variances and Constant Currency (CC) variances represents the impact of currency on our financial results. Constant Currency is further explained on our Web site. Consolidated Financial Highlights * (1) Excludes the impact of restructuring charges of $34.8M (1)

EPS Bridge – Q1 vs. Guidance Midpoint (1) Includes charges as follows: Americas ($5.9M), Southern Europe ($1.2M), Northern Europe ($17.1M), APME ($2.4M), Right Management ($3.8M), Corporate ($4.4M) (1) *
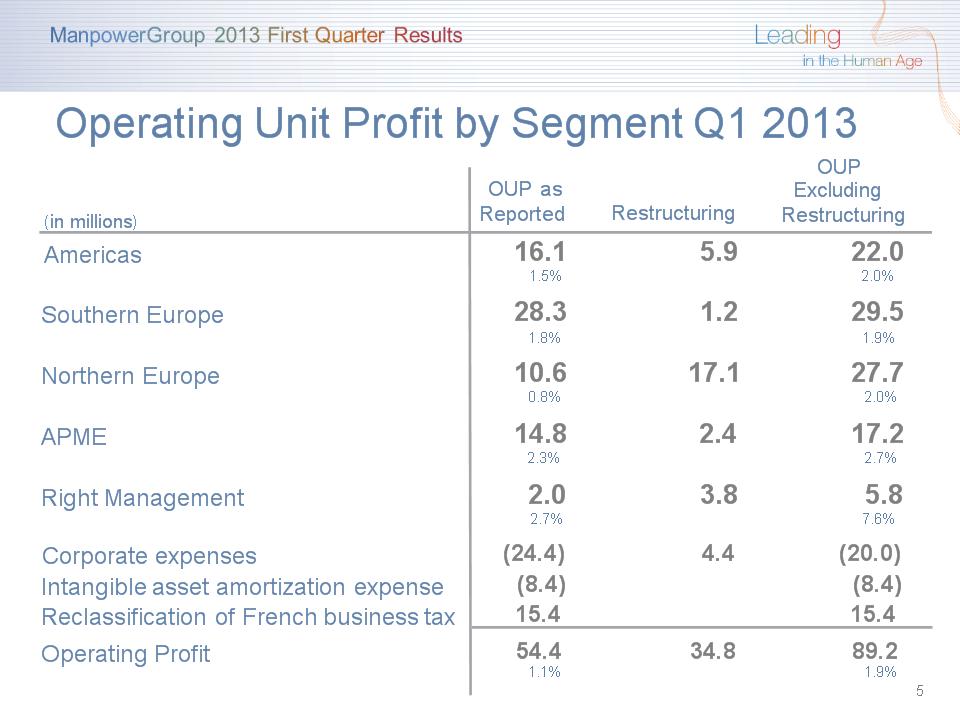
(in millions) OUP as Reported Restructuring OUP Excluding Restructuring Americas 16.1 5.9 22.0 1.5% 2.0% Southern Europe 28.3 1.2 29.5 1.8% 1.9% Northern Europe 10.6 17.1 27.7 0.8% 2.0% APME 14.8 2.4 17.2 2.3% 2.7% Right Management 2.0 3.8 5.8 2.7% 7.6% Corporate expenses (24.4) 4.4 (20.0) Intangible asset amortization expense (8.4) (8.4) Reclassification of French business tax 15.4 15.4 Operating Profit 54.4 34.8 89.2 1.1% 1.9% Operating Unit Profit by Segment Q1 2013 *

Simplification Plan Savings Total annualized SG&A reduction of $125M (4%) by December 2013. All regions and corporate impacted. Targeted 2013 P/L savings of $80M. Restructuring charges of $50M - $60M in 2013. (Millions) *

Consolidated Gross Margin Change *

* $790M Growth in CC % Business Line Gross Profit – Q1 2013 █ Manpower █ Experis █ ManpowerGroup - Total █ ManpowerGroup Solutions █ Right Management

SG&A Expense Bridge – Q1 YoY (in millions of USD) *
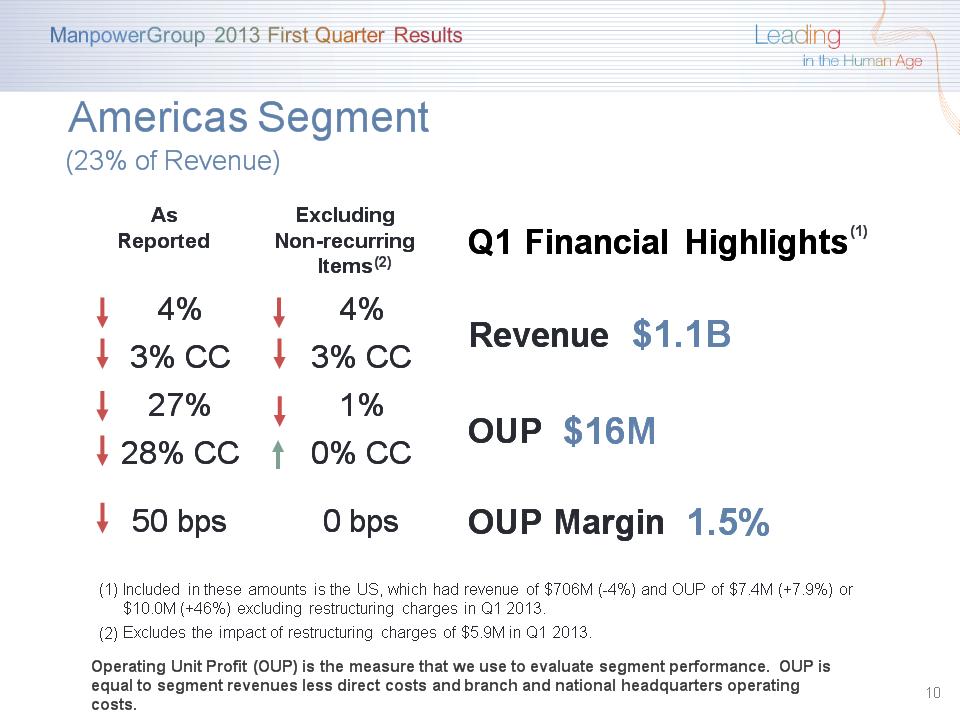
As Reported Excluding Non-recurring Items Q1 Financial Highlights 4% 4% Revenue $1.1B 3% CC 3% CC Revenue $1.1B 27% 1% OUP $16M 28% CC 0% CC OUP $16M 50 bps 0 bps OUP Margin 1.5% * (1) Americas Segment (23% of Revenue) Included in these amounts is the US, which had revenue of $706M (-4%) and OUP of $7.4M (+7.9%) or $10.0M (+46%) excluding restructuring charges in Q1 2013. Excludes the impact of restructuring charges of $5.9M in Q1 2013. Operating Unit Profit (OUP) is the measure that we use to evaluate segment performance. OUP is equal to segment revenues less direct costs and branch and national headquarters operating costs. (2)
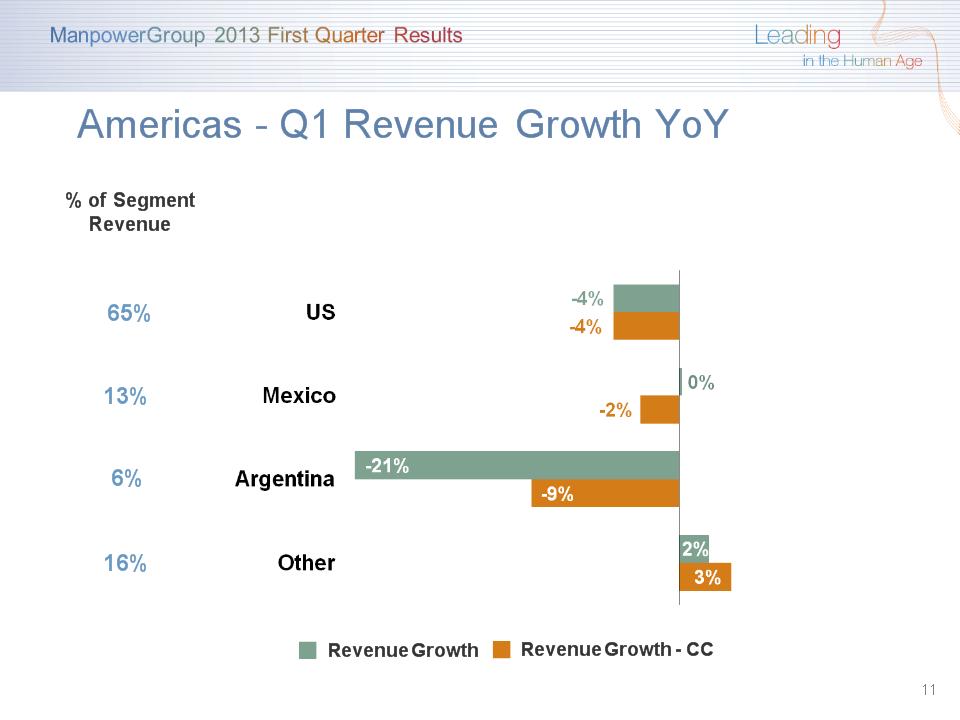
Americas – Q1 Revenue Growth YoY * Revenue Growth - CC Revenue Growth % of Segment Revenue 65% 13% 6% 16%

As Reported Excluding Non-recurring Items Q1 Financial Highlights 9% 9% Revenue $1.6B 10% CC 10% CC Revenue $1.6B 21% 26% OUP $28M 21% CC 26% CC OUP $28M 50 bps 60 bps OUP Margin 1.8% * (1) Southern Europe Segment (33% of Revenue) Included in these amounts is France, which had revenue of $1.1B (-12% CC) and OUP of $14M (+165% CC). On an organic basis, France revenue decreased 13% in CC. Excludes the impact of restructuring charges of $1.2M in Q1 2013. (2)

Southern Europe – Q1 Revenue Growth YoY * Revenue Growth - CC Revenue Growth % of Segment Revenue 72% 16% 5% 7% (1) (1) On an organic basis, France revenue decreased 12% (-13% in CC).
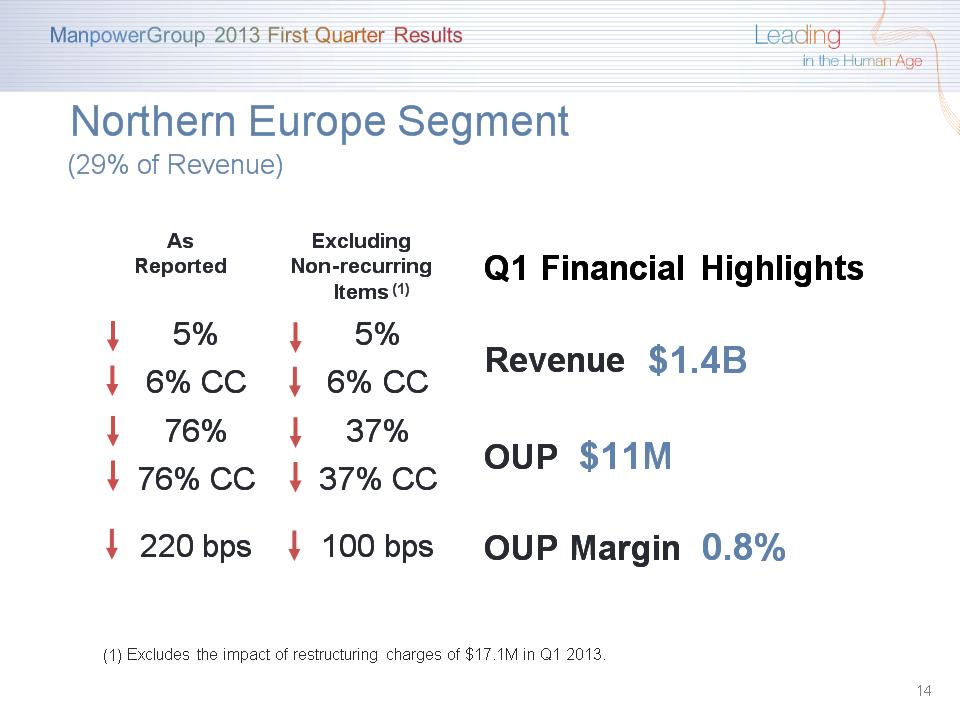
As Reported Excluding Non-recurring Items Q1 Financial Highlights 5% 5% Revenue $1.4B 6% CC 6% CC Revenue $1.4B 76% 37% OUP $11M 76% CC 37% CC OUP $11M 220 bps 100 bps OUP Margin 0.8% * Northern Europe Segment (29% of Revenue) (1) Excludes the impact of restructuring charges of $17.1M in Q1 2013.

Northern Europe – Q1 Revenue Growth YoY * Revenue Growth - CC Revenue Growth % of Segment Revenue 25% 23% 12% 9% 24% 7%

As Reported Excluding Non-recurring Items Q1 Financial Highlights 7% 7% Revenue $633M 1% CC 1% CC Revenue $633M 25% 13% OUP $15M 19% CC 7% CC OUP $15M 60 bps 20 bps OUP Margin 2.3% APME Segment (13% of Revenue) * (1) Excludes the impact of restructuring charges of $2.4M in Q1 2013.

APME – Q1 Revenue Growth YoY * Revenue Growth - CC Revenue Growth % of Segment Revenue 38% 26% 36%

* Right Management Segment (2% of Revenue) As Reported Excluding Non-recurring Items Q1 Financial Highlights 4% 4% Revenue $77M 3% CC 3% CC Revenue $77M 18% 134% OUP $2M 8% CC 143% CC OUP $2M 40 bps 450 bps OUP Margin 2.7% (1) Excludes the impact of restructuring charges of $3.8M in Q1 2013

($ in millions) 2013 2012 Net Earnings 24 40 Non-cash Provisions and Other 39 35 Change in Operating Assets/Liabilities (125) (96) Capital Expenditures (13) (19) Free Cash Flow (75) (40) Change in Debt 2 1 Effect of Exchange Rate Changes (3) 15 Other 11 (3) Change in Cash (65) (27) Cash Flow Summary – Q1 *

Balance Sheet Highlights * Total Debt ($ in millions) Total Debt to Total Capitalization Total Debt Net Debt

Interest Rate Maturity Date Total Outstanding at 3/31/13 Remaining Available at 3/31/13 Euro Notes: - Euro 200M 4.86% Jun 2013 256 - - Euro 350M 4.505% Jun 2018 449 - Revolving Credit Agreement 1.48% Oct 2016 - 799 Uncommitted lines and Other Various Various 46 318 Total Debt 751 1,117 Credit Facilities ($ in millions) * Represents subsidiary uncommitted lines of credit & overdraft facilities, which total $364.0M. Total subsidiary borrowings are limited to $300M due to restrictions in our Revolving Credit Facility, with the exception of Q3 when subsidiary borrowings are limited to $600M. (1) (2) (2) (1) The $800M agreement requires that we comply with a Leverage Ratio (Debt-to-EBITDA) of not greater than 3.5 to 1 and a Fixed Charge Coverage Ratio of not less than 1.5 to 1, in addition to other customary restrictive covenants. As defined in the agreement, we had a Debt-to-EBITDA ratio of 1.08 and a fixed charge coverage ratio of 2.78 as of March 31, 2013. As of March 31, 2013, there were $0.9M of standby letters of credit issued under the agreement.

Revenue Total Down 3-5% (Down 3-5% CC) Americas Up/Down 1% (Up/Down 1% CC) Southern Europe Down 7-9% (Down 8-10% CC) Northern Europe Down 1-3% (Down 1-3% CC) APME Down 5-7% (Down 0-2% CC) Right Management Right Management Down 2-4% (Down 1-3% CC) Gross Profit Margin Gross Profit Margin 16.6 – 16.8% Operating Profit Margin Operating Profit Margin 2.5 – 2.7% Tax Rate Tax Rate 42% EPS (before restructuring charges of $15-20M) EPS (before restructuring charges of $15-20M) $0.84 – $0.92 (no currency impact) Second Quarter Outlook * (32% excl. reclassification of France business tax)

Strategic Drivers *

Questions *