Attached files
| file | filename |
|---|---|
| EX-99.2 - EX-99.2 - DONEGAL GROUP INC | d523198dex992.htm |
| EX-99.3 - EX-99.3 - DONEGAL GROUP INC | d523198dex993.htm |
| 8-K - FORM 8-K - DONEGAL GROUP INC | d523198d8k.htm |
 Annual Meeting of
Stockholders
April 18, 2013
Exhibit 99.1 |
 Forward-Looking Statements
2
The Company bases all statements made in this presentation that are not historic facts on
its current expectations. These statements are forward-looking in nature (as
defined in the Private Securities Litigation Reform Act of 1995) and involve a number
of risks and uncertainties. Actual results could vary materially. Factors that could
cause actual results to vary materially include: the Company’s ability to
maintain profitable operations, the adequacy of the loss and loss expense reserves of
the Company’s insurance subsidiaries, business and economic conditions in the areas
in which the Company operates, interest rates, competition from various insurance and other
financial businesses, terrorism, the availability and cost of reinsurance, adverse and
catastrophic weather events, legal and judicial developments, changes in regulatory
requirements, the Company’s ability to integrate and manage successfully the
companies it may acquire from time to time and other risks the Company describes from
time to time in the periodic reports it files with the Securities and Exchange
Commission. You should not place undue reliance on any such forward-looking
statements. The Company disclaims any obligation to update such statements or to
announce publicly the results of any revisions that it may make to any forward-looking statements
to reflect the occurrence of anticipated or unanticipated events or circumstances after the
date of such statements.
Reconciliations of non-GAAP data are available in the Investors section of
the Company’s website at www.donegalgroup.com in the
Company’s news releases regarding quarterly financial results.
|
 President’s Report |
 Corporate Objective
Create value for shareholders, policyholders,
agents, employees and the communities we
serve by outperforming the property and
casualty insurance industry over time in terms
of service, profitability and book value growth |
 Multi-faceted Strategy to Achieve Strategic
Goals
•
Conservative underwriting
•
Pricing discipline and premium adequacy
•
Prudent organic and acquisition growth
•
Best-in-class technology
•
Effective and growing agency distribution
system
5 |
 Multi-faceted Strategy to Achieve Strategic
Goals
•
Superior claims service
•
Efficient operations
•
Conservative investing
•
Strong enterprise risk management
•
Recruiting, development and retention
of quality personnel
6 |
 2012
Financial
Results |
 Financial Results
8
2011
•
Total Revenues
$475,018,000
$514,983,000
•
Premiums Earned
$431,470,000
$475,002,000
•
Investment Income
$20,858,000
$20,168,000
•
Net Income
$453,000
$23,093,000
•
Statutory Combined Ratio
107.9%
99.8%
2012 |
 Balance Sheet Strength
9
December 31,
•
Total
Assets
•
Stockholders’
Equity
•
Book
Value
per
Share
$15.01
$15.63
$400,034,000
$383,452,000
$1,336,889,000
$1,290,793,000
2012
2011 |
 10
Investment Portfolio
* Excluding investments in affiliates
Short-Term
Securities
5%
Treasury
2%
Agency
7%
Corporate
10%
Mortgage
-Backed
Securities (MBS)
16%
Taxable Munis
2%
Equity
1%
$769 Million
in Invested
Assets*
Tax-Exempt Municipals
57% |
 Fixed
Maturity Investment Ratings December 31, 2012
11
U.S. Treasury and U.S. Agency Securities
$201,358,000
27.3%
Aaa or AAA
53,203,000
7.2%
Aa or AA
379,372,000
51.5%
A
89,338,000
12.1%
BBB
13,339,000
1.9%
Total
$736,610,000
100.0% |
 Growth of Book Value
12
Book Value Plus Cumulative Dividends
$-
$5.00
$10.00
$15.00
$20.00
Book Value
Dividends Paid |
 1
st
Quarter
2013
Financial
Results |
 1
st
Quarter Financial Results
14
1
st
Qtr 2012
1
st
Qtr 2013
•
Total Revenues
$125,348,000
$133,873,000
•
Premiums Earned
$114,692,000
$124,702,000
•
Investment Income
$5,090,000
$4,815,000
•
Net Income
$8,010,000
$6,475,000
•
Statutory Combined Ratio
96.9%
98.0% |
 Balance Sheet Strength
15
December 31,
March 31,
2012
2013
•
Total
Assets
$1,336,889,000
$1,352,033,000
•
Stockholders’
Equity $400,034,000
$404,722,000
•
Book Value per Share
$15.63 $15.72 |
 Technological Capabilities
16 |
 Acquisitions and
Affiliations |
 Regional Focus: Serving 22 States
Through 2,500 Independent Agencies
•
10 M&A transactions
–
Experienced consolidation team
•
Acquisition criteria:
–
Serving attractive geography
–
Favorable regulatory, legislative
and judicial environments
–
Similar personal/commercial
business mix
–
Premium volume
up to $100
million
18 |
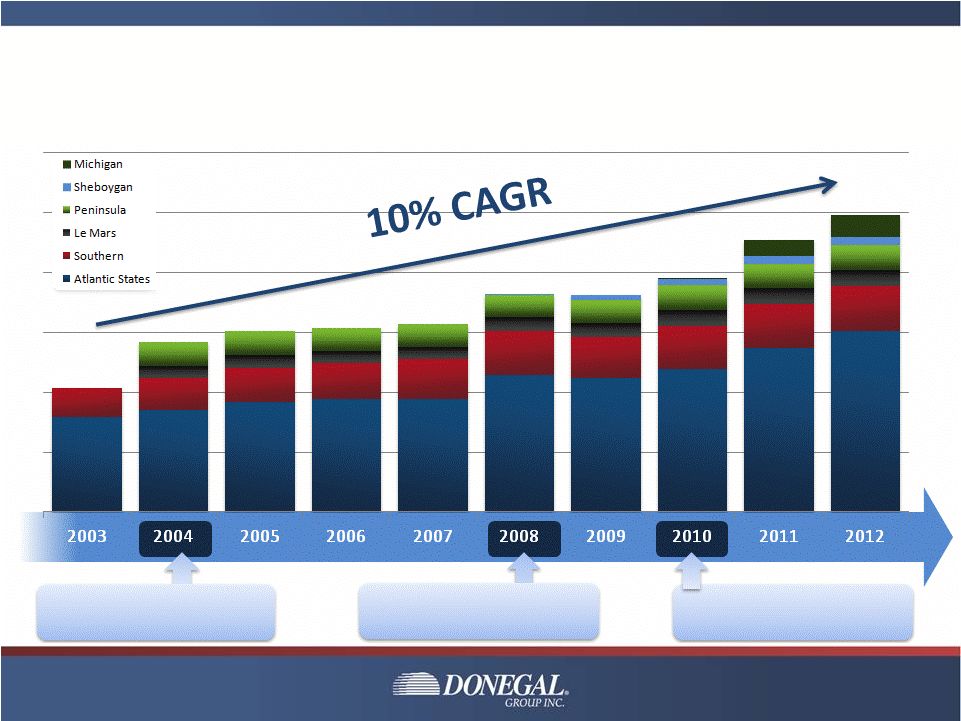 Acquisitions Have Made Meaningful
Contribution to Long-term Growth
19
$283
$302
$207
$307
$314
$365
$363
$392
$454
$496
Net Written Premiums
(dollars in millions)
January 2004
Acquired Le Mars and
Peninsula
December 2008
Acquired Sheboygan Falls
Implemented Pooling Change
December 2010
Acquired Michigan
Implemented 25% Quota Share |
 Union
Community Bank (48% owned by Donegal Group Inc.)
•
Financial results:
–
$509.8
million in assets at year-end 2012
–
$9.8 million in 2012 net income, up from $4.8 million in 2011
–
$2.3 million in net income for first quarter of 2013
•
Excellent capital ratios at March 31, 2013:
20
Tier 1 capital to average total assets
15.34%
Tier 1 capital to risk-weighted assets
22.17%
Risk-based capital to risk-weighted assets
24.25% |
 Recognition
21
Affirmed October 2012
Affirmed October 2012 |
 Annual Meeting
of Stockholders
April 18, 2013 |