Attached files
| file | filename |
|---|---|
| EX-99.2 - EXHIBIT 99.2 - SHENANDOAH TELECOMMUNICATIONS CO/VA/ | ex99_2.htm |
| 8-K - SHENANDOAH TELECOMMUNICATIONS COMPANY 8-K 4-16-2013 - SHENANDOAH TELECOMMUNICATIONS CO/VA/ | form8k.htm |
April 16, 2013 2013 Shareholder Meeting Exhibit 99.1

* Safe Harbor Statement This presentation includes “forward-looking statements” within the meaning of Section 27A of the Securities Act and Section 21E of the Securities Exchange Act of 1934, as amended, regarding, among other things, our business strategy, our prospects and our financial position. These statements can be identified by the use of forward-looking terminology such as “believes,” “estimates,” “expects,” “intends,” “may,” “will,” “should,” “could,” or “anticipates” or the negative or other variation of these similar words, or by discussions of strategy or risks and uncertainties. These statements are based on current expectations of future events. If underlying assumptions prove inaccurate or unknown risks or uncertainties materialize, actual results could vary materially from the Company’s expectations and projections. Important factors that could cause actual results to differ materially from such forward-looking statements include, without limitation, risks related to the following: Increasing competition in the communications industry; and A complex and uncertain regulatory environment. A further list and description of these risks, uncertainties and other factors can be found in the Company’s SEC filings which are available online at www.sec.gov, www.shentel.com or on request from the Company. The Company does not undertake to update any forward-looking statements as a result of new information or future events or developments.

* Use of Non-GAAP Financial Measures Included in this presentation are certain non-GAAP financial measures that are not determined in accordance with US generally accepted accounting principles. These financial performance measures are not indicative of cash provided or used by operating activities and exclude the effects of certain operating, capital and financing costs and may differ from comparable information provided by other companies, and they should not be considered in isolation, as an alternative to, or more meaningful than measures of financial performance determined in accordance with US generally accepted accounting principles. These financial performance measures are commonly used in the industry and are presented because Shentel believes they provide relevant and useful information to investors. Shentel utilizes these financial performance measures to assess its ability to meet future capital expenditure and working capital requirements, to incur indebtedness if necessary, return investment to shareholders and to fund continued growth. Shentel also uses these financial performance measures to evaluate the performance of its businesses and for budget planning purposes.

April 16, 2013 2013 Shareholder Meeting

* Operating Revenues (in millions)

* Net Income (in millions)

* Cash Provided by Operating Activities (in millions)

* Capital Expenditures (in millions) Note: CapEx spending for 2012 includes $24.7 in Accounts Payable at 12/31/2012.

* Sprint Amendment Key Points Allows us to provide 4G LTE service and remain competitive Additional spectrum for more capacity and better coverage Initial 20 year contract extended five years from November 2019 to November 2024
* Sprint-SoftBank

* Cable Segment Focused on long-term results Upgrade of acquired networks Improve quality of service Offer best high-speed internet Improve customer experience Re-launch service with new brand

* Telephone Company Access Line Losses

* Programming Expense Increases ESPN Fox News TNT USA Nickelodeon Disney MTV Discovery AMC HGTV 30% 28% 49% 19% 75% 44% 400% 40% 81% 39% % Increase per Sub 2007 to 2013 Networks

* Revenue vs. Assets vs. Shareholder Equity - 2007 (Year End)
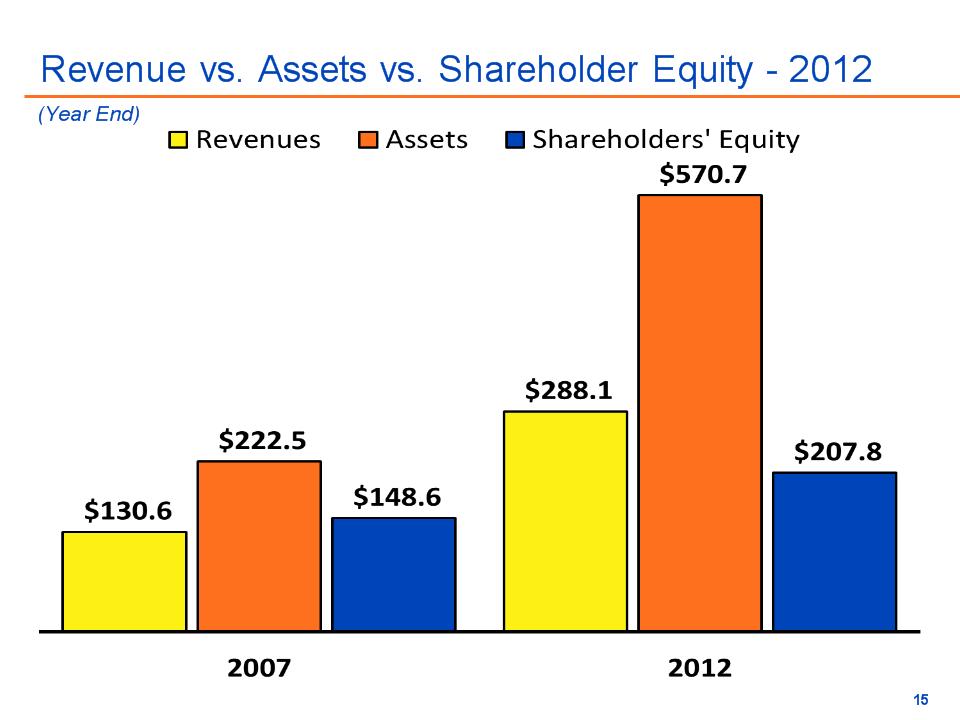
* Revenue vs. Assets vs. Shareholder Equity - 2012 (Year End)
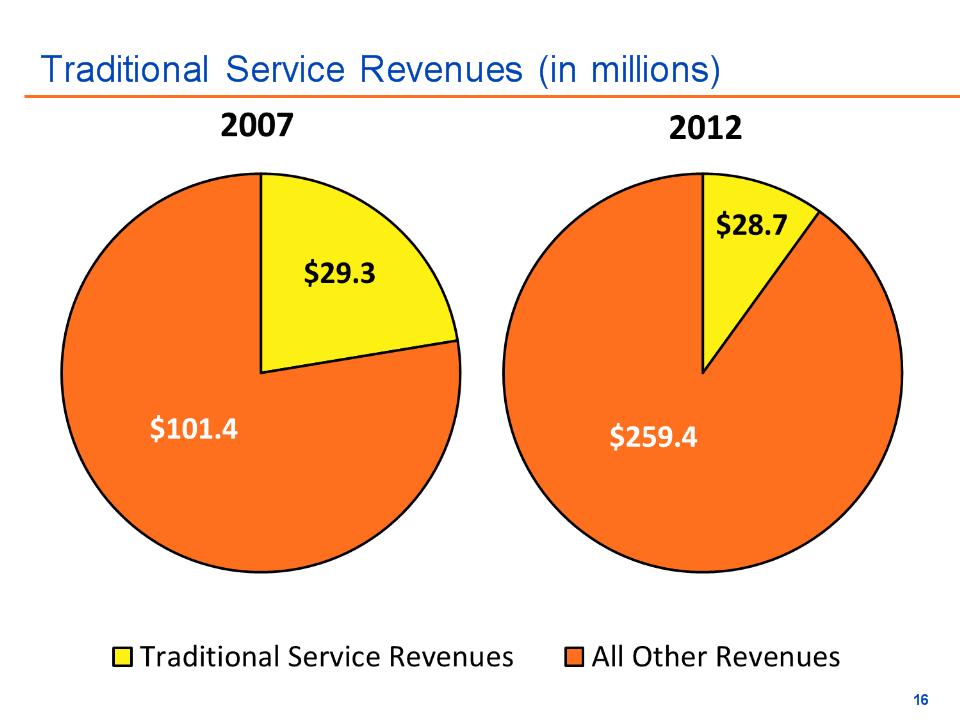
* Traditional Service Revenues (in millions)

* Earle MacKenzie EVP and COO

* PCS Postpaid Subscribers (in thousands) (Year End)
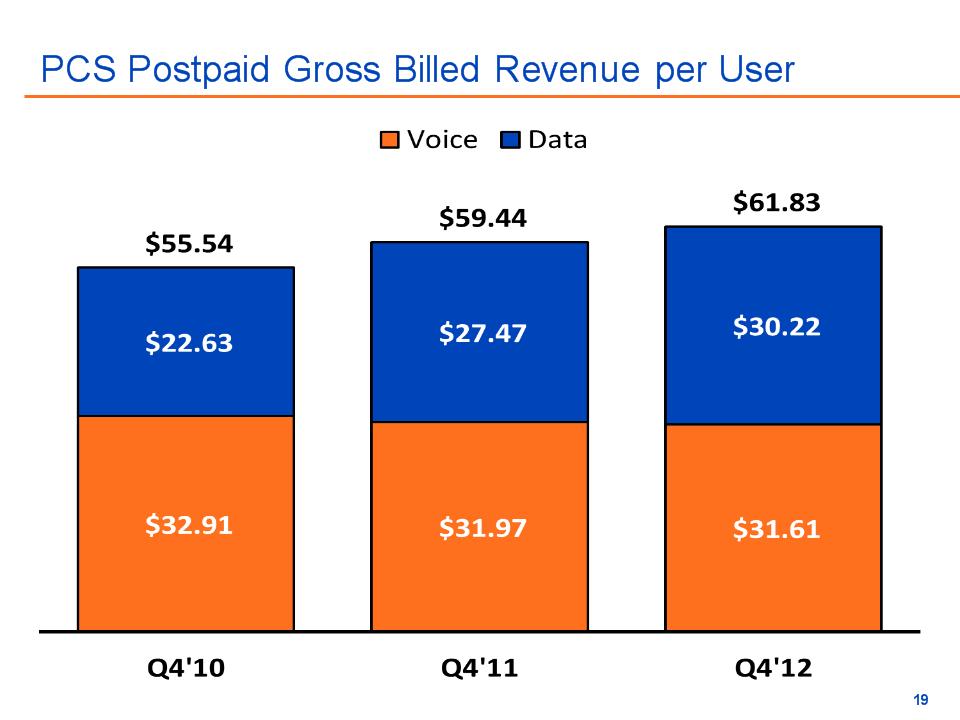
* PCS Postpaid Gross Billed Revenue per User

* PCS Prepaid Subscribers (in thousands) Note: The Company purchased 49.9 subscribers effective 7/1/2010. Net Adds for 2010 are for the 6 months ended 12/31/2010. (Year End)

* PCS Prepaid Gross Billed Revenue per User
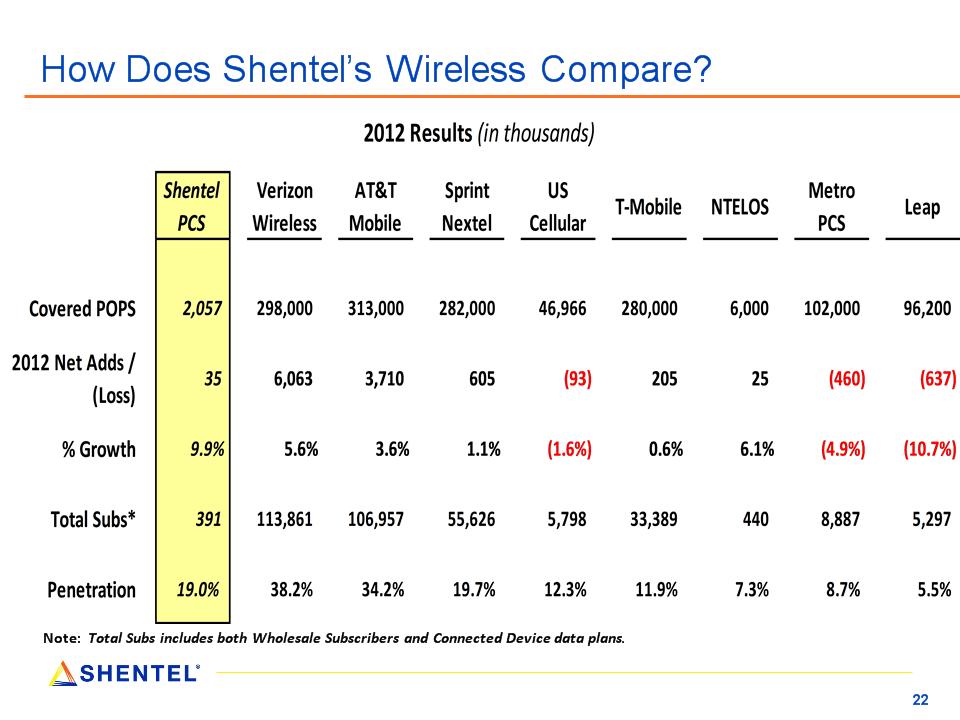
* How Does Shentel’s Wireless Compare? Note: Total Subs includes both Wholesale Subscribers and Connected Device data plans.

* Why Invest in Network Vision? Keeps Shentel’s network aligned with Sprint’s Allows Shentel to remain competitive with Verizon and AT&T Improve customers’ experience Provide 4G LTE service in entire coverage area Provide better in building and overall coverage Gives Shentel potential to leverage investment Converting thousands of iDEN customers to our network

* Network Vision Update Leasing and Zoning Complete 454 out of 520 sites Sites on Air 296 out of 520 sites Sites with 4G LTE Launched 247 out of 520 sites 4G LTE Service Available to 70 % of Covered Pops Note: All Network Vision Update figures are as of April 8, 2013.


VIDEO #1

VIDEO #2


* Cable Revenue Generating Units (in thousands) (Year End)

* Cable Average Monthly Revenue per Customer
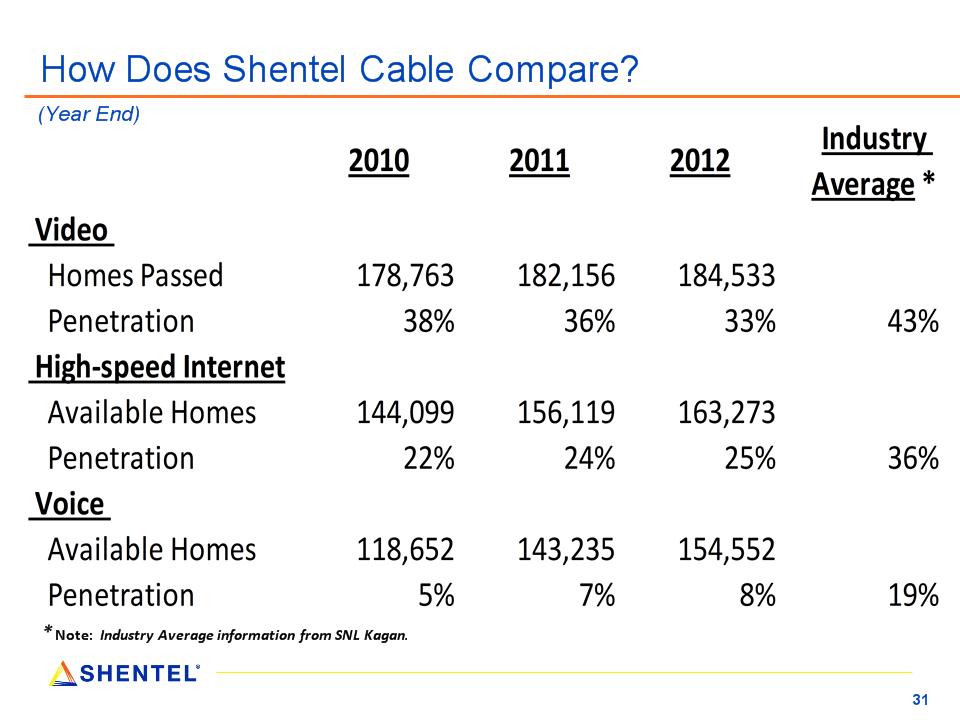
* How Does Shentel Cable Compare? * Note: Industry Average information from SNL Kagan. (Year End)

* Wireline Customers (in thousands) (Year End)

* New Fiber Lease Contracts Signed (in millions)
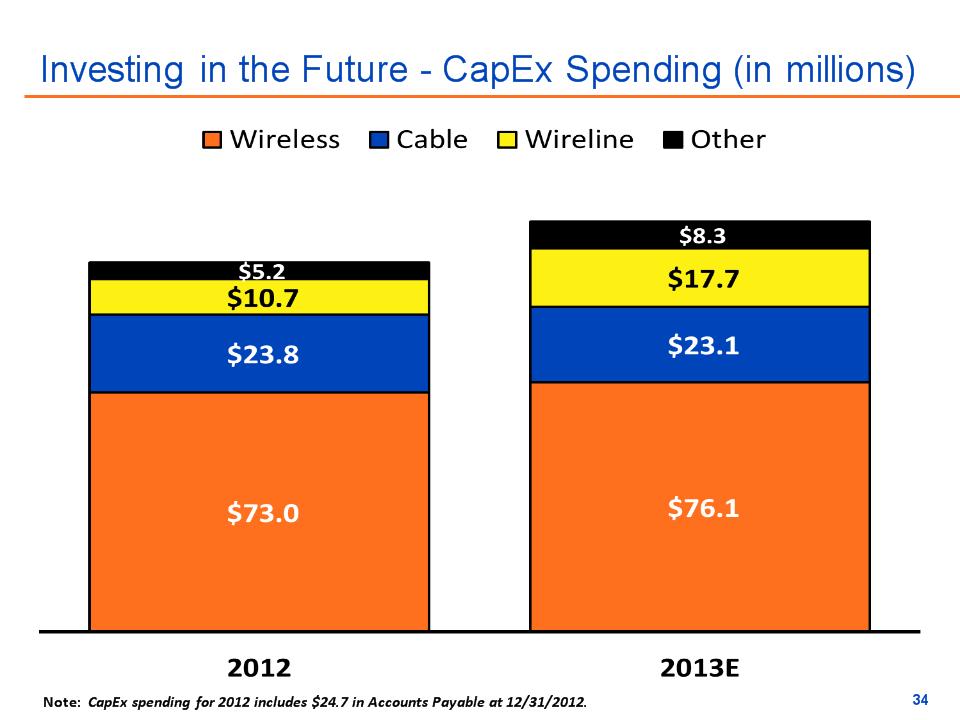
* Investing in the Future – CapEx Spending (in millions) Note: CapEx spending for 2012 includes $24.7 in Accounts Payable at 12/31/2012.

* Adele Skolits VP of Finance and CFO

* Consolidated Operating Revenues (in millions)

* Mix of Operating Revenues (in millions)

* Change in Mix of Revenues

* Operating Expenses (in millions)

* Mix of Operating Expenses (in millions) Note: 2012 Cost of Goods and Services includes $11.0 in Goodwill Impairment charges.

* Debt Maturities (in millions)

* Adjusted OIBDA ($ in millions)

* Cash Dividends per Share Note: For 2003 – 2006, per share data reflects 3 for 1 stock split effective August 2007.

April 16, 2013 2013 Shareholder Meeting