Attached files
| file | filename |
|---|---|
| EX-99.2 - EX-99.2 - CALPINE CORP | d517809dex992.htm |
| 8-K - FORM 8-K - CALPINE CORP | d517809d8k.htm |
 2013
Investor Day April 10, 2013
Exhibit 99.1 |
 2
2
Forward-Looking Statements
The information contained in this presentation includes certain estimates, projections
and other forward-looking information that reflect Calpine’s current
views with respect to future events and financial performance. These estimates,
projections and other forward-looking information are based on assumptions that Calpine believes, as of
the date hereof, are reasonable. Inevitably, there will be differences between such
estimates and actual results, and those differences may be material.
There can be no assurance that any estimates, projections or forward-looking
information will be realized. All such estimates, projections and
forward-looking information speak only as of the date hereof. Calpine undertakes
no duty to update or revise the information contained herein other than as required by
law. You are cautioned not to place undue reliance on the estimates, projections
and other forward-looking information in this presentation as they are based
on current expectations and general assumptions and are subject to various risks,
uncertainties and other factors, including those set forth in Calpine’s Annual
Report on Form 10-K for the year ended December 31, 2012, and in other
documents that Calpine files with the SEC. Many of these risks, uncertainties and
other factors are beyond Calpine’s control and may cause actual results to differ
materially from the views, beliefs
and estimates expressed herein. Calpine’s reports and other information filed with
the SEC, including the risk factors identified in its Annual Report on Form
10-K for the year ended December 31, 2012, can be found on the SEC’s website
at www.sec.gov and on Calpine’s website at www.calpine.com.
Reconciliation to U.S. GAAP Financial Information
The following presentation includes certain “non-GAAP financial
measures” as defined in Regulation G under the
Securities Exchange Act of 1934, as amended. Schedules are included herein that
reconcile the non-GAAP financial measures included in the following
presentation to the most directly comparable financial measures calculated and
presented in accordance with U.S. GAAP.
Safe Harbor Statement |
 3
Agenda
3
•
Welcome and Safe Harbor
Bryan Kimzey
VP, Investor Relations
•
Value Proposition
Jack Fusco
Chief Executive Officer
•
Operations & Development Overview
Thad Hill
President, Chief Operating Officer
•
Introductory Q&A
Jack Fusco
Thad Hill
Chief Executive Officer
President, Chief Operating Officer
•
Commercial Operations: National Trends
Caleb Stephenson
VP, Commercial Analytics
•
Commercial Operations: Regional Trends
Steve Pruett
SVP, Commercial Operations
•
Commercial Operations Q&A
Steve Pruett
Caleb Stephenson
Todd Thornton
SVP, Commercial Operations
VP, Commercial Analytics
VP, Commercial Development
Break
•
Power Operations Panel
John Adams
Ron Macklin
Tom Long
Ron Hall
SVP, Power Operations
VP, Outage Services
VP, Development & Optimization Engineering
VP, Engineering & Construction
•
Regulatory Panel
Thad Miller
Yvonne McIntyre
Steve Schleimer
Mark Smith
William Taylor
EVP, Chief Legal Officer
VP, Governmental & Regulatory Affairs (Federal)
VP, Governmental & Regulatory Affairs (North)
VP, Governmental & Regulatory Affairs, Legal (West)
VP, Governmental & Regulatory Affairs (Texas)
•
Financial Overview
Zamir Rauf
EVP, Chief Financial Officer
•
Executive Q&A |
 2013
Investor Day: Value Proposition
Jack Fusco
Chief Executive Officer
April 10, 2013 |
 5
Thank You:
A Milestone Achievement
5
Jack Fusco
Voted Best IR by a CEO
or Chairman (Mid-Cap)
Calpine IR
Nominee for Best IR –
Utilities Sector
Jack Fusco
Voted Best CEO –
Elec. Utilities
Buy-
and Sell-Side
Calpine IR
Top 3 for Best IR –
Elec. Utilities
Buy-
and Sell-Side
2013
All-America
Executive
Team
Thank you
for recognizing
our commitment to
our shareholders
and to
providing the investing
community with
disclosures and access |
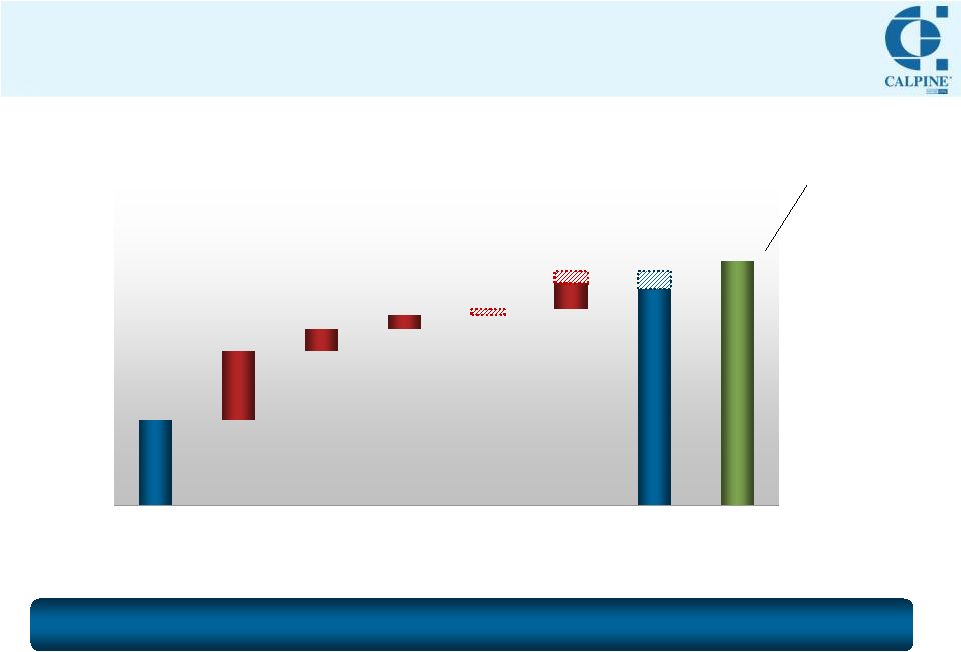
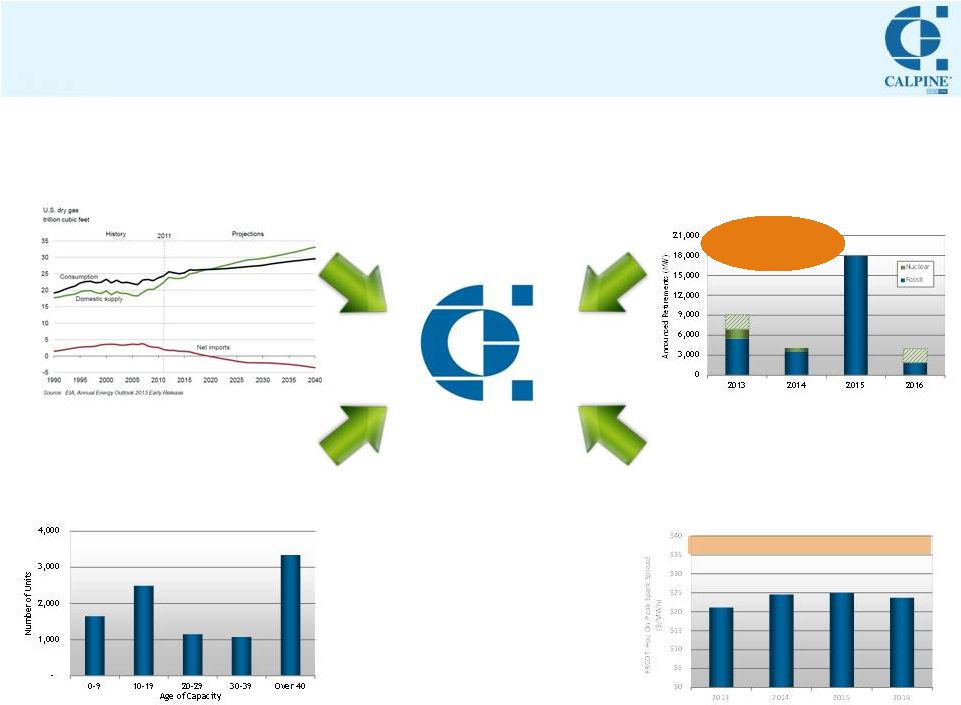 Calpine: Positioned to Benefit from Secular Trends
6
Stricter Environmental
Regulation
•
State and federal pressures: Primarily
focused on health concerns; resurgent
climate change debate
Insufficient New Capacity
in Key Markets
Sustained Low
Natural Gas Prices
Aging Power Generation
Infrastructure
•
Prices must rise to incent economic new
investment where needed
•
“New norm”: 100+ years supply of affordable,
domestic natural gas
•
America’s fleet continues to age; investments in
improvements / maintenance less economic
~240,000 MW
Source: Energy Velocity. Excludes renewable and hydro units.
Source: SNL. Shaded nuclear represent potential
retirements, including plants currently not in operation.
Est. CCGT new build requirement
Source: Calpine, Broker quotes. As of 3/26/13.
32 GW of
retirements
announced
through 2016 |
 7
Myths Around Over-Reliance on Natural Gas
in the Power Sector
7
•
There is abundant excess
capacity in the current fleet,
and sufficient time exists to
develop new resources.
•
The level of mid-stream
investment is dramatic
and growing.
•
Even with natural
gas gaining share,
the US will be
multi-fuel for a
long, long time.
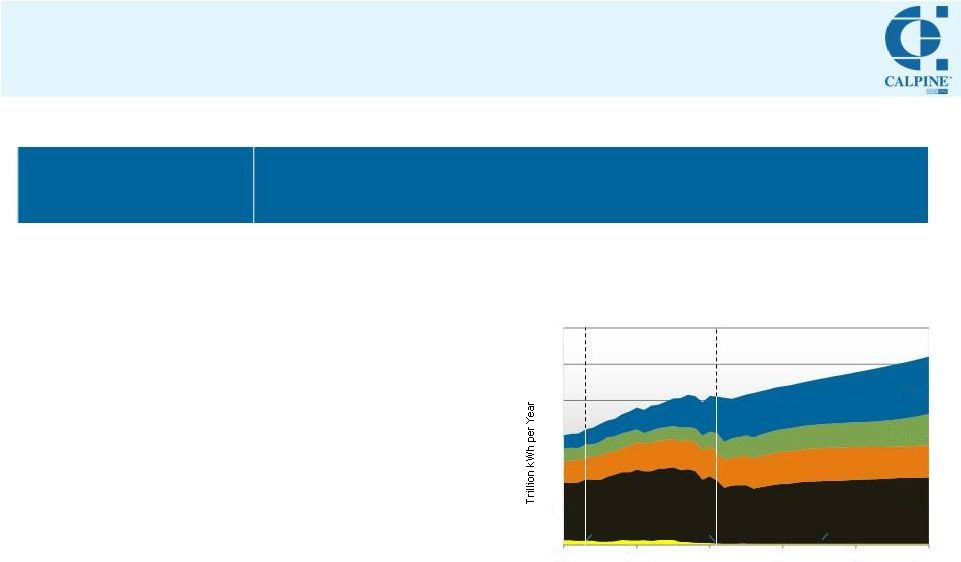
Source: U.S. Energy Information Association, December 2012.
Coal
Nuclear
Renewables
Natural gas
2
3
4
5
6
1990
2000
2010
2020
2030
2040
0
1
1993
2011
History
Projections
30%
16%
17%
35%
1%
13%
11%
19%
53%
4%
25%
13%
19%
42%
1%
Oil and other liquids
US Electricity Generation: Multi-Fuel
•
America’s natural gas
fleet cannot meet
reliability needs.
•
Pipeline infrastructure
cannot support new
natural gas demand.
•
The US will become
over-dependent on
natural gas.
Myth
Truth |
 8
Coal
Electric
Vehicles
Calpine: Strong Generator of Cash, Disciplined in Deployment
8
($ millions)
We will be discerning and disciplined in
our capital allocation decisions.
Rooftop
Solar
1
Represents Cash and Cash Equivalents as of 12/31/12, less estimated cash needed to
maintain minimum liquidity of $1 billion. 2
A non-GAAP financial measure. Reconciliations of Adjusted EBITDA and Adjusted
Free Cash Flow to Net Income (Loss), the most comparable U.S. GAAP measure, are included herein.
Announced Capital Management
Further Capital Management:
•
Organic growth
•
Acquisition and divestiture opportunities
•
Additional share repurchases
$1,040
$865 -
$1,025
$615 -
$775
$(140)
$(250)
$(400)
Excess Cash:
Dec 2012
1
Adj. FCF
2
Scheduled Debt
Amortizations
Growth
CapEx
(Net)
Share
Repurchases
Excess Cash:
Dec 2013E |
 9
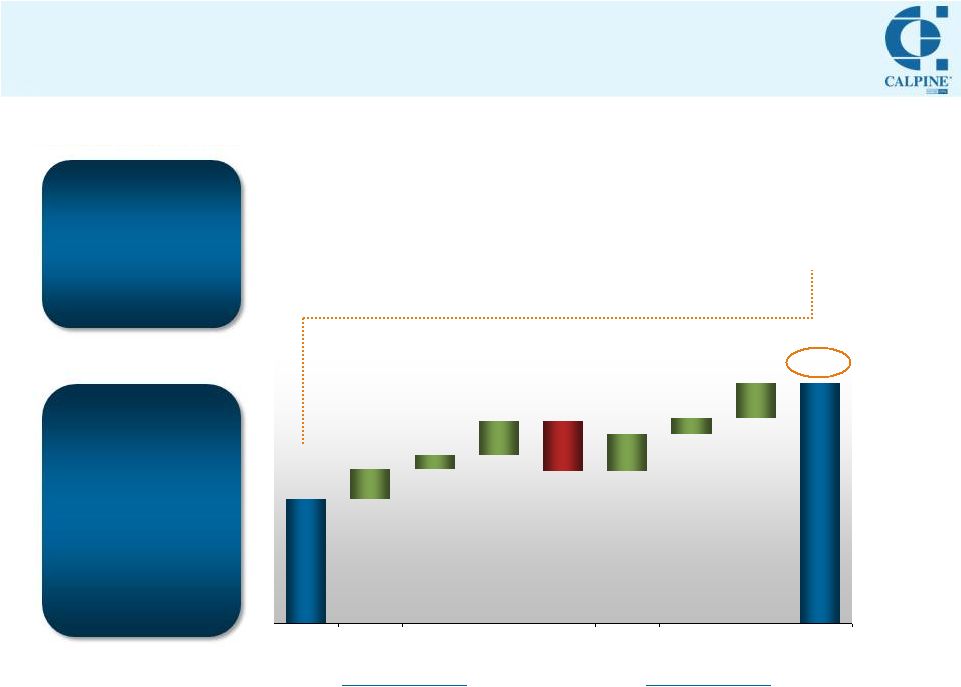
Delivering Shareholder Value
9
Demonstrating Strong Financial Performance
Adjusted EBITDA
¹
Returning Capital to Shareholders
Announced Share Repurchase Authorizations
Raising Guidance:
$1,800 -
$1,960
Enhancing Value Per Share
Adjusted Free Cash Flow Per Share
¹
Modest
gains
in
Adj.
EBITDA
¹
translate into
meaningful
gains
in
Adj.
FCF
1
/Share
+$300
+$400
1
A non-GAAP financial measure. Reconciliations of Adjusted EBITDA and Adjusted
Free Cash Flow to Net Income (Loss), the most comparable U.S. GAAP measure, are included herein.
2
As of 04/05/13.
Update: Invested
$58MM year-to-date
²
Targeting 15 –
20% CAGR |
 10
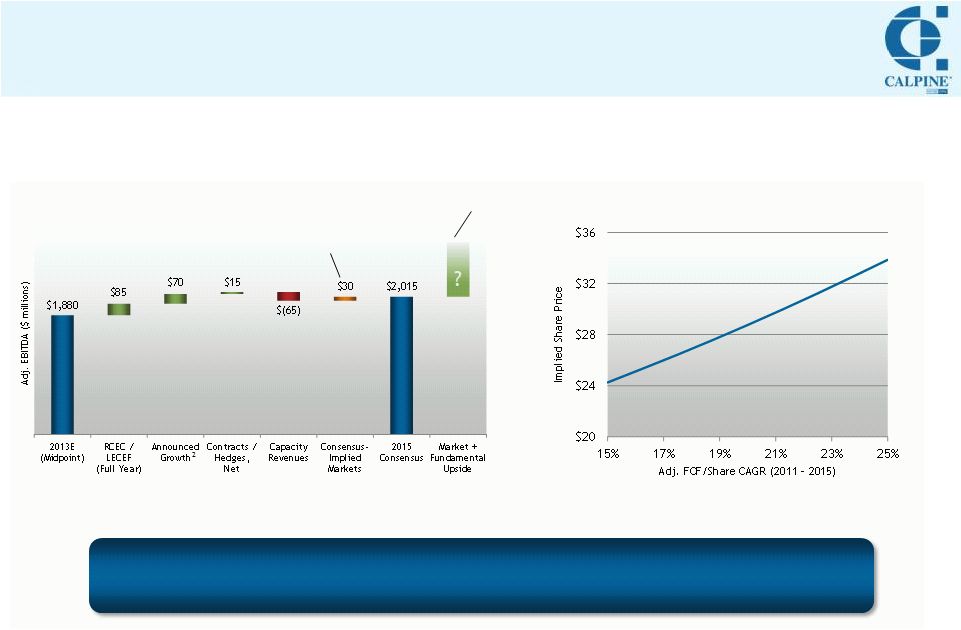
Significant Valuation Upside Remains
10
2015 Consensus Adj. EBITDA¹: Conservative
Adj. FCF / Share¹
Growth Represents
Total Shareholder Return
1
A non-GAAP financial measure. Reconciliations of Adjusted EBITDA and Adjusted
Free Cash Flow to Net Income (Loss), the most comparable U.S. GAAP measure, are included herein.
2
Represents estimated 2015 Adj. EBITDA from Deer Park and Channel expansions (scheduled
to come online in 2014) and Garrison (scheduled to come online mid-2015).
Below current
forwards
Not in consensus
Note: Chart holds Price to Adj. FCF/Share Multiple constant at 13.7,
consistent with current trading levels based upon 2013E Adj. FCF/Share.
Adj. EBITDA¹
outlook and opportunistic capital allocation
drive meaningful valuation upside potential |
 2013
Investor Day: Operations and Development
Overview
Thad Hill
President, Chief Operating Officer
April 10, 2013 |
 12
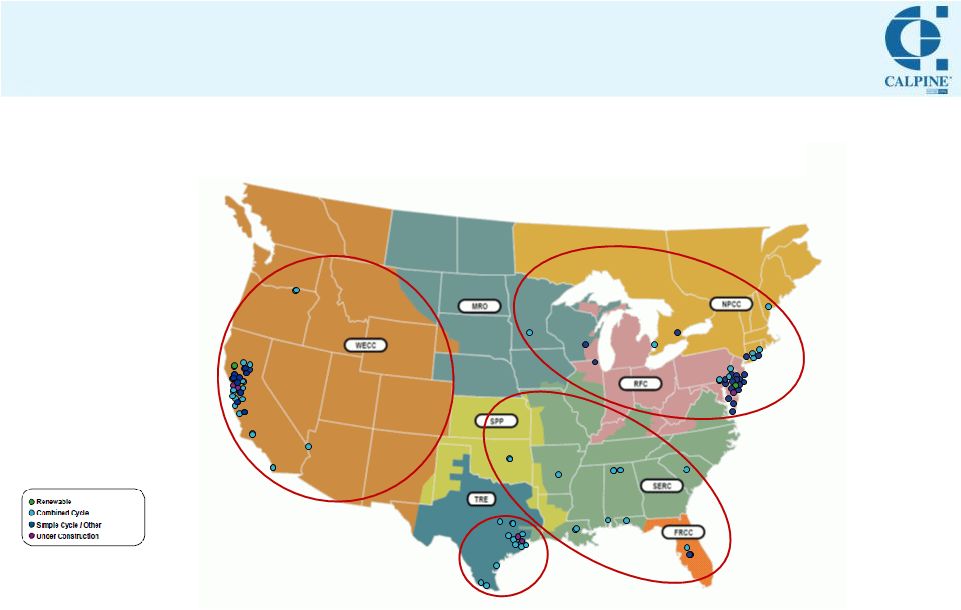
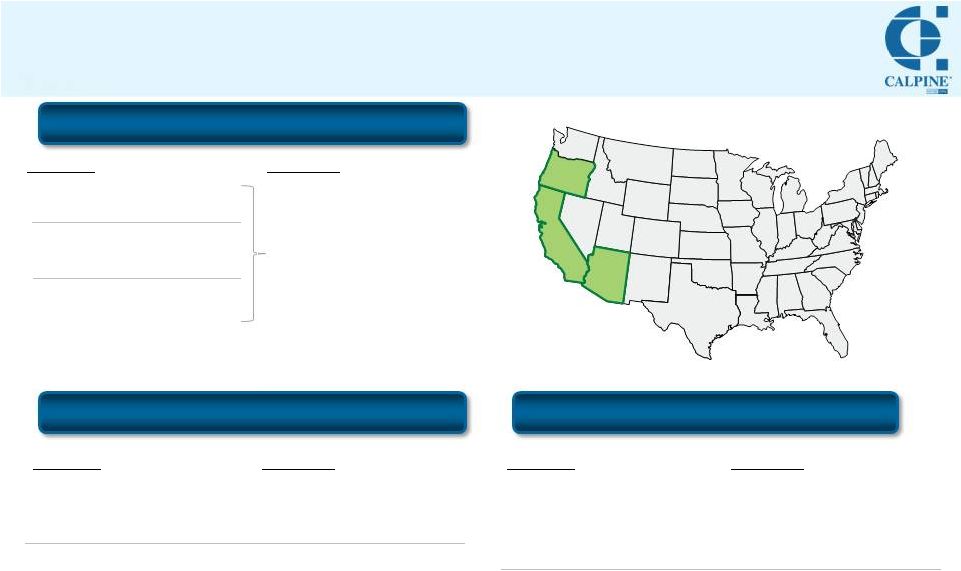
Shaping Our Footprint to Match our Regional Strategy
Note: Capacity shown here represents Calpine’s net interest.
12
West
Asset management and
regulatory engagement
Texas
Capitalize on demand-
driven market recovery
North
Capitalize on
supply-driven
market recovery
and organic growth
opportunities
Southeast
Monetize value
through long-term
contracts or asset
divestitures
Calpine: 27,321 MW + 1,472 MW Under Construction
April 2013 |
 13
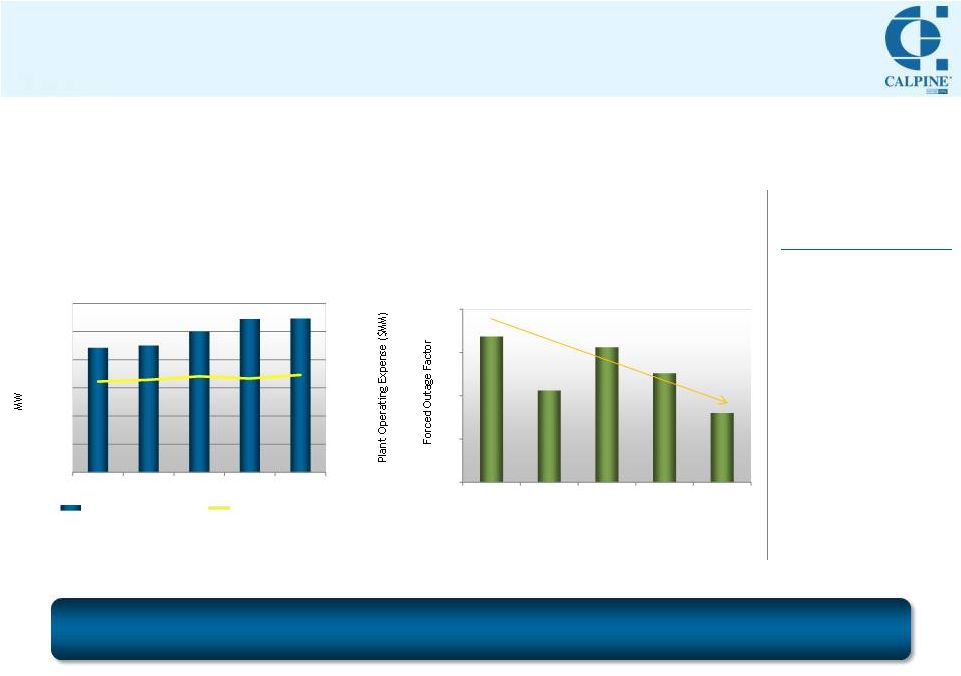
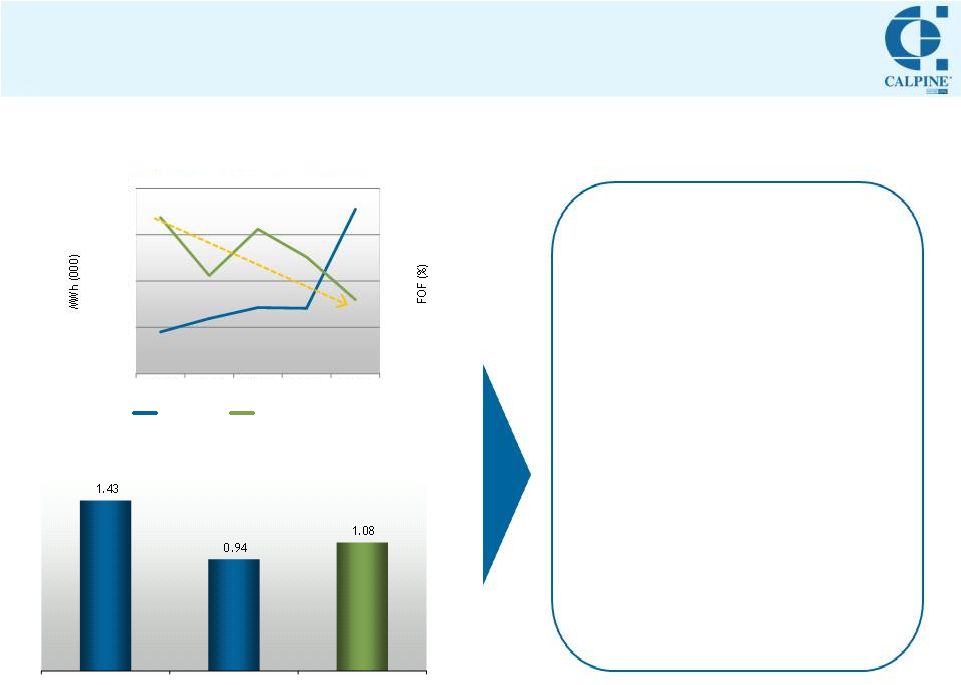
Optimizing Fleet Performance
13
Significantly Reduced
Forced Outage Factor
-53%
Goals for 2013
•
Safety First to
Zero: No lost
time incidents
•
Better than 2.5%
FOF
•
Complete
maintenance
program:
13 Majors and
20 Hot Gas Paths
Maintaining Plant Operating Expense
While Expanding Fleet
1
Objective: Premier wholesale power company
1 Plant Operating Expense excluding major maintenance expense, non-cash
stock-based compensation, non-cash loss on disposal of assets and other costs. Both Plant Operating Expense and
Capacity (MW) shown here exclude deconsolidated power plants, plants owned but not
operated by us and plants classified as discontinued operations in the respective periods.
1
$0
$200
$400
$600
$800
$1,000
$1,200
0
5,000
10,000
15,000
20,000
25,000
30,000
2008
2009
2010
2011
2012
Avg. MW in Operation
0%
1%
2%
3%
4%
2008
2009
2010
2011
2012
Plant Operating Expense |
 14
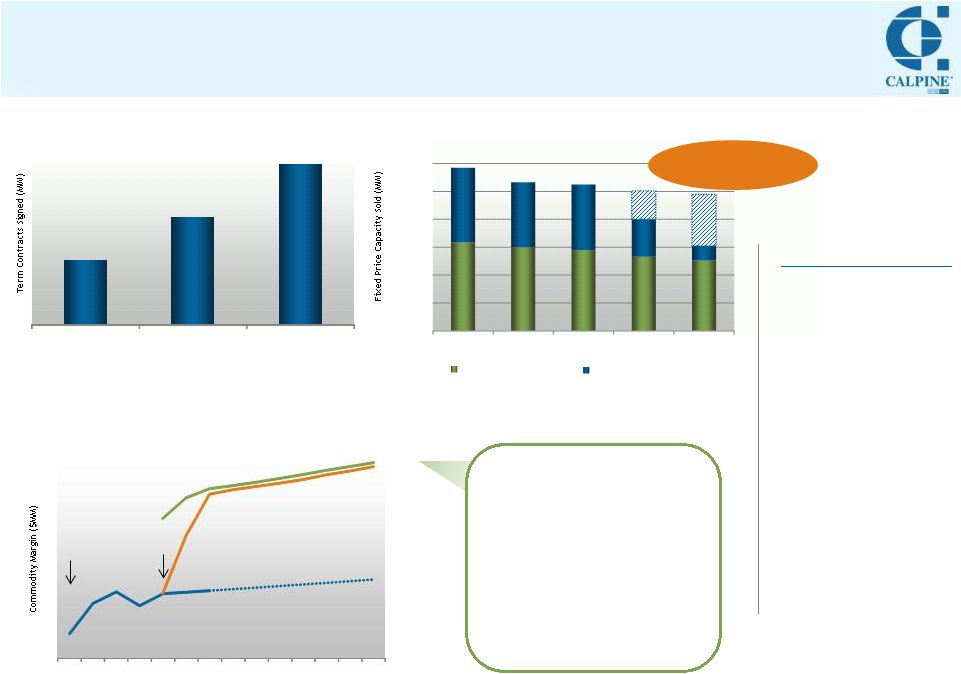
Adding Value Through Commercial Origination
14
Continued Contracting Success
•
Focus on
demonstrating
further value from
SE portfolio
•
Create
commercial
solutions to bridge
CA structural gaps
•
Continue to
expand public
power origination
efforts (TX, North)
•
Commercially
optimize portfolio
Contracts: Effective Form
of Asset Monetization
Illustrative Contract Economics
Mgmt.
dialogue
initiated
Contract
commenced
Capturing Future Value
Represents >$5B
(notional) of fixed
payments
Goals for 2013
Note: Market projection represents extrapolation of current market prices.
Shaded bars represent projected capacity lifted in 2016/2017 and
2017/2018 RPM capacity auctions based upon amounts cleared in
2015/2016 auction. Toll/PPA capacity includes contracts at Los
Medanos and Gilroy, which are subject to CPUC approval.
Why do customers pay?
•
Avoided cost of new build
•
Capacity obligations
beyond energy
•
Regulatory requirements
•
Sometimes regulators or
customers want some
portion of PPAs
Market /
Projection
T-4
T-2
T
T+2
T+4
T+6
T+8
Fundamentals
Contract
2013
2017
Toll / PPA Capacity
Regulatory Capacity
0
2,500
5,000
7,500
10,000
12,500
15,000
2014
2015
2016
840
1,402
2,095
2010
2011
2012 |
 15
Calpine Development Pipeline:
Pursuing Disciplined Growth
2013
2014
2015
2016
2017
Russell City
Combined-cycle power plant under
10-year contract with PG&E
464 MW
1
Los Esteros
Conversion of existing plant from simple-
cycle to combined-cycle technology
under 10-year contract with PG&E
120 MW
Deer Park Expansion
Expansion of existing CCGT in Texas
leveraging existing site and equipment
260 MW
2
Channel Expansion
Expansion of existing CCGT in Texas
leveraging existing site and equipment
260 MW
2
Garrison (Phase 1)
Greenfield CCGT leveraging existing
equipment and advantaged site
309 MW
Deepwater
Brownfield CCGT leveraging existing
infrastructure and advantaged site
350 MW
Texas Upgrade Program
Turbine modernizations and other
upgrades; Requires market reform
300 MW
Mankato Expansion
Response to PUC resource acquisition
plan; Expansion of existing CCGT
leveraging existing site and equipment
345 MW
Total
584 MW
520 MW
309 MW
650 MW
345 MW
Goals for 2013
•
Complete CA
construction
projects
•
Keep Deer Park,
Channel,
Garrison on track
•
Originate
attractive-return
growth
opportunities
—
New cogen
—
Public power
•
Build set of site
options with first
mover advantage
1
Represents Calpine share.
2
Represents
incremental
baseload
capacity
at
annual
average
conditions.
Incremental
summer
peaking
capacity
is
approximately
200
MW
per
unit,
supplemented
by
incremental
efficiencies
across the balance of the plant.
NEW
NEW
NEW |
 16
Operations Organization
16
COO
Power
Operations
Commercial
Analytics
Commercial
Operations
Human
Resources
West Strat.
Origination
Development
Hether
Benjamin-Brown
Todd Thornton
Steve Pruett
John Adams
Caleb Stephenson
Alex Makler
Presenter
Panelist
In Attendance
Thad Hill |
 2013
Investor Day: National Trends
Impacting Our Portfolio
Caleb Stephenson
Vice President, Commercial Analytics
April 10, 2013 |
 18
18
Important Trends Impacting Our Portfolio
National
Caleb Stephenson
Regional
Steve Pruett
Texas
•
Inefficiency of forward
curves, plus
•
Regulatory shifts
(including our new VMP)
PJM
•
Retiring coal + Demand
Response = Flattish
capacity, but
•
Real upside in energy
Southeast
•
Capturing significant
origination opportunity
with load serving entities
California
•
Near-term: SONGS +
AB32
•
Medium-term:
Increasing importance of
capacity versus energy
Load Trends
•
Cheer up! Energy efficiency not the
end of load growth
•
Regional diversity: Texas load
growth outlook remains robust
The
“New Build”
Spark
Spread
•
Spark spreads needed to motivate
new construction likely higher than
some think
•
Operational realities matter
Gas Price
Immunity
•
Generation volumes inversely
related to gas prices; margin fairly
neutral
Energy
Capacity
Views of Value |
 Energy
Efficiency
Isn’t
New;
Additional
Efficiency
Improvements
Needed
Just
to
Keep
Pace
with
Historical
Trend
19
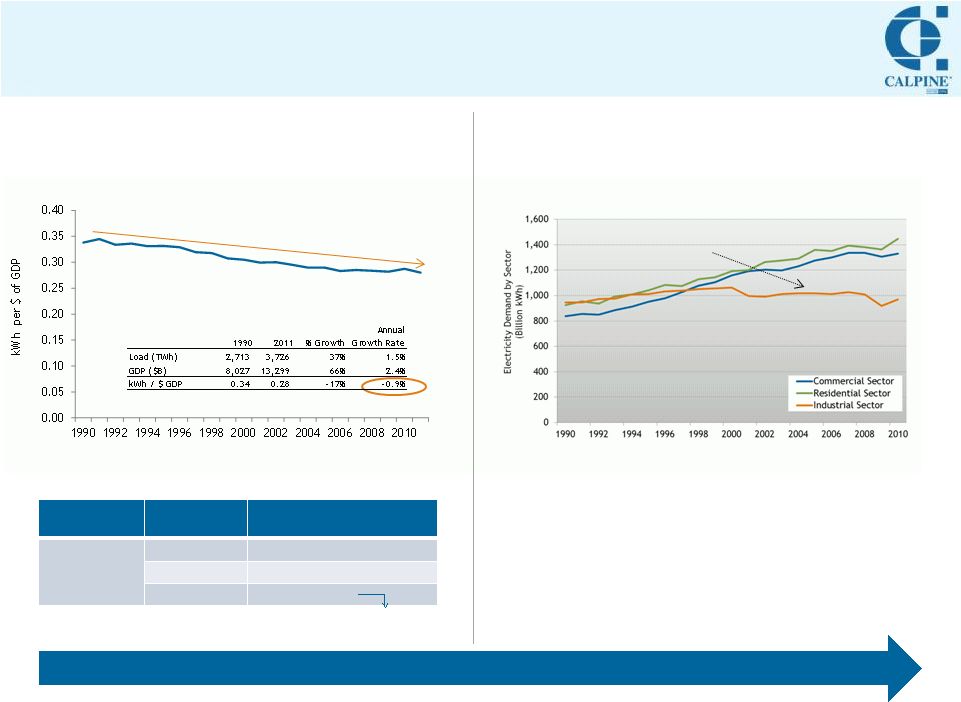
Long History of Energy Efficiency
GDP Growth > Load Growth = More Efficient Electricity Use
More Efficiency Needed Just to Maintain Trend
Beating Past Efficiency Trend May Not be Easy
Significant portion of past efficiency gains driven by structural
shift away from industrial load... Will this continue?
Flattening load growth entirely would require efficiency gains equivalent to GDP
growth –
>2.5x
historical efficiency gains
Residential Load has Tended to be Resilient
Efficiency improvements often offset by new demand;
Challenged so far by slow recovery of housing starts
•
Average new home size up >10% from 1990s
•
More and larger appliances
•
Light bulb standards aside, some low-hanging fruit already captured
Electricity needed to produce $1 of GDP has decreased
by ~1% per year
Sustaining GDP
Growth of …
…
and Load
Growth of …
…
Requires an Ongoing
Efficiency Gain of …
2.4%
1.5%
0.9% (consistent with history)
1.0%
1.4% (>1.5x history)
0%
2.4% (>2.5x history)
We’re not convinced load growth has reached a regime change: Much still
seems driven by regional economies … Industrial load now a smaller share of
electricity consumption (and economy)
Sources: Retail sales total and by sector from EIA , GDP Data from BEA ($ 2005), Calpine
Analysis |
 20
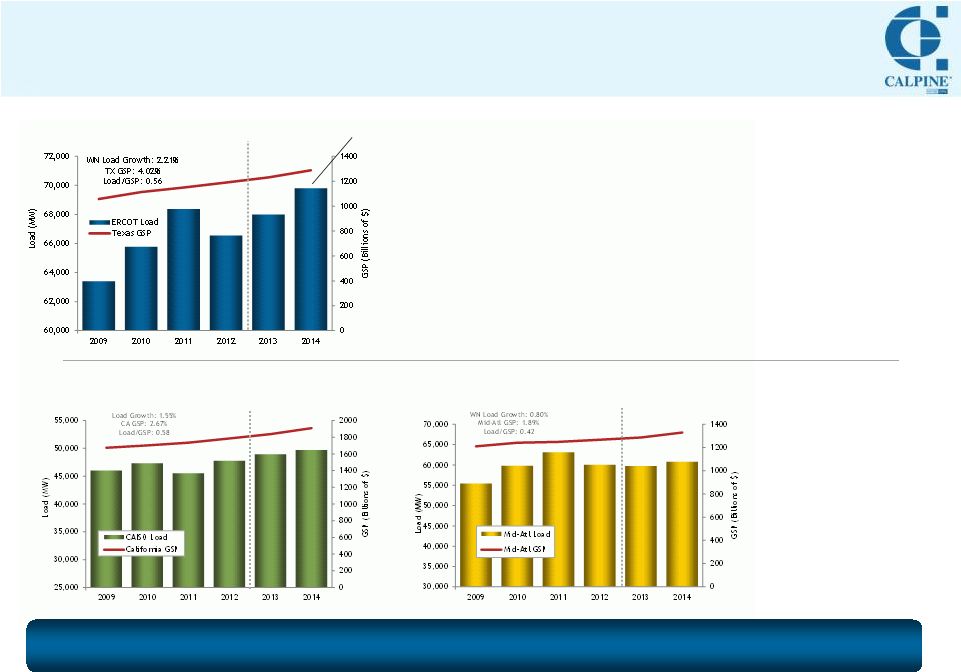
Regionally Diverse Growth Trends:
Texas Among Highest Growth Regions
20
Forecast
Forecast
Forecast
Notes:
Historical
peak
load
data
is
not
weather
normalized
(WN).
All
growth
rates
are
compound
annual
growth
between
2009
–
2014.
Sources: Historical data from ERCOT, CAISO, & PJM (unrestricted peak load) .
Load Forecasts from ERCOT, CEC, & PJM. GSP data from Moody's Analytics ($ 2005). Mid-Atlantic GSP is sum of PA, NJ, DE, &
MD. Weather-normalized load growth rates reflect Calpine analysis.
Texas
California
Mid-Atlantic
Rather than having fundamentally changed, regional load growth trends appear to remain
primarily a function of regional economic strength
Population, industry and commercial trends positive for
continued strong load growth
•Feb
2013: In past year, employment increase in TX more than 2x gain
in national payroll growth (Bloomberg) •Greater Houston Port Bureau survey: Businesses in Houston Port
region will invest $35 billion in capital and maintenance between 2012
–
2015 (Houston Chronicle)
Economic and load growth
expectations in California
and Mid-Atlantic are less
robust
ERCOT forecasts annual
load growth of ~2,000 MW
through 2016 |
 21
Factors
Sometimes
Overlooked
Factors
Typically
Considered
Conventional Underestimation of New Build Spark Requirements
21
•
Headline construction costs per headline kW
•
Cost of capital
•
Fixed operating costs
•
Total
construction
costs
per
operable
kW
•
Cost
and
return
of
capital
•
Fixed,
variable,
and
maintenance
reserve
operating
costs
•
Operational realities such as:
—
Off peak and weekend operations
—
Imperfect plant availability
—
Higher fuel costs due to realized versus baseload heat rates, use of duct-fired
capacity not just baseload capacity, and local gas delivery costs
Spark spread required to incent merchant new build is an important
benchmark for evaluating power market upside, particularly in regions without
capacity markets. People often underestimate this benchmark, thereby not
appreciating full fundamental potential of existing assets.
Issue:
Typical approach
is to calculate annual revenue requirements and divide by the
number of on-peak hours during the year to determine the spark spread level
necessary to cover revenue requirements.
A more
careful
approach
recognizes
the
costs
of
operational
“frictions”
and
generally
results in higher new build benchmark. |
 22
$29
$2
$1
$3
$(4)
$3
$1
$3
$38
Simple
Estimate
Interest During
Construction
Seasonal
Capacity
(less than
Nameplate)
Return of
Capital
Off Pk and
Wknd Margins
Plant
Availability
less than 100%
Add'l Realized
Fuel Costs
Variable Costs
and
Maintenance
Reserve
Improved
Estimate
Impact of
Refinements to
the Math
Operational Frictions Drive Higher Required Spark Spread
22
Illustrative ERCOT Estimate
Operational Realities
Starting Point:
Illustrative Simple
Math
Construction
Costs
Return on
Capital
Fixed
O&M
Total Margin
Needed
On-Peak
Hours
Simple New
Build Spark
$893/kW
10%
$30/kW-Yr
$119/kW-Yr
4,100
$29/MWh
÷
=
=
x
+
Sources: EIA , Calpine Analysis |
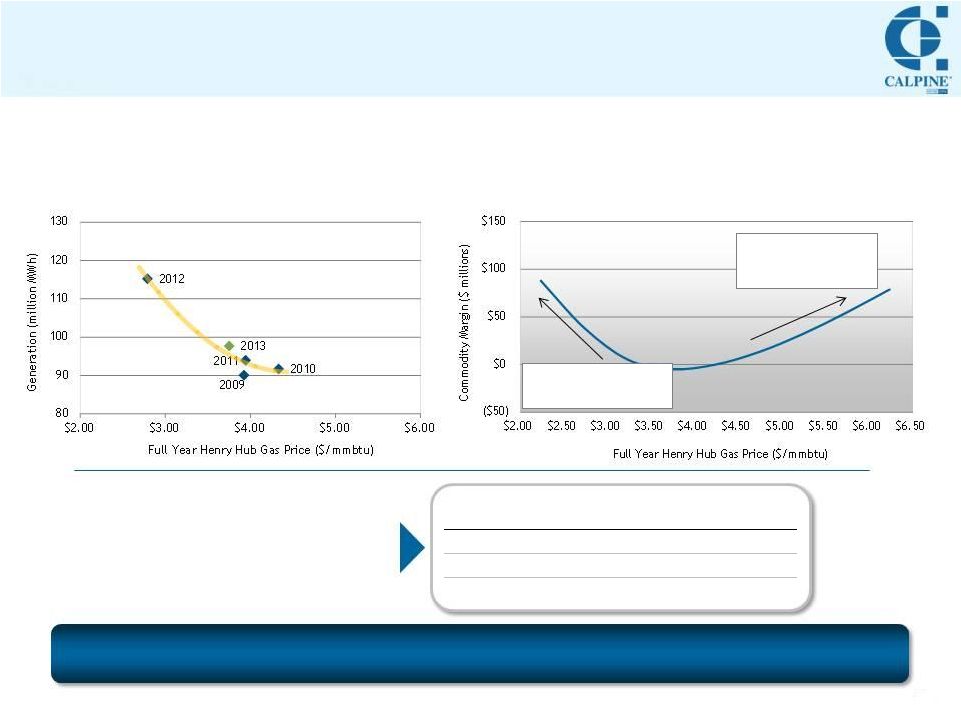 Calpine: Generation Volumes Inversely Related to Gas Prices;
Margin Fairly Neutral
NON-EQUITY Volume
Projection (MM MWh)
Recommended Premium to
On-Peak Spark Spread
<100
5% -
15%
100 –
110
(5)% -
5%
110 –
120…
(15)% -
(5)%
Realized margin per
MWh (relative to on-peak
spark spreads) varies
with total volume
1
Historical volumes adjusted to reflect only those plants currently owned by us.
All periods exclude deconsolidated plants. 2013E as of 03/26/13. 2
Relates to our summary level modeling tips. Refer to slide 35 for complete tips
and further detail. Calpine Margin Not Particularly Sensitive
to Natural Gas Prices
Modeled Impacts of Changes in Gas Price
on Unhedged Portfolio
As gas prices decline, volumes
increase as gas units take
market share from coal units
As gas prices rise, margin
increases as fuel cost
advantage over less
efficient generators widens
Calpine Dispatch
Sensitive to Natural Gas Prices
Volumes¹
vs. Natural Gas Price Trend
Though volumes can move substantially with changes in gas prices,
unhedged
Commodity
Margin
is
relatively
immune
to
changes
in
gas
prices.
Modeling Tip
Application²:
23 |
 24
24
APPENDIX |
 25
Further
Detail
on
Illustrative
“New
Build
Spark
Spread”
Estimates
25
Sources: EIA for illustrative ERCOT construction cost per kW, Calpine analysis.
In reality, the “new build spark”
varies for each particular project.
Construction costs, project risks, and operating expectations all need to be
factored in.
/+ $100 per kW Construction Cost
/+ 1% Capital Return Rate
/+ $10 Fixed O&M Costs
/+ 100 btu/KWh Heat Rate Chg
1% Availability
/+ $1 Variable or Maintenance Costs
Change in Required On Peak Spark Spread ($/MWh)
$(3.00)
$(2.00)
$(1.00)
$-
$1.00
$2.00
$3.00
-
-
-
-
+/
-
Illustrative Math
Illustrative Sensitivities
634
$
A
Headline Construction Costs ($MM)
710
B
Headline (Gross) Plant Capacity (MW)
893
$
C=A/B
Headline Construction Costs ($ per kW)
10%
D
Return on Capital
89
$
E=CxD
Capital Return ($ per kW-Year)
30
$
F
Fixed O&M ($ per kW-Year)
119
$
G=E+F
Total Margin Needed ($ per kW-Year)
4,100
H
Total On Peak Hours
29.10
$
I=Gx1000/H
Simple Required On Peak Spark Level ($ per MWh)
697
$
A
680
B
Net Annual Average
Plant Capacity (MW)
1,026
$
C=A/B
Total
Construction Costs ($ per kW)
11%
D
Return
Of
and
On
Capital
113
$
E=CxD
Capital Return ($ per kW-Year)
30
$
F
Fixed O&M ($ per kW-Year)
143
$
G=E+F
Total Margin Needed ($ per kW-Year)
15
$
H
Estimated Off Peak and Weekend Net Margin ($ per kW-Year)
128
$
I=G-H
Remaining Margin to be Recovered During On Peak Hours
92%
J
Plant Availability
3,772
K=4,117xJ
Available On Pk Hours
33.89
$
L=Ix1000/K
Required On Peak Margin per MWh
7.1
M
Realized HR After Effects of Cycling, Use of Duct-Firing, and Degradation (MMBtu per
MWh) 0.45
$
N=(M-7.0)x$4.50
Adder to Cover Realized Heat Rate above 7 HR (at $4.50 Gas Price)
0.72
$
O=0.10*7.2 HR
Adder to Cover Local Fuel Delivery Costs ($0.10 per MMBtu, Converted $ per MWh)
2.50
$
P
Adder to Cover Variable Costs and Major Maintenance Reserve
37.56
$
Q=L+N+O+P
Improved Required On Peak Spark Spread Level ($ per MWh)
SIMPLE MATH
IMPROVED MATH (Changes/Additions in italics)
Total
Construction
Costs
($MM)
-
Includes
Interest
During
Construction |
 2013
Investor Day: Regional Trends
Impacting Our Portfolio
Steve Pruett
Sr. Vice President, Commercial Operations
April 10, 2013 |
 27
27
Important Trends Impacting Our Portfolio
National
Caleb Stephenson
Regional
Steve Pruett
Texas
•
Inefficiency of forward
curves, plus
•
Regulatory shifts
(including our new VMP)
PJM
•
Retiring coal + Demand
Response = Flattish
capacity, but
•
Real upside in energy
Southeast
•
Capturing significant
origination opportunity
with load serving entities
California
•
Near-term: SONGS +
AB32
•
Medium
-term:
Increasing importance of
capacity versus energy
Load Trends
•
Cheer up! Energy efficiency not the
end of load growth
•
Regional
diversity: Texas load
growth outlook remains robust
The
“New Build”
Spark
Spread
•
Spark spreads needed to motivate
new construction
likely higher than
some think
•
Operational realities matter
Gas Price
Immunity
•
Generation volumes
inversely
related to gas prices; margin fairly
neutral
Energy
Capacity
Views of Value |
 28
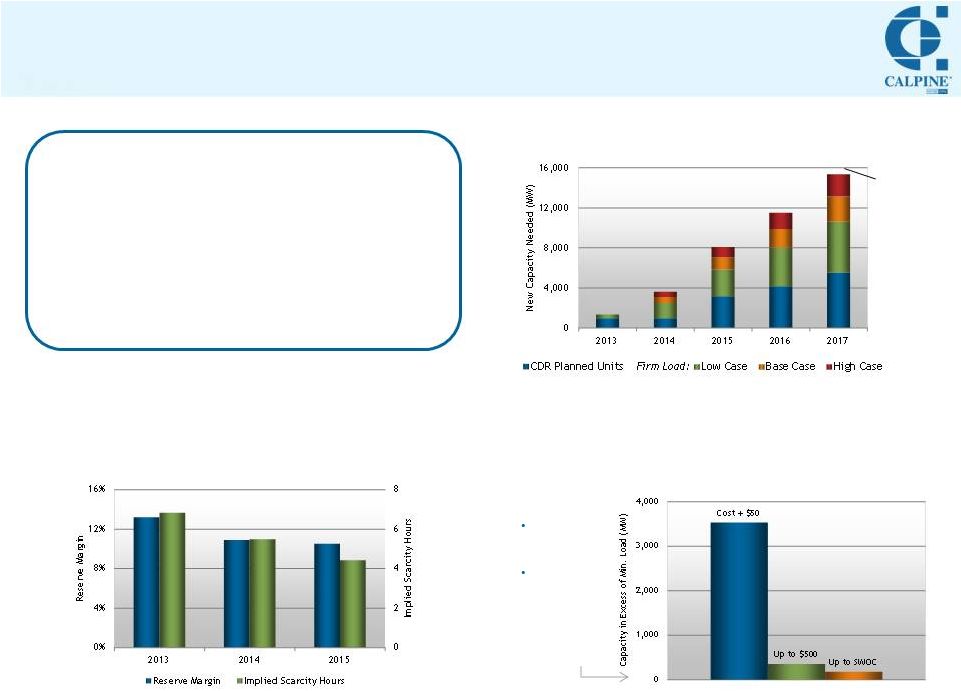
Market Overview: Texas
Addressing Need for New Generation
28
Substantial New Capacity Needed
to Meet Current Reserve Margin Target
Source: Calpine, ERCOT. Represents capacity necessary to meet target
reserve margin of 13.75%. Reflects annual growth of 1.53% / 2.32% / 3.00% for
Low/Base/High Case. CDR Planned Units exclude wind.
Tightening Reserve Margins Should Suggest
More Scarcity, Yet Forward Curves Reflect Less
Source:
ERCOT,
Calpine.
As
of
3/26/13.
Reflects
Jul
-
Aug
of
each
year
and
SWOC
of
$5,000
/
$7,000
/ $9,000 in 2013/2014/2015. Assumes market heat rate (absent scarcity) of 12,000
btu/kWh. Voluntary Mitigation Plan: Protects Bidding
Despite Potentially Volatile Market
Another
1,000 –
1,500 MW
required to
meet
potentially
higher
target
Day Ahead :
Full bidding
discretion
Real Time:
Approved
bidding
parameters
for capacity
above min
load (chart)
Texas Summary:
•
Generation needed: Regulatory reform
necessary to attract more capacity
•
Inefficient forward market not providing
signals
•
Meanwhile, Calpine actively managing its
position in a volatile market
-
VMP approved
How it Works: |
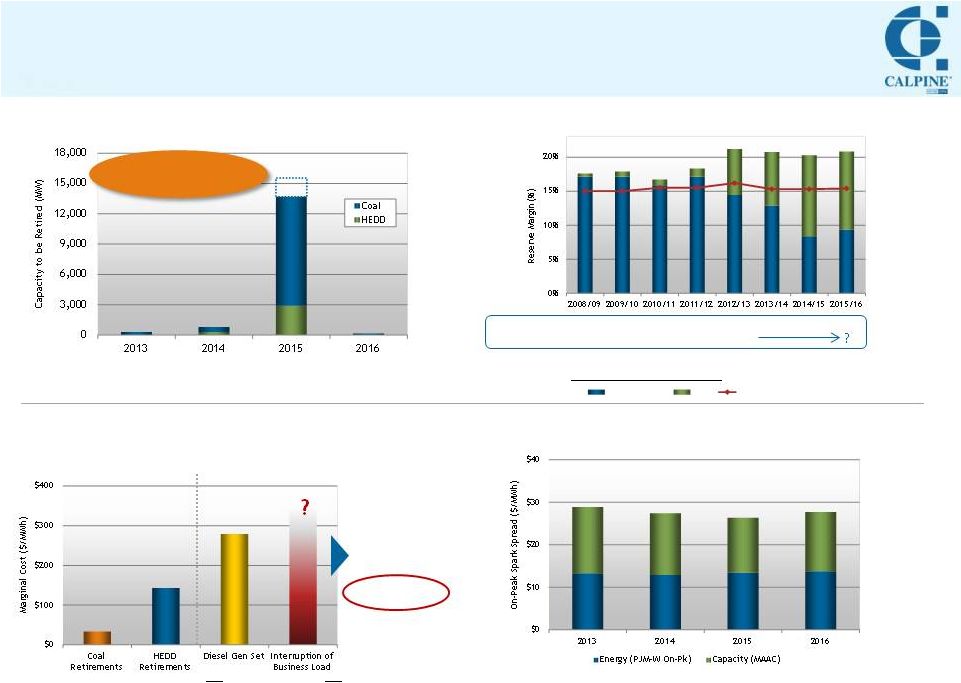 Market
Overview: PJM Retirements + DR = Flattish Capacity, but Energy Upside
Significant Retirements on the Horizon…
…Yet Forward Curves Remain Suppressed
Source: Calpine, PJM, Energy Velocity, SNL. HEDD: High-Energy Demand
Days (New Jersey regulation).
Source: Calpine, Broker quotes. As of 3/26/13. Assumes market heat rate of
8,000 btu/kWh. RPM Capacity prices shown for MAAC and reflect annual
weighted average capacity price, converted into on-peak spark spread
equivalent assuming 50% on-peak capacity factor. 2016 reflects price for 2015/2016 auction, as
2016/2017 rates have not yet been established.
Source: PJM.
…Being Replaced by Demand Response
Capacity in Excess of
Reliability Requirement
7.2%
53.2%
53.6%
57.6%
25.7%
% Commitment
Repurchased:
Replacing Retiring Units with Higher-Cost
DR Should Increase Energy Prices…
Demand Response
Potential impact of
increased DR calls
on summer prices:
+$18/MWh
Source
(DR
Prices):
EIA,
MJ
Bradley.
Diesel
Gen
Set
represents
1500
hp
engine.
See
footnotes in Appendix for additional assumptions for price impact.
(40 hrs. @ $500/MWh)
Retiring Units
Price-Setting Units?
15 –
17GW of
retirements expected
by 2016
29
Generation
DR
Installed Reserve Margin |
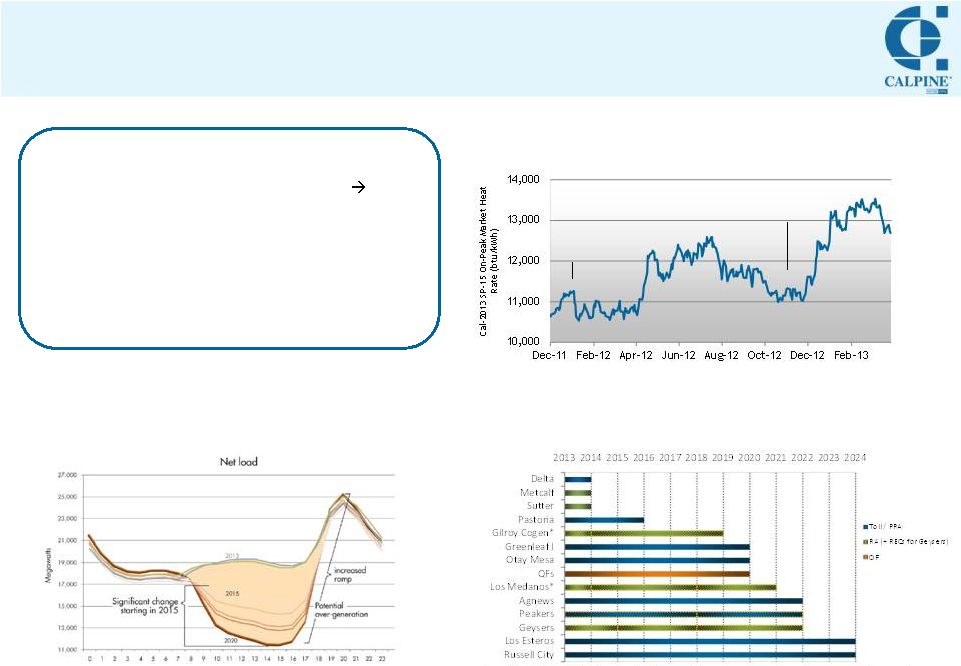 30
Market Overview: California
Increasing Need for Flexible Generation
30
Source: CAISO.
Mid-Term: Renewable Integration Increases
Need for Flexible Generation
Hour of Day
California Summary:
•
Near-term: AB32 + SONGS + Dry summer
Price
volatility
•
Mid-term: Regulatory reform needed to
adequately compensate flexible generation; key
for integration of renewables
•
Good news: Calpine has been effective at
securing capacity contracts
Near-Term: Carbon Regulation and Nuclear
Outage Impacting Market
SONGS
Outage
First Carbon
Auction (AB32)
Source: Calpine, Broker quotes.
Origination Team Successful at
Capturing Value through Contracts
Where full plant output has been contracted, capacities shown here represent summer
peaking capacity as reported in 2012 10-K; actual contract amounts may vary
depending upon contract terms. Contract expiration may occur within the final
year shown. Sutter, Los Medanos and Gilroy Cogen for 2013 represents summer
only. * Indicates contracts subject to CPUC approval in a contested proceeding.
857 MW
500 MW
578 MW
675
650
250 MW
749 MW
515
120 MW
50 MW
608 MW
169 MW
560
28 MW
329 MW
309 MW
619 MW
280 MW
560
Years Contracted: |
 31
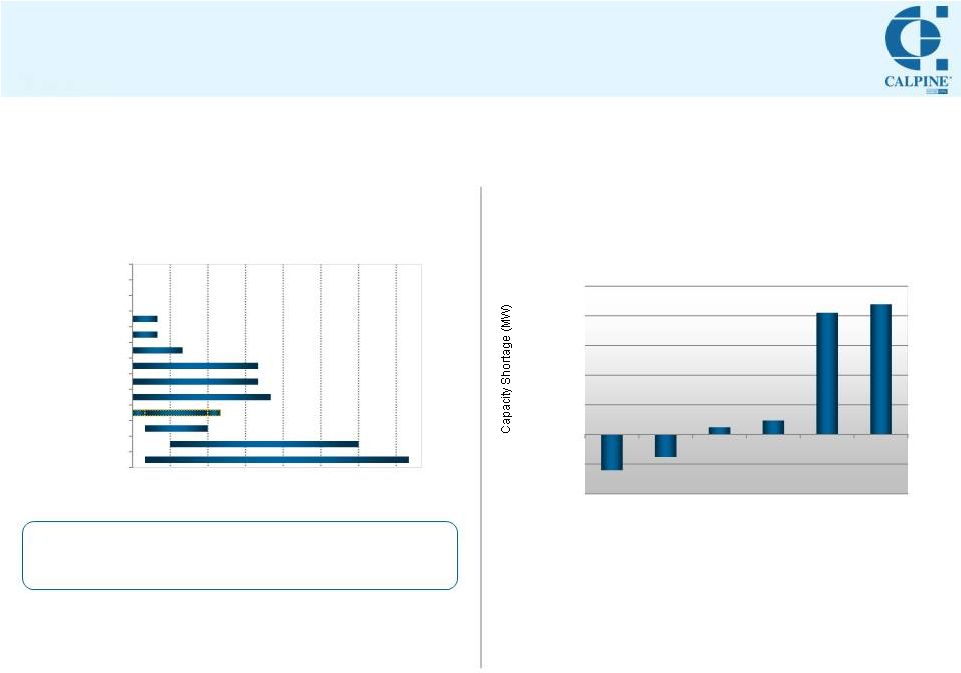
Market Overview: Southeast
Realizing Opportunities with Load Serving Entities
31
Capturing Value: Continued Progress
Upcoming Generation Shortages
Projected in Southeast Region
Utility IRPs + New Capacity –
Projected Retirements
= Significant Deficit
Source:
Calpine,
TVA
IRP,
DUK/PGN
IRP,
Southern
10K,
SCE&G
IRP,
SNL.
Assumes
15%
reserve margin across all utilities.
Recent Updates:
•
•
Years Contracted:
340 MW
225 MW
117 MW
795 MW
485 MW
135 MW
200 MW
200
400
260 MW
160
-
280 MW
Where full plant output has been contracted, capacities shown here represent summer
peaking capacity as reported in 2012 10-K; actual contract amounts may vary
depending upon contract terms.
Contract
expiration
may
occur
within
the
final
year
shown.
Oneta
–
OMPA
represents
summer only.
50 MW
Columbia
Pine Bluff
Hog Bayou
Osprey
Santa Rosa
Auburndale
Decatur
Carville
Morgan
Oneta -
SPS
Oneta -
OMPA
Oneta -
PSO
Oneta -
WFEC
(6,000)
(3,000)
0
3,000
6,000
9,000
12,000
15,000
2013
2014
2015
2016
2017
2018
2013
2016
2019
2022
2025
2028
2031
2034
Decatur: 10-year PPA with TVA
Morgan: Planning to offer capacity into PJM for 2016/2017
|
 32
Maximizing Shareholder Value Through Hedging
32
Portfolio Changes and Hedges Have Shifted
Quarterly Distribution of Earnings
Hedging Objective
Calpine hedges in order to achieve full and fair
value for our assets and maximize return on assets
for our shareholders
Bal-2013
2014
2015
% Hedged
49%
32%
31%
Gas Position
Neutral
Long
Long
% Hedged
68%
33%
31%
Gas Position
Modestly
Short
Neutral
Long
1
Spark spread in NP-15 and ERCOT based upon 7,000 btu/kWh market heat rate and in
PJM-W based upon 8,000 btu/kWh market heat rate. NP-15 adjusted to deduct cost of carbon cap-and-trade,
without which, spark spreads would have been $13.10 and $16.51 as of 10/26/12 and
3/26/13, respectively. Position Updates (Summary)
Note: See complete updates to standard hedge disclosures in Appendix.
3Q12 Call
(10/26/12)
Investor Day
(3/26/13)
NP-15
$8.48
$10.94
ERCOT
$20.75
$21.15
PJM-W
$13.36
$13.29
Nat Gas (HH)
$3.93
$3.90
•
4Q12 Portfolio Changes:
—
Sold Broad River, Riverside (contracted)
—
Acquired Bosque (merchant)
•
Addition of Russell City and Los Esteros (Summer 2013)
•
Changes in hedging profile
—
More open in 2013
—
Seasonal (versus annual) hedges
•
Result:
1Q13
vs 1Q12 / 3Q13
vs 3Q12
2013 Considerations: |
 33
33
APPENDIX |
 34
Energy Margin
1
:
Positioned to Respond to Favorable Secular Trends
34
•
Power position
—
2013: Hedges added; still have Q3
length
—
2014/2015: Remain very open
•
Effective gas position
Reminder:
—
Market heat rates tend to show
inverse relationships with gas prices
in some markets
—
±500
btu/kWh sensitivity shown here, but inverse relationship historically
much stronger at lower gas prices
volumes
and
gas
price
exposures.
Sensitivities
are
assumed
to
occur
across
the
portfolio
and
the
sensitivities
on
strategic
options
only
capture
intrinsic
value.
Volumes
are
on
a
delta
hedge
basis.
Delta
volumes
are
the
expected
volume
based
on
the
probability
of
economic
dispatch
at
a
future
date
based
on
current
market
prices
for
that
future
date.
This
is
lower
than
the notional volume, which is plant capacity, less known performance and operating
constraints. Volumes assume addition of Los Esteros and 75% of Russell City (2013); announced expansions at Deer Park and
Channel (2014); as well as addition of Garrison and retirement of certain plants in New
Jersey related to NOx compliance (2015). Represents Calpine’s forecasted
average annual capacity of net ownership interest with peaking capacity, excluding equity plants. Capacity additions/deletions are reflected in anticipated month of completion.
Spark spread in NP-15 and ERCOT based upon 7,000 btu/kWh market heat rate and in
PJM-W based upon 8,000 btu/kWh market heat rate. NP-15 adjusted to deduct cost of carbon cap-and-trade, without which,
spark spreads would have been been $13.10 and $16.51 as of 10/26/12 and 03/26/13,
respectively. Energy Hedge Profile
2
2013
2014
2015
Hedged Margin
($/MWh)
2
$20
$27
$26
Avg. MW in
Operation
2,4
27,209
27,761
27,934
$ Energy Margin
1,2
as % of
Total Commodity Margin (by year):
75%
77%
78%
Use in conjunction with modeling tips in appendix
Natural Gas Price Sensitivity
2
(assuming no change in heat rate)
Market
Heat
Rate
Sensitivity
2
(assuming no change in gas price)
Summary
Sensitivities
2013
Modestly short
2014
Neutral
2015
Long
3Q12 Call
(10/26/12)
Investor Day
(3/26/13)
NP-15
$8.48
$10.94
ERCOT
$20.75
$21.15
PJM-W
$13.36
$13.29
Nat Gas (HH)
$3.93
$3.90
Energy
Margin
+
Regulatory
&
Other
Margin
=
Total
Commodity
Margin.
Estimated as of 03/26/13. Hedged margin excludes unconsolidated
projects
and
includes
the
current
mark-to-market
adjustments
of
all
executed
transactions.
Changing
market
heat
rates
will
change
delta
1
2
3
4
5 |
 35
Although Calpine’s fleet can be difficult to model,
simplifying techniques may help
35
1.
Estimate annual generation (MWh) based on market outlook relative to
disclosed historical generation with adjustments for asset acquisitions,
asset
divestitures
and
plants
reaching
commercial
operations
as
well
as
changes in gas and coal price environments.
•
Note:
Estimated
generation
in
this
step
should
exclude
volumes
from
unconsolidated investments (Greenfield, Whitby). Margin from these
plants is captured in step 7 below.
2.
Estimate hedged energy margin based on disclosed % hedged (blue bars) and
disclosed hedge margin ($/MWh).
•
Note:
2013
hedged
margin
($/MWh)
is
full
year
average
including
YTD
settlements.
2013
hedge
profile
is
for
balance
of
year
only (applicable
for steps 3 and 4 as well).
3.
Estimate Geysers unhedged energy margin using MWh estimate (historically,
~6 million MWhs), assume the Geysers unhedged % is the same as the entire
portfolio, and apply NP-15 ATC prices.
4.
Estimate gas fleet unhedged energy margin based on rough assumptions:
•
Dispatched generation tends to capture a premium to the block on-peak
spark
spread
for
open
volume.
This
premium
varies
significantly
with,
and is inversely related to, dispatch volumes. For 2013, this
relationship is captured within our guidance. For years past 2013,
depending upon your volume assumption in step 1 above, use the
following rules of thumb for applying the premium:
•
For this exercise, hedge profile is assumed to be relatively flat across
all regions, and disclosed regional steam adjusted plant heat rates
should be considered when calculating spark spreads.
Note: Tips are provided to help investors consider simplifying techniques to
apply the information disclosed to date in their modeling efforts. These tips
are naturally less precise than models based on detailed operational, contract,
and hedge position data might be.
1
Excluding major maintenance expense, non-cash loss on disposal of assets, and
stock-based compensation.
2
Excluding stock-based compensation.
5.
Adjust margin to capture items such as ancillary services and storage
positions
(benefit
of
small
tens
of
millions),
as
well
as
carbon
costs
in
California.
•
To consider Calpine's AB32 costs, apply our combined-cycle average
emissions rate of 876 lb/MWh for the California combined-cycle plants
and assume that ~50% of those costs are passed on to our
customers per contractual arrangements.
6.
The sum of steps 2 through 5 above will provide you with an estimate of our
Energy Margin. To estimate the contribution of Reliability and Other Margin
(regulatory capacity and REC revenue) and arrive at an estimate of Total
Commodity Margin, simply divide the Energy Margin by the disclosed
percentages of Energy Margin as a % of total Commodity Margin.
7.
Add estimated margin from unconsolidated investments (Greenfield, Whitby)
by multiplying Calpine capacity (net interest) by $110/kw-yr in all periods
shown.
•
Since these margins from unconsolidated investments are not included in
Commodity Margin, but are included in Adjusted EBITDA, it is necessary
to additionally estimate expenses related to unconsolidated investments
for purposes of calculating Adjusted EBITDA.
8.
When
modeling
operating
costs
for
the
consolidated
power
plants,
use
2012
reported
plant
operating
expense
and
sales,
general
and
administrative expense and other operating expense and apply an
inflationary factor for 2013 and subsequent periods, with adjustments for
asset acquisitions, asset divestitures and plants reaching commercial
operations.
NON-EQUITY Volume
Projection (MM MWh)
Recommended Premium to
On-Peak Spark Spread
<100
5% -
15%
100 –
110
(5)% -
5%
110 –
120…
(15)% -
(5)%
1
1
2 |
 36
Reliability & Other Margin Detailed
1
Estimated as of 03/26/13. Excludes unconsolidated projects.
2
Amounts shown as percentages of projected 2013 Regulatory & Other Margin.
Excludes unconsolidated projects. 3 Represents volumetric position.
Reliability &
Other Margin
Hedge
Profile
1
Reliability &
Other Margin
Components
2
Substantially hedged
36
RECs
24%
Regulatory
Capacity
76%
100%
94%
92%
6%
8%
Bal-2013
2014
2015
Hedged Dollars
Open Dollars
REC Sales: % Volume
3
2013
100%
2014
97%
2015
95% |
 37
Closer Look at Demand Response in PJM
37
Demand Response in PJM: An Overview
Economic Products as Percent of Total DR Revenue ($9.2 MM in 2012)
Footnotes for Summer Pricing Impact of
Increased DR Dispatch:
Source: Calpine, Energy Velocity.
Summer represents July and August.
Estimate reflects average summer price impact
of the market clearing on the cost of DR (at
assumed $500/MWh) instead of the cost of a gas
turbine (at assumed production cost of
$45/MWh) for 40 incremental hours.
Product
Description
Pricing
Emergency:
Capacity
•
Three types: Annual, Extended
Summer, Limited
•
Receives annual RPM payments set
by Base Residual Auction (if
cleared)
Emergency:
Energy
•
If cleared RPM auction, required
to offer into DA/RT energy
market; can only be called upon
in emergency situations
•
Sets price if needed to avoid
scarcity event
—
Received ~$1,500/MWh in
2012
Economic
•
Offered into day-ahead and/or
real-time markets voluntarily
•
LMP must be > Net Benefits Test
to be dispatched
•
Paid full LMP
—
Often dispatched at
<$100/MWh
Ancillary
Services
•
Quick-response products to
support grid stability
•
Based upon hourly market prices
Source: PJM. |
 2013
Investor Day: Power Operations
John Adams
Sr. Vice President, Power Operations
April 10, 2013 |
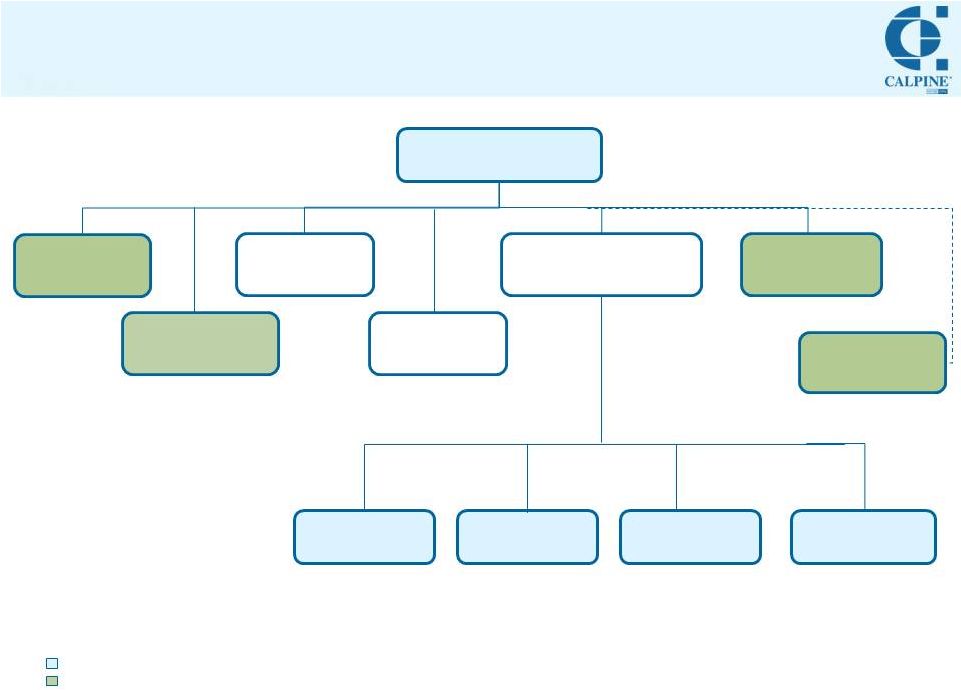
 39
Power Operations Organization
39
West: Rob Parker
Geysers: Mike Rogers
Central: Dave Plauck
Southeast: Rick Colgan
North: Bill Ferguson
Panelist
In Attendance
John Adams
West Region
Geysers
Central Region
Southeast Region
North Region
Outage Services
Ron Macklin
Engineering
Dev. & Opt.
Tom Long
Engineering &
Construction
Supply Chain &
Asset Management
Ron Hall
Andre Walker
Safety
Wendi Martin
Environmental
Services
Derek Furstenwerth
Strategic
Procurement
Murray Sanderford
Sr. Vice President,
Power Operations |
 40
Committed to Best-in-Class Operations
40
Increasing Generation While
Improving Operations…
According to EEI Safety Survey (2011). Includes generation companies only.
1
Success Drivers:
1
…and Maintaining Focus on Safety
Generation
Forced Outage Factor
0.0
1.0
2.0
3.0
4.0
80,000
90,000
100,000
110,000
120,000
2008
2009
2010
2011
2012
3-Yr. Avg.
2012
EEI Top Quartile
—
Predictive and preventive
maintenance
—
Transformer reliability and spares
—
Summer and winter preparation
—
Fleetwide Root Cause Analysis
program
—
Enhanced training
—
Master purchasing agreements:
Volume discounts and parts
consistency
—
Turbine expertise
—
Expanded borescope program
—
Outage planning certainty
—
Optimized parts management
•
Fleet Programs
•
Supply Chain Services
•
Outage Services |
 41
Leveraging Technological Expertise
41
GE
Siemens
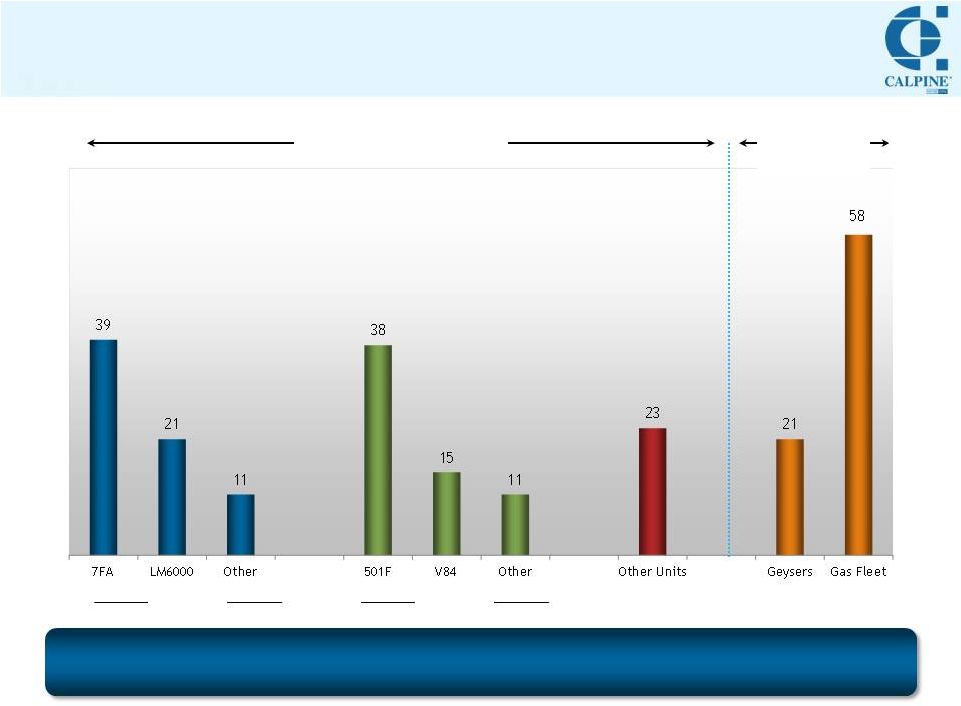
Combustion Turbines (158)
Steam
Turbines (79)
Use of similar technology across fleet provides scale, reduces costs
and facilitates sharing of best practices |
 42
42
MAJOR MAINTENANCE
Ron Macklin
Vice President, Outage Services |
 43
Calpine’s Outage Services
43
Economies of scale + Proprietary knowledge = Competitive Advantage
Preventive Maintenance Supporting
Lower Equipment Failure Expense
•
Calpine Outage Services: Manages Major Maintenance
program
-
Technical, outage, planning, asset, finance and safety
expertise servicing largest modern CCGT fleet in world
and largest co-generation fleet in US
•
Outage Services mission:
-
Eliminate forced outage / equipment failure
-
Provide CCGT maintenance to Calpine fleet
-
Provide technical expertise
-
Exercise cost control and demonstrate accurate
forecasting
•
Scale produces a market
-
Inventory of assets
-
Competition between suppliers
-
Long-term contracts for percent of contracts |
 44
Outage Services: Scheduled Maintenance Program
44
Committed to preserving fleet value through diligent maintenance
2014 -2018 Major Maintenance Schedule
Maintenance Intervals:
•
Combustion Inspection
(Manways open)
-
GE turbine: 12,000/24,000 hrs
-
Siemens turbine: 8,000/16,000/24,000 hrs
•
Hot
Gas
Path
Inspection
(Turbine cover lifted)
-
GE &
Siemens turbines: 24,000 hrs
•
Major Inspection
(Rotor removal, all covers off)
-
GE &
Siemens turbines: 48,000 hrs
5-year average: $350MM
Major maintenance expense and
Capex
Lower $
Higher
$
Rigorous &
Ongoing Maintenance Program
0
10
20
30
40
50
60
70
2014
2015
2016
2017
2018
Combustion inspection
Hot gas path
Major inspection
Steam Turbine Major inspection
Steam Turbine Minor inspection |
 45
45
TURBINE TECHNOLOGY
Tom Long
Vice President, Development and Optimization Engineering |
 46
•
Technology developing; totally new
platforms
•
Original Siemens G-class and GE H-class
abandoned
•
Units
are
lower
heat
rate,
but
less
flexible:
Cannot meet cycling needs as effectively
Calpine F-Class Fleet: Modern and Competitive
46
F-Class:
Advanced Classes:
•
Technology evolution continuing—but not
revolutionary: OEM’s continue to invest
•
Will continue to be the workhorse of industry
•
All Calpine units upgradable
F-Class Will Continue to Be Industry’s Workhorse
—
Efficient
—
Cyclable
—
Reliable
•
GE 7FA
•
Siemens 501F
•
G-, H-
& J-Class
•
GE, Siemens, Mitsubishi
—
Target customer: Baseload
operations in high gas price
environments (e.g. Korea, Japan,
some regulated U.S. utilities) |
 47
5,781
7,240
6,982 -
7,147
636
200
130
0 -
50
235 -
350
Manufacturer
Quoted "New"
HR (LHV)¹
LHV to HHV
Natural Gas
Aux Load
Long-term
Degradation
Ambient
Conditions
(v ISO)
Cycling/
Min Load
Potential
Realized HR
CPN Framed
CCGT Fleet HR-
Non Cogen
(2012)
Making Sense of the Numbers:
Calpine’s Fleet Remains Competitive
47
Calpine’s modern fleet remains competitive as new technology is introduced
Potential to
improve efficiency
given ability to
upgrade with
appropriate market
signals (Fleet only
~25% upgraded)
“Real World”
Operations Necessitate Adjustments
to Published Efficiencies
2
1
LHV: Lower heating value. HHV: Higher heating value. HR: Heat Rate. HR based on
OEM promotional material and ISO ratings. ISO Ratings = 59°F, 60% Relative Humidity, Sea Level
2
Varies from our published fleet-wide steam adjusted heat rate due to exclusion of
technologies other than combine-cycle gas turbines. (2x2x1 Plant)
1 |
 48
48
CONSTRUCTION / NEW-BUILD
Ron Hall
Vice President, Engineering and Construction |
 49
1
Source: Calpine Data, EIA, November 2010, “Updated Capital Cost Estimates for
Electricity Generation Plants”. Figures shown in 2010 real $. 2
Represents
incremental
baseload
capacity
at
annual
average
conditions.
Incremental
summer
peaking
capacity
is
approximately
200
MW
per
unit,
supplemented
by
incremental
efficiencies
across the balance of the plant.
Regional / Local impacts to construction costs:
•
Lateral
interconnection
costs
(gas,
water,
transmission)
•
Climate
impacts
(inside
versus
outside
STG)
•
Air
cooled
condenser
versus
wet
cooling
tower
•
Seismic
design
•
Zero-liquid
discharge
versus
other
means
•
Noise
and
visual
requirements
•
Availability
of
workforce:
Labor
wages
&
productivity
•
Environmental
restrictions
/
limitations
•
Location
adjustments
Cost of Typical CCGT Plant for various locations
Calpine advantages that lower overall construction costs:
•
Organic
growth:
Existing
plants
with
upgrade
flexibility
–
Oversized steam turbines
–
Combustion turbine upgrades
–
Chillers/Foggers/Power augmentation
•
Surplus
equipment
–
F-class combustion turbines & steam turbines
•
Re-powering
/
Expansion
sites
–
Interconnection capability
–
Site infrastructure (water & gas supply, buildings,
substation)
49
Projected Combined-Cycle Construction Costs
Garrison Energy Center (309 MW)
•
Surplus CTG
•
Gray market STG
•
Competitive EPC pricing
Channel & Deer Park Energy Centers
(260 MW each)
•
Surplus CTG
•
Excess capacity STG
•
Existing infrastructure
advantage
$893
$916
$980
$1,005
$1,164
$1,292
$1,650
$400
$600
$800
$1,000
$1,200
$1,400
$1,600
$1,800
Texas
Southeast (AL/FL/GA/LA)
Base 2x1 540 MW NGCC
Mid West
Mid Atlantic
California
New York
2
1 |
 50
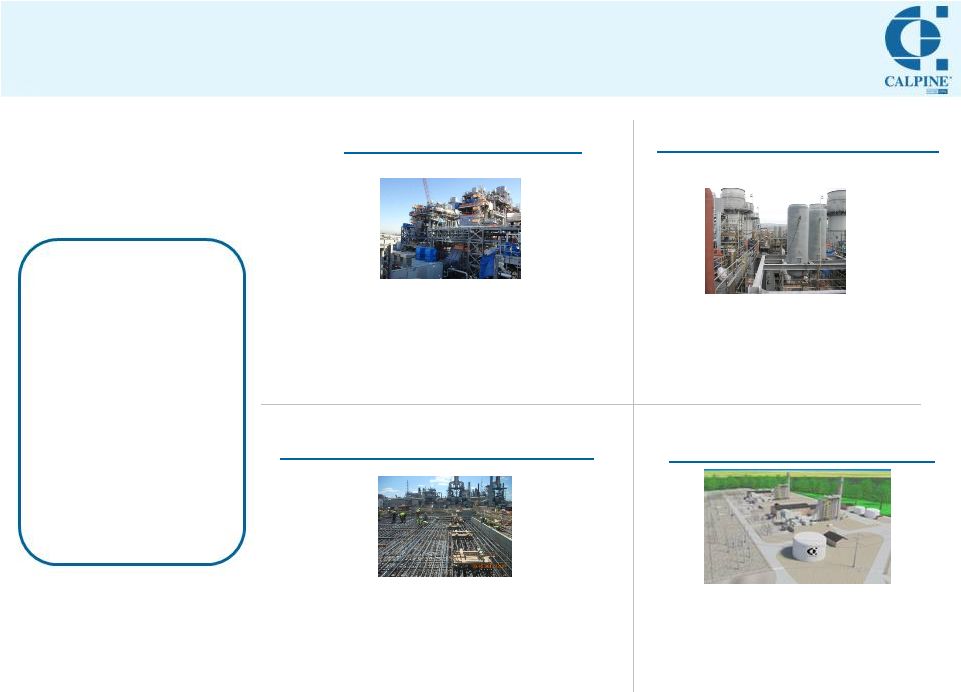
Russell City Energy Center
Hayward, CA
•
464 MW
1
2x2x1 CCGT
•
Siemens FD3 CTGs, GE D-11 STG
•
10 year contract to PG&E
•
Commissioning in progress
•
COD Summer 2013
•
120 MW 4x4x1 CCGT Conversion
•
GE LM 6000 CTGs, MHI STG
•
10 year contract to PG&E
•
Commissioning in progress
•
COD Summer 2013
Los Esteros Critical Energy Facility
San Jose, CA
Deer Park and Channel Energy Centers
Houston, TX
•
260 MW
2
incremental capacity at each site
•
Siemens FD3 CTGs
•
Leveraging existing sites and
equipment
(~ $400/kW savings)
•
Foundations currently being poured
•
COD Summer 2014
Garrison Energy Center
Dover, DE
•
309 MW CCGT greenfield site
•
New GE 7F.04 CTG, A10 STG
•
Leveraging existing equipment and
advantaged site (~ $250/kW savings)
•
Now under construction
•
COD Summer 2015
50
Calpine Construction Projects
1
Represents Calpine share.
2
Represents
incremental
baseload
capacity
at
annual
average
conditions.
Incremental
summer
peaking
capacity
is
approximately
200
MW
per
unit,
supplemented
by
incremental
efficiencies
across the balance of the plant.
Calpine
Construction
Philosophy
•
Owner-furnished
equipment
•
Efficient Calpine
team
•
Deep expertise
•
Leverage best EPC’s |
 2013
Investor Day: Regulatory Panel
Thad Miller
Executive Vice President,
Chief Legal Officer
April 10, 2013 |
 52
Texas & SE
52
52
Legal and Regulatory Team
EVP, Chief Legal Officer
Thad Miller
Legal
Governmental &
Regulatory
Affairs
Corporate
Communications
Internal Audit/
Compliance
Insurance
Panelist
William Taylor
Environmental
In Attendance
West
North
FERC & ISOs
Federal
Steve Schleimer
Mark Smith
Norma Dunn
Joe Ronan
Derek Furstenwerth
Yvonne McIntyre
Shonnie Daniel
Randy Jones |
 53
Overarching Regulatory Themes
Key Fronts for Continued Progress
53
Moving toward fairer, more transparent and stable price signals
•
In CA, seeking to
•
eliminate discrimination between old and new generation
•
obtain appropriate compensation for flexibility attributes of CCGTs
•
In TX, advocating to
•
adopt a capacity market to incent investment, assuring long term
viability of competition
•
in the interim, reduce impediments to scarcity pricing in energy-only market
design •
In PJM, refining MOPR, DR rules to assure a level playing field
Allowing markets (not regulators) to choose “winners”
•
Challenging NJ/MD efforts to exert buyer-side market power subsidizing new plants
•
Opposing legislative/regulatory actions denying ratepayers benefits of lower wholesale
prices through uneconomic
•
utility self-builds (CA, OR, VA, NV, MN)
•
offshore wind (ME, MD) and intermittent renewables (CA)
Role
of
DR
must
align
with
environmental
and
competitive
markets
goals
•
Protect environmental ground gained by limiting DR from behind-the-meter,
uncontrolled, inefficient generator sets to replace retiring coal plants or
otherwise supplant gas generation •
If DR to be compensated similar to generators, assure comparable
performance requirements
and non-performance penalties
Market
Structure/
Rules
Non-
Competitive/
Subsidized
Generation
Demand
Response |
 54
54
Advocating for Competitive Markets and Responsible Regulation
As of 4/10/2013
West (CAISO)
•
Assure incremental
compensation for gas
generation with flexibility
attributes critical to
integration of intermittent
renewables
•
End discrimination against
existing (vs. new) generation
and ensure adequate
compensation for existing
generation
•
Support and refine GHG Cap-
and-Trade
Multi-regional
•
o
success in OK,
progress in MN, battles
in CA/OR/NV/VA
Texas (ERCOT)
•
•
o
Safe harbor allows more rational bidding
•
o
PUCT active consideration likely this year
Federal
•
Congress –
inaction likely to continue
o
Climate
Change:
resurgent
o
GHG and other EPA rules:
Unlikely to be blocked
o
PTC:
extended thru ’13
o
Cybersecurity:
Multiple proposals; Executive Order
interim measure
•
EPA –
activism to continue
o
MATS:
In effect, court case slogs on
o
CSAPR:
o
Coal
Ash:
o
316(b)
(OTC):
o
GHG
(new sources):
Rule final this year
o
GHG (existing sources):
Proposed rule on hold
•
CFTC Derivatives Rules
o
CPN qualifies for end-user exemption
•
FERC –
new leadership?
o
Trending positive on support for capacity markets
Rulings on ISO-NE, NY-ISO capacity market rules
NERC letter to ERCOT on resource adequacy
Ruling on CAISO application for “forward
backstop mechanism”
made right noises on
PJM MOPR ruling pending
o
Gas/Electric Interdependency review underway
North (PJM, MISO, ISO-NE, NY-ISO)
•
Continue to refine rules to promote fair and
transparent market precluding
NJ, MD court cases
FERC approval of MOPR fix pending
PJM rules tightened
Challenging dirty DR
•
Oppose MISO capacity transportability into PJM
•
Assure ISO-NE concerns on gas/electric
interdependency lead to market-based solution
not mandate
No
Sandy
surge
but
dialogue
Overturned,
EPA
appealing
to
USSC
Rule
delayed
Final
rule
expected
‘13
Oppose uneconomic
utility self-builds
o
Some
implemented
and
considering
others
affecting operating reserves
Support
interim
changes
to
allow
scarcity
pricing
Approval of Calpine’s Voluntary Mitigation Plan
Support transition to capacity market to assure
long-term reliability
o
Opposed by PJM/some MISO stakeholders
o
FERC to hold conference
o
State exercise of buyer-side market power
o
Special treatment for DR resources |
 55
55
APPENDIX |
 56
Initiatives
•
FERC Rule on DR
•
FERC Review of
Gas/Electric
Coordination Issues
•
Cybersecurity
•
Dodd-Frank & CFTC
Regulation
Comments
•
Appealed to court asserting unfairly
overcompensates DR relative to
generation and threatens reliability
•
ISO-NE and MISO concerned about gas
transport insufficiency
•
ISO-NE actively examining energy and
capacity market rules changes to help
alleviate problem
•
Executive order issued: government-
private sector information sharing
program and cybersecurity best practices
framework
•
CPN continues
to
qualify for end-user
exemption
56
Environmental Regulation
Initiatives
•
GHG Performance Standards
•
Mercury and Air Toxics Standards
(MATS)
•
Cross-State Air Pollution Rule
(CSAPR)
•
Revised PM-2.5 Ambient Air
Quality Standard
•
Coal Combustion Residuals
Management Rule
•
Cooling Water Intake Structures
(Once-through-cooling Rule)
•
National Emissions Standards for
Hazardous Air Pollutants for
Reciprocating Internal Combustion
Engines (RICE-NESHAP)
Comments
•
Final rule for new sources
expected ‘13
•
Existing sources on hold
•
Effective 4/15
•
Challenged in court but no stay
•
Vacated by Court; remanded to
EPA for revisions; EPA likely to
appeal
•
CAIR in effect
•
Reset PM-2.5 NAAQS based on
latest science; effective by ‘15
•
Regulates bottom ash/sludge/
slag as waste
•
Final rule timing uncertain
•
Reduces impingement/
entrainment impacts on aquatic
life
•
Final rule by mid-’13;
compliance starts mid-2015
•
Final rule contradicts national
environmental goals
•
Being challenged in court
Market Regulation
Regulatory and Legislative Overview: Federal
Continuing the March Toward Responsible Environmental Policy
|
 57
Regulatory and Legislative Overview: North Region
Discouraging Non-competitive Resources
57
Non-Competitive/Subsidized Generation
Market Structure/Rules
Demand Response
Initiatives
•
New Jersey (LCAPP) & Maryland
(RFP process) subsidized
generation
•
Utility self-build
•
Renewables
Comments
•
Both trials underway
•
May issue decision prior to May
auction
•
Challenging competitiveness of
rate based assets in VA, MN
•
Offshore Wind: MD law passed,
but with significant safeguards; NJ
still examining policies
•
Canadian Hydro: CT proposal to
count as “Tier 1”
renewable
Initiatives
•
Capacity Markets
Comments
•
PJM: Strengthening MOPR
process
•
ISO-NE: FERC approved strong
buyer-side market power rules
over objections of states; price
floor going away in next auction
•
NY-ISO: FERC approves
generators’
complaint over
implementation of buyer-side
market power rules
Initiatives
•
Treatment and impact of
increasing role of demand
response
Comments
•
Court challenge to RICE NESHAP
(dirty DR) filed
•
ISO-NE/PJM continue to
strengthen DR rules
Other Regional Issues
Initiatives
•
Regional Greenhouse Gas
Initiative (RGGI)
•
“Seams”
Issues
Comments
•
Tighter GHG caps proposed
across region
•
PA and NJ key states out of
program, creating “leakage”
•
MISO/PJM addressing
operational improvements and
capacity portability by MISO
into PJM |
 58
Regulatory and Legislative Overview: Texas Region
Incentivizing New Capacity
58
Market Structure/Rules
Other Regional Issues
Initiatives
•
PUCT Resource Adequacy
Proceedings
•
PUCT Scarcity Pricing
Proceedings
•
Capacity, Demand and Reserves
(CDR) forecast
•
Demand Response Proceeding
•
Calpine’s Voluntary Mitigation
Plan (VMP)
•
ERCOT Scarcity Pricing
Proceedings
Comments
•
Required v. target reserve margin
•
Energy-only v. capacity market
•
Increased System Wide Offer Cap
•
Considering interim operating reserve
demand curve proposals:
•
PUCT/ERCOT review of inputs for bi-
annual CDR to establish appropriate
reserve margin target
•
PUCT considering how to
incorporate/increase DR (economic
and reliability response) without
adverse impact to market
•
PUCT approved plan (3/28) provides:
•
Limiting mitigation to resources that
contribute to real-time non-
competitive constraints
•
Reducing deployment of Regulation-
Up service
Initiatives
•
2013 Legislative Agenda
•
PUCT Commissioner
update
Comments
•
PUCT Sunset review
•
Proposed legislation requiring cost-
benefit analysis before changing
market structure
•
Environmental legislation authorizing
TX to assume authority from EPA for
GHG permitting
•
Pablos replacement not likely until
after end of regular legislative
session (May 27)
o
establishing “price adder”
to
existing real-time scarcity price
o
adding operating reserves with
$350/MWh floor (Non-Spin Res.)
o
informal bidding guidance for
other market participants
o
creates safe harbor against market
power abuse charges
o
guidelines for CPN’s bidding behavior |
 59
Initiatives
•
CPUC: Long Term Planning &
Procurement (LTPP)
•
CPUC: Resource Adequacy (RA)
•
CAISO: Forward Capacity
Procurement Initiatives
Comments
•
Pursuing new products that:
Regulatory and Legislative Overview: West Region
Properly Compensating Existing, Flexible Generation
59
Market Structure/Rules
Non-Competitive/Subsidized Generation
Other Regional Issues
Initiatives
•
Utility self-build (or BOT)
•
Subsidized renewables and
generation alternatives (DR,
Storage, etc.)
Comments
•
Regulators continue to support
uneconomic/unneeded projects
at expense of existing generation
and ratepayer
•
Policies continue to increase
renewable investment and drive
need for system flexibility for
integration of renewables
•
GHG reduction policies focus on
uneconomic alternatives to
conventional generation
Initiatives
•
California Air Resources Board
(CARB) GHG Cap-and-Trade
Program (AB32)
•
Water Resources Control Board:
Once-Through-Cooling (OTC)
Comments
•
Emissions market functioning
with two auctions already held
•
CARB staff reviewing rules
refinements to assure long term
viability of market
•
Replacement of OTC units: Part
of IOU procurement analysis
being discussed at CPUC & CEC
o
Provide incentive for procurement
of existing generation intermediate
term
o
Allow existing and new power
plants to compete on equal basis
(FERC ruling on CAISO forward
backstop creates pressure point)
o
Compensate flexible gas
generation critical to integration of
intermittent renewables |
 2013
Investor Day: Financial Overview
Zamir Rauf
Exec. Vice President, Chief Financial Officer
April 10, 2013 |
 61
Note: Debt balances as of 12/31/12.
1 Includes net debt of unconsolidated projects.
2 Figures
based
upon
TTM
(2012)
Adjusted
EBITDA.
Calculation
excludes
project
debt
associated
with
Russell
City
and
Los
Esteros
while
under
construction,
as
well
as
effective
corporate
debt
(equivalent
capital spend) for Garrison, Deer Park and Channel projects.
3 A non-GAAP financial measure. Reconciliations of Adjusted EBITDA and
Adjusted Free Cash Flow to Net Income (Loss), the most comparable U.S. GAAP measure, are included herein.
Capital Structure Optimization
Opportunistically managing maturities and streamlining capital structure
while
delivering
interest
savings
and
increasing
Adj.
FCF /share
Recent Activities:
Delivered
~ $0.08
Adj.
FCF /Share
Savings
•
Oct 2012:
—
Issued term loan to refinance 10% of Sr. Secured
Notes ($590 MM) and retire BRSP ($218 MM)
—
~$25 MM annual interest savings
•
Feb 2013:
—
Repriced all $2.5B of term loans
—
~$12 MM annual interest savings
Upcoming Opportunities:
•
8.0% CCFC bonds due 2016
—
$1 billion callable at 104 in Jun 2013
•
7.25% Senior Secured Notes due 2017
—
$1.08 billion callable at 103.6 in Oct 2013
•
10%
of
all
Senior
Secured
Notes
(7.25%
-
8.0%)
—
Currently callable at 103 in twelve month intervals
(next opportunity: Oct 2013)
CCFC
$978
Capital Leases
$217
Notes Payable/
Other
$47
Gross Debt:
$10,750
Less: Cash, Cash Equivalents & Rest. Cash:
$(1,537)
Net Debt
:
$9,405
Net
Debt
/
Adjusted
EBITDA
:
4.9x
Average Interest Rate:
2008
8.8%
2013
7.3%
Corporate Debt
Senior Secured Notes
$5,303
First Lien Term Loan
$2,463
Corporate Revolver
—
Total Corporate
Debt $7,766
Project Debt
$1,742
($ millions)
61
3
3
1
1
2 |
 62
Strong Liquidity, No Near-Term Refinancing Risk
62
No
Near-Term
Maturities
Projected Scheduled Amortizations
& Estimated Cash Sweeps
($ millions)
Represents ~$1B of debt paydown
Minimum:
$1 billion
Strong Liquidity / Better Quality
Capital Allocation Flexibility
Project Debt
CCFC
Senior Secured Notes
Senior Secured Term Loans
Restricted Cash
Cash
and Cash Equivalents, Non-corporate
Cash
and Cash Equivalents, Corporate
Revolver / LC Availability
1
Debt maturity schedule shown here is not prepared on a U.S. GAAP basis and does not
conform to debt maturity schedule presented in Calpine’s Form 10-K. (Refer to the 2012 Form 10-K for further
information regarding U.S. GAAP-basis debt maturities). Assumptions used in
debt maturity charts shown here are as follows: (i) excludes letter of credit facilities; (ii) maturity balances assume cash
sweeps; and (iii) all other debt maturities are paid from operating cash flows at the
project level. Project debt in 2019 represents projected balance for OMEC. Put price in the PPA approximates the
projected debt balance.
1
$658
$567
$757
$1,058
$946
$1,153
$269
$306
$131
$248
$194
$253
2010
2011
2012
Calpine
Peers
Environmental CapEx
Legacy Environmental Liabilities
Decommissioning Liabilities
Underfunded Pension Liability
Cash Taxes
Discretionary Capital Allocation
$1,000
$1,080
$1,368
$1,544
$1,421
$990
$1,800
2013
2014
2015
2016
2017
2018
2019
2020
2021
2022
2023
$140
$180
$190
$200
$210
2013
2014
2015
2016
2017
$2,294
$2,013
$2,233 |
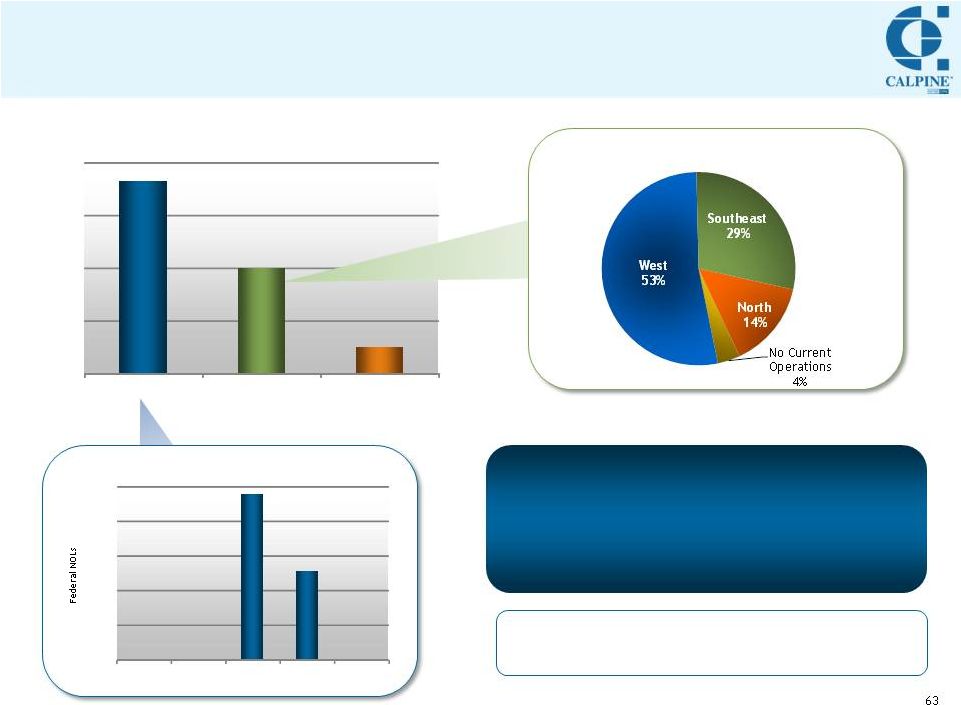 63
NOLs: Additional Source of Value
NOL Summary
NOL usage enhances excess liquidity
available for capital deployment
NOL Benefits
Cash tax savings since 2010
~$250 MM
Southeast fleet tax basis
~$200/kW
($ millions)
Managing Expirations to Maximize Value
State NOLs Present Additional Opportunity
Note: Calpine does not have state NOLs in Texas due to lack of
income tax in the state. (Companies instead pay franchise taxes.)
$0
$2,000
$4,000
$6,000
$8,000
Federal
State
Foreign
$0
$1,000
$2,000
$3,000
$4,000
$5,000
0 -
5
6 -
10
11 -
15
16 -
20
Over 20
Years Until Expiration
63 |
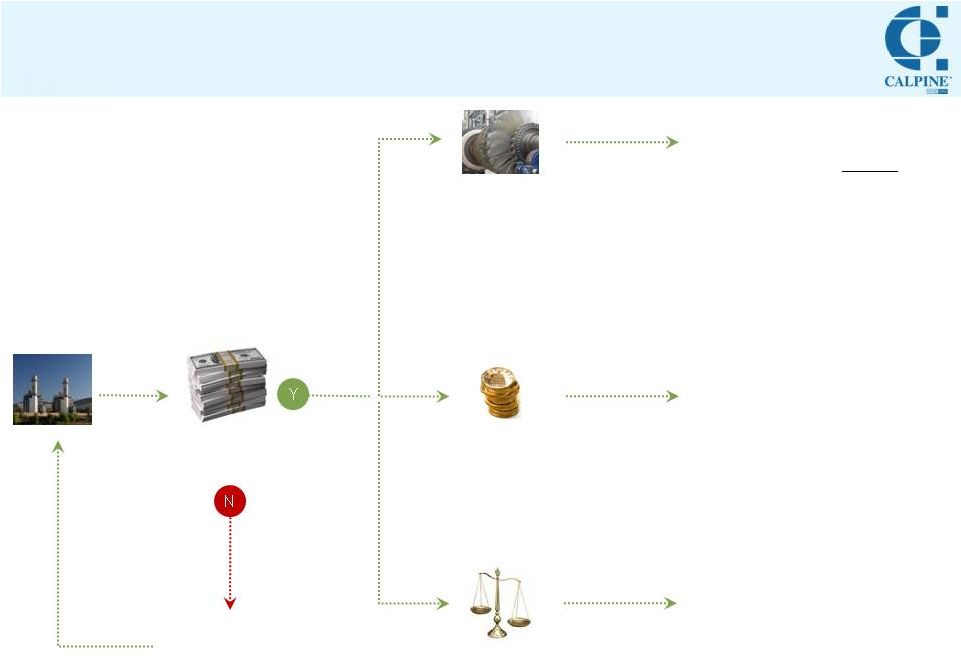 64
Disciplined Approach to Capital Allocation
Minimum liquidity
met?
•
$1 billion
FOCUS ON
OPERATIONAL
PERFORMANCE
High return investment
opportunities available?
Need to reduce leverage?
Ability to return capital?
INVEST IN GROWTH
•
Accretive
to
Adj.
FCF
1
per
share
•
Equity returns above cost of
capital
•
Benchmark against share
repurchase
•
Ensure ability to achieve target
credit ratios over time
REDUCE LEVERAGE
•
Leverage target:
~4.5x
Net
Debt
/
Adj.
EBITDA
1
•
Actual ratio may fluctuate, but
target remains in sight
RETURN CAPITAL
•
Flexible capital structure
•
Share buyback: Effectively buying
back our own plants at a discount
•
Ability to consider dividend if/when
time is right
Excess
Cash
Adj. Free
Cash Flow
64
1
A non-GAAP financial measure. Reconciliations of Adjusted EBITDA and Adjusted
Free Cash Flow to Net Income (Loss), the most comparable U.S. GAAP measure, are included herein. |
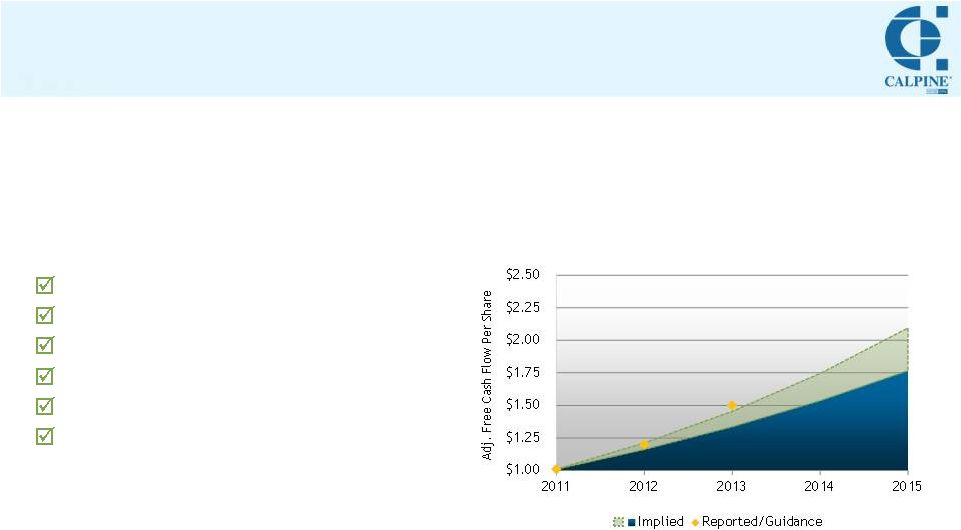 65
Capital Allocation Drives Adj. Free Cash Flow Per Share Growth
65
Driving Adj. FCF
1
/Share Growth
Successfully Deploying Capital
1
A non-GAAP financial measure. Reconciliations of Adjusted EBITDA and Adjusted
Free Cash Flow to Net Income (Loss), the most comparable U.S. GAAP measure, are included herein.
Financially disciplined growth
Accretive acquisitions
Asset monetization and capital reallocation
Opportunistic share repurchases
Optimizing capital structure
Paying down debt
20% CAGR
15% CAGR
(15-20% CAGR) |
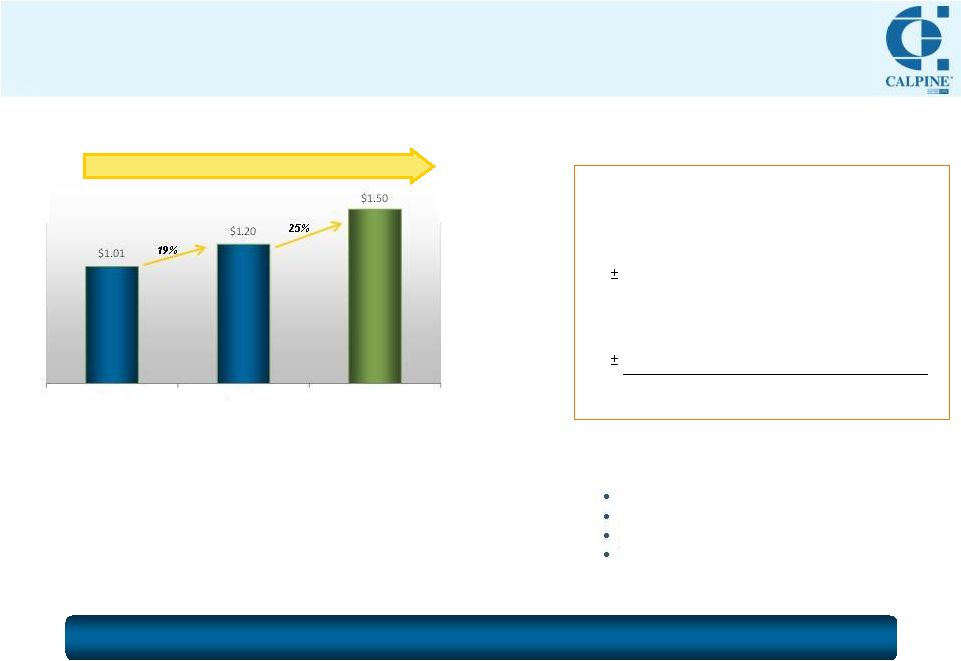 66
Both metrics presented before capital
allocation activity:
Principal repayment
Organic growth investments
M&A
Share repurchases
Merits of Adj. Free Cash Flow Per Share
•
More accurately reflects shareholder value than
absolute Adj. EBITDA
1
or FCF
1
•
Captures value created by
—Asset
sales —Interest savings
—Tax position
(NOL) —Share repurchases
Adj. FCF Per Share
1
…
…A Proxy for Cash Earnings Per Share
Earnings Per Share
+
Non-Cash Taxes
+
Non-Cash Interest (net)
Non-Cash Unrealized Mark-to-Market
+
Depreciation & Amortization
—
Maintenance CapEx
Other non-cash / non-recurring items
2
=
Adj. FCF Per Share
1
Adj. FCF/Share
1
Growth: Representative of potential total shareholder return
Targeting 15 —
20% CAGR
66
1
A non-GAAP financial measure. Reconciliations of Adjusted EBITDA and Adjusted
Free Cash Flow to Net Income (Loss), the most comparable U.S. GAAP measure, are included herein.
2
Includes non-cash stock compensation expense, non-cash (gain) loss on disposal
of assets, and other items. 2011
2012
2013E |
 67
67
APPENDIX |
 68
Adjusted EBITDA represents net income (loss) attributable to
Calpine before net income (loss) attributable to the
noncontrolling interest, interest, taxes, depreciation and
amortization, adjusted for certain non-cash or non-recurring
items as detailed in the following reconciliation. Adjusted
EBITDA is presented because our management uses Adjusted
EBITDA (i) as a measure of operating performance to assist in
comparing performance from period to period on a consistent
basis and to readily view operating trends; (ii) as a measure
for planning and forecasting overall expectations and for
evaluating actual results against such expectations; and (iii)
in communications with our Board of Directors, shareholders,
creditors, analysts and investors concerning our financial
performance. We believe Adjusted EBITDA is also used by
and is useful to investors and other users of our financial
statements in evaluating our operating performance because
it provides them with an additional tool to compare business
performance across companies and across periods. Adjusted
EBITDA is not a measure calculated in accordance with U.S.
GAAP, and should be viewed as a supplement to and not a
substitute for our results of operations presented in
accordance with U.S. GAAP. Adjusted EBITDA is not intended
to represent cash flows from operations or net income (loss)
as defined by U.S. GAAP as an indicator of operating
performance. Furthermore, Adjusted EBITDA is not
necessarily comparable to similarly-titled measures reported
by other companies.
Adjusted Free Cash Flow represents net income (loss)
attributable to Calpine before net income (loss) attributable
to the noncontrolling interest, interest, taxes, depreciation
and amortization, as adjusted, less operating lease
payments, major maintenance expense and maintenance
capital expenditures, net cash interest, cash taxes, and other
adjustments, including non-recurring items. Adjusted Free
Cash Flow is a performance measure and is not intended to
represent net income (loss), the most directly comparable
U.S. GAAP measure, or liquidity and is not necessarily
comparable to similarly titled measures reported by other
companies.
_________
(1)Depreciation and amortization expense in the income from operations calculation on
our Consolidated Statements of Operations excludes amortization of other assets.
(2)Included on our Consolidated Statements of Operations in (income) from
unconsolidated investments in power plants. (3)Adjustments to reflect Adjusted
EBITDA from unconsolidated investments include unrealized (gain) loss on mark-to-market activity of nil for each of the three months ended December
31, 2012 and 2011, respectively, and nil and $1 million for the years ended December
31, 2012 and 2011, respectively. (4)Includes $42 million and $192 million in
major maintenance expense for the three months and year ended December 31, 2012, respectively, and $35 million and $183 million in
maintenance capital expenditures for the three months and year ended December 31, 2012,
respectively. Includes $27 million and $201 million in major maintenance expense for the
three months and year end December 31, 2011, respectively, and $35 million and $196
million in maintenance capital expenditures for the three months and year ended December 31,
2011, respectively.
(5)Includes commitment, letter of credit and other bank fees from both consolidated and
unconsolidated investments, net of capitalized interest and interest income. Reg G
Reconciliation: Adjusted EBITDA and Adjusted Free Cash Flow
Net income (loss) attributable to Calpine
$
199
$
(190)
Net income attributable to the noncontrolling interest
Income tax expense (benefit)
Debt extinguishment costs and other (income)
expense, net
(Gain) loss on interest rate derivatives
Interest expense, net of interest income
Income from operations
$
1,002
$
800
Add:
Adjustments to reconcile income from operations to
Adjusted EBITDA:
Depreciation and amortization expense, excluding
deferred financing costs
(1)
Major maintenance expense
Operating lease expense
Unrealized (gain) loss on commodity derivative mark-
to-market activity
(Gain) on sale of assets, net
Adjustments to reflect Adjusted EBITDA from
unconsolidated investments
(2)(3)
Stock-based compensation expense
(Gain) loss on dispositions of assets
Acquired contract amortization
Other
Total Adjusted EBITDA
$
1,749
$
1,726
Less:
Operating lease payments
Major maintenance expense and capital expenditures
(4)
Cash interest, net
(5)
Cash taxes
Other
Adjusted Free Cash Flow
(6)
$
564
$
489
Weighted average shares of common stock
outstanding (diluted, in thousands)
Adjusted Free Cash Flow
Per Share (diluted)
$
2011
Year Ended December 31,
2012
$
1.20
471,343
485,381
8
11
757
781
11
13
34
35
375
397
7
25
12
16
14
8
31
36
25
24
82
25
(222)
—
200
205
34
35
564
552
725
751
45
115
14
145
—
1
19
(22)
(6)Excludes a decrease in working capital of $91 million and $107 million for the three
months and year ended December 31, 2012, respectively, and a decrease in working capital of $8
million and increase in working capital of $13 million for the three months and year
ended December 31, 2011, respectively. Adjusted Free Cash Flow, as reported, excludes changes in
working capital, such that it is calculated on the same basis as our guidance.
1.01 |
 Full Year 2013 Range:
Low
High
GAAP Net Income
(1)
$
175
$
335
Plus:
Interest expense, net of interest income
745
745
Depreciation and amortization expense
575
575
Major maintenance expense
205
205
Operating lease expense
35
35
Other
(2)
65
65
Adjusted EBITDA
$
1,800
$
1,960
Less:
Operating lease payments
35
35
Major maintenance expense and maintenance capital
expenditures (3)
370
370
Cash interest, net
(4)
755
755
Cash taxes
15
15
Other
10
10
Adjusted Free Cash Flow
$
615
$
775
_________
(1) For purposes of Net Income guidance reconciliation, unrealized
mark-to-market adjustments are assumed to be nil. (2)
Other includes stock-based compensation expense, adjustments to reflect Adjusted EBITDA from unconsolidated investments, income tax expense and other items.
(3) Includes projected major maintenance expense of $210 million and
maintenance capital expenditures of $160 million. Capital expenditures exclude
major construction and development
projects. 2013 figures exclude non-recurring IT system upgrade.
(4) Includes commitment, letter of credit and other bank fees from both
consolidated and unconsolidated investments, net of capitalized interest and interest income.
(in millions)
69
Reg G Reconciliation: 2013 Adjusted EBITDA
and Adjusted Free Cash Flow Guidance |
 70
Investor Relations Contacts
•
Calpine Investor Relations
investor-relations@calpine.com
713-830-8775
•
Christine Parker
Director, Investor Relations
parkerc@calpine.com
713-820-4023
•
Bryan Kimzey
Vice President, Investor Relations
bryan.kimzey@calpine.com
713-830-8777 |
 |