Attached files
| file | filename |
|---|---|
| 8-K - 8-K - Mead Johnson Nutrition Co | a13-7693_18k.htm |
Exhibit 99.1
|
|
0 0 The Consumer Analyst Group of Europe Conference March 20, 2013 Pete Leemputte EVP and Chief Financial Officer Kasper Jakobsen EVP and Chief Operating Officer |
|
|
1 1 Safe Harbor Statement Forward-Looking Statements Certain statements in this presentation are forward looking as defined in the Private Securities Litigation Reform Act of 1995. These statements, which are identified by words such as “expects,” “intends” and “believes,” involve certain risks, uncertainties and assumptions that may cause actual results to differ materially from expectations as of the date of this presentation. These risks include, but are not limited to: (1) the ability to sustain brand strength, particularly the “Enfa” family of brands; (2) the effect on the company’s reputation of real or perceived quality issues; (3) the adverse effect of commodity costs; (4) increased competition from branded, private label, store and economy-branded products; (5) the effect of an economic downturn on consumers’ purchasing behavior and customers’ ability to pay for product; (6) inventory reductions by customers; (7) the adverse effect of changes in foreign currency exchange rates; (8) the effect of changes in economic, political and social conditions in the markets where we operate; (9) legislative, regulatory or judicial action that may adversely affect the company’s ability to advertise its products or maintain product margins; (10) the possibility of changes in the Women, Infant and Children (WIC) program, or participation in WIC; (11) the ability to develop and market new, innovative products; and (12) the effect of recently imposed trading restrictions in the China/Hong Kong market. For additional information on these and other factors, see the risk factors identified in the company’s periodic reports, including our most recent annual report on Form 10-K, quarterly reports on Form 10-Q and current reports on Form 8-K, filed with, or furnished to, the Securities and Exchange Commission, available upon request or at www.meadjohnson.com. The company undertakes no obligation to publicly update any forward-looking statement, whether as a result of new information, future events or otherwise. Factors Affecting Comparability—Non-GAAP Financial Measures This presentation contains non-GAAP financial measures, including non-GAAP net sales, EBIT, earnings and earnings per share information. The items included in GAAP measures, but excluded for the purpose of determining non-GAAP net sales, EBIT, earnings and earnings per share, are IT separation and other costs (Specified Items). In addition, other items include the tax impact on Specified Items. Non-GAAP net sales, EBIT, earnings and earnings per share information adjusted for these items is an indication of the company’s underlying operating results and intended to enhance an investor’s overall understanding of the company’s financial performance. In addition, this information is among the primary indicators the company uses as a basis for evaluating company performance, setting incentive compensation targets and planning and forecasting of future periods. This information is not intended to be considered in isolation or as a substitute for financial measures prepared in accordance with GAAP. Tables that reconcile GAAP to non-GAAP disclosure are included in the Appendix. For more information: Kathy MacDonald Vice President – Investor Relations Mead Johnson Nutrition Company 847-832-2182 kathy.macdonald@mjn.com March 2013 |
|
|
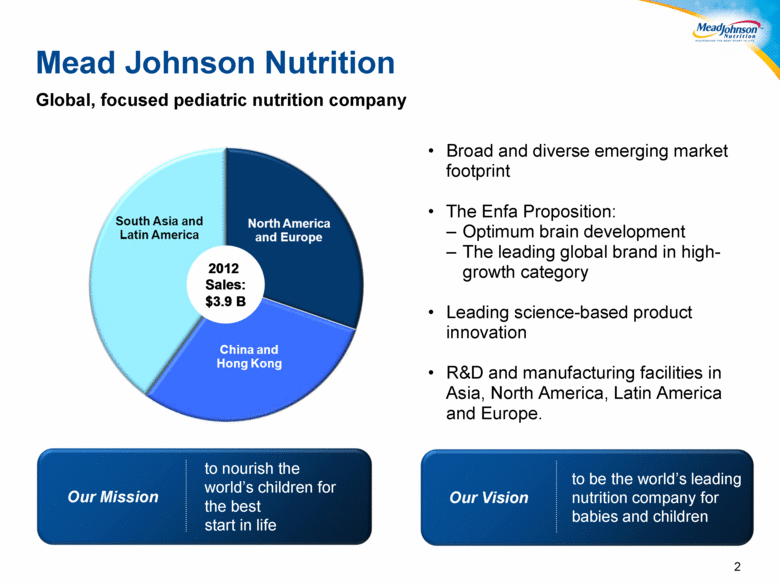
2 2 Broad and diverse emerging market footprint The Enfa Proposition: Optimum brain development The leading global brand in high-growth category Leading science-based product innovation R&D and manufacturing facilities in Asia, North America, Latin America and Europe. Mead Johnson Nutrition Global, focused pediatric nutrition company Our Mission to nourish the world’s children for the best start in life Our Vision to be the world’s leading nutrition company for babies and children 2012 Sales: $3.9 B |
|
|
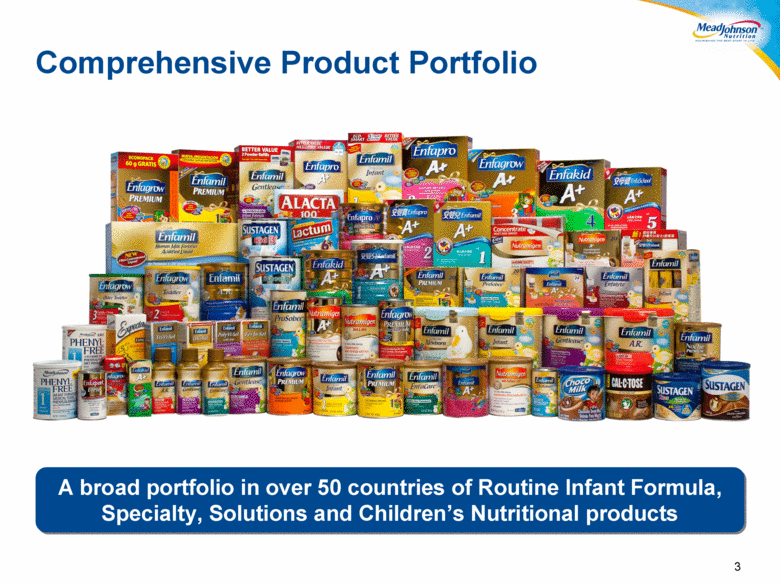
3 3 A broad portfolio in over 50 countries of Routine Infant Formula, Specialty, Solutions and Children’s Nutritional products Comprehensive Product Portfolio |
|
|
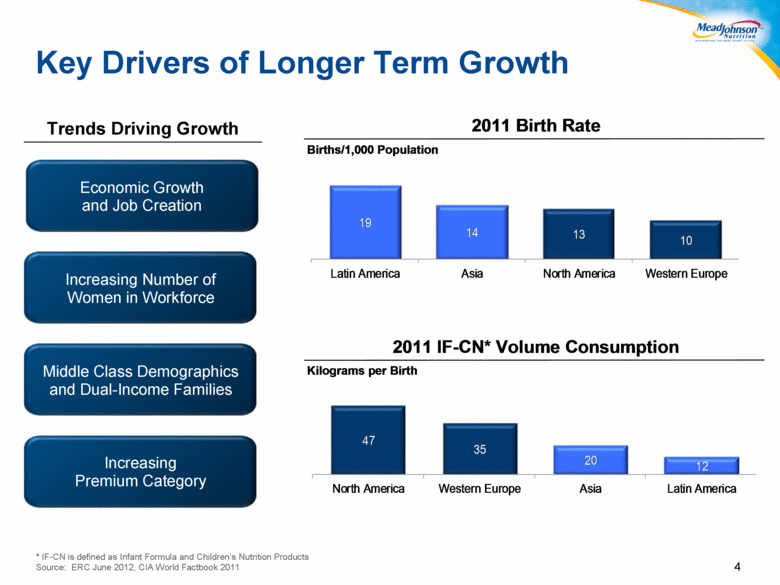
4 Economic Growth and Job Creation Increasing Premium Category Increasing Number of Women in Workforce Middle Class Demographics and Dual-Income Families Key Drivers of Longer Term Growth Trends Driving Growth * IF-CN is defined as Infant Formula and Children’s Nutrition Products Source: ERC June 2012, CIA World Factbook 2011 Kilograms per Birth Births/1,000 Population 19 14 13 10 Latin America Asia North America Western Europe 2011 Birth Rate 2011 IF - CN* Volume Consumption 47 35 20 12 North America Western Europe Asia Latin America |
|
|
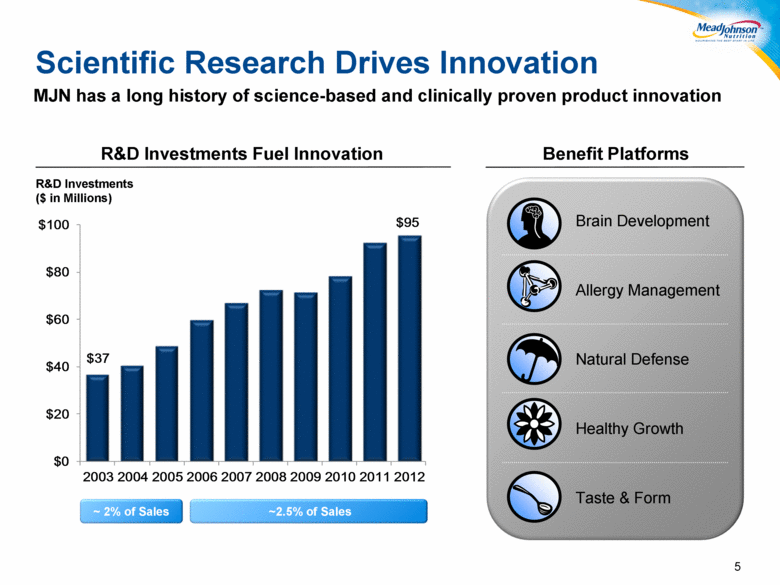
5 Scientific Research Drives Innovation MJN has a long history of science-based and clinically proven product innovation R&D Investments ($ in Millions) ~ 2% of Sales ~2.5% of Sales R&D Investments Fuel Innovation Benefit Platforms Brain Development Allergy Management Natural Defense Healthy Growth Taste & Form $37 $95 $0 $20 $40 $60 $80 $100 2003 2004 2005 2006 2007 2008 2009 2010 2011 2012 |
|
|
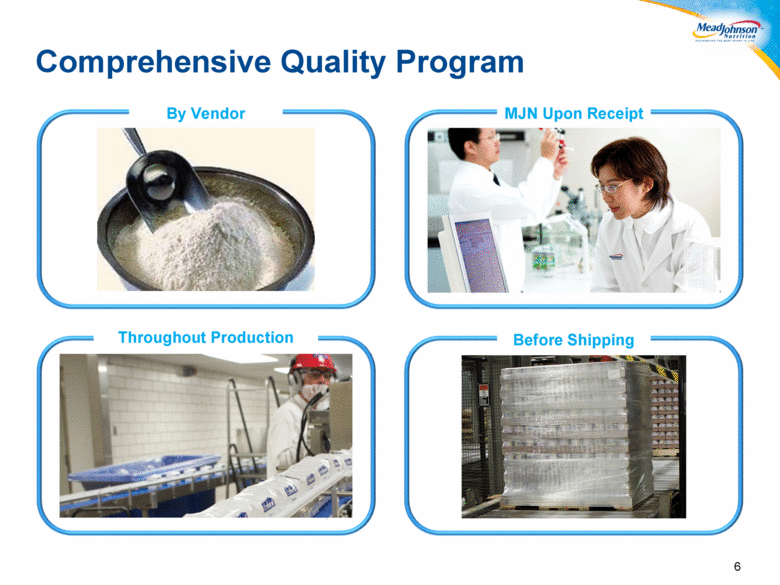
6 By Vendor MJN Upon Receipt Throughout Production Before Shipping Comprehensive Quality Program |
|
|
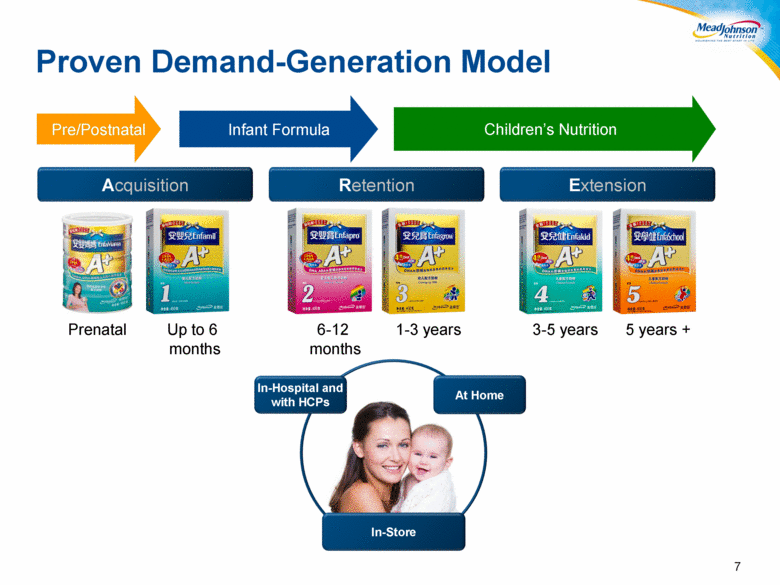
7 Retention Extension In-Store In-Hospital and with HCPs At Home Acquisition Proven Demand-Generation Model Prenatal Up to 6 months 6-12 months 1-3 years 3-5 years 5 years + Pre/Postnatal Infant Formula Children’s Nutrition |
|
|
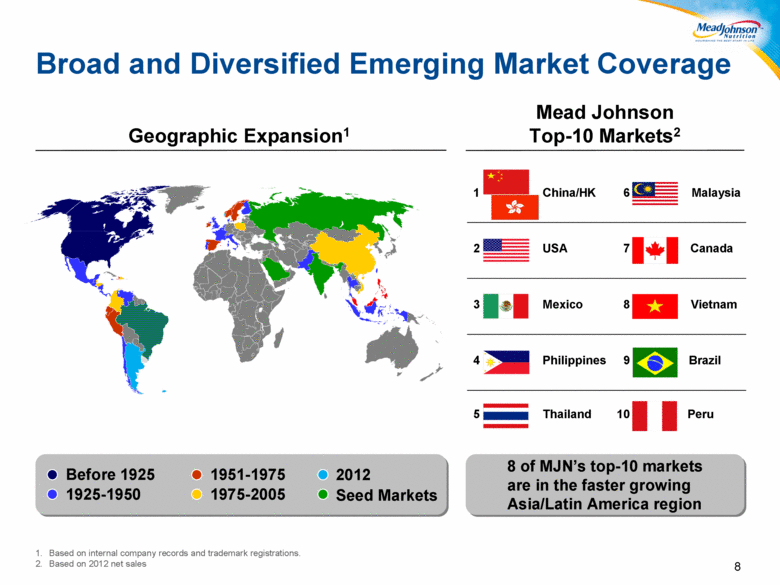
8 Mead Johnson Top-10 Markets2 Based on internal company records and trademark registrations. Based on 2012 net sales 4 Philippines China/HK 1 USA 2 Thailand 5 Mexico 3 9 Brazil 6 Malaysia 7 Canada 10 Peru 8 Vietnam Broad and Diversified Emerging Market Coverage Geographic Expansion1 8 of MJN’s top-10 markets are in the faster growing Asia/Latin America region Before 1925 1925-1950 1951-1975 1975-2005 Seed Markets 2012 |
|
|
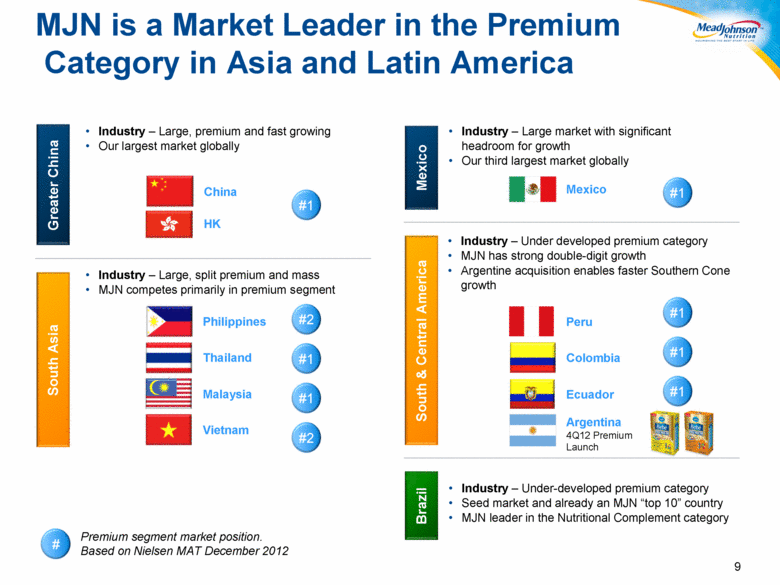
9 MJN is a Market Leader in the Premium Category in Asia and Latin America Industry – Large, premium and fast growing Our largest market globally Industry – Large, split premium and mass MJN competes primarily in premium segment Greater China South Asia Vietnam Thailand Malaysia Philippines HK China Mexico South & Central America Industry – Large market with significant headroom for growth Our third largest market globally Industry – Under developed premium category MJN has strong double-digit growth Argentine acquisition enables faster Southern Cone growth Industry – Under-developed premium category Seed market and already an MJN “top 10” country MJN leader in the Nutritional Complement category Mexico Brazil Peru Ecuador Colombia #1 #1 #1 #1 # Premium segment market position. Based on Nielsen MAT December 2012 #2 #1 #1 #2 #1 Argentina 4Q12 Premium Launch |
|
|
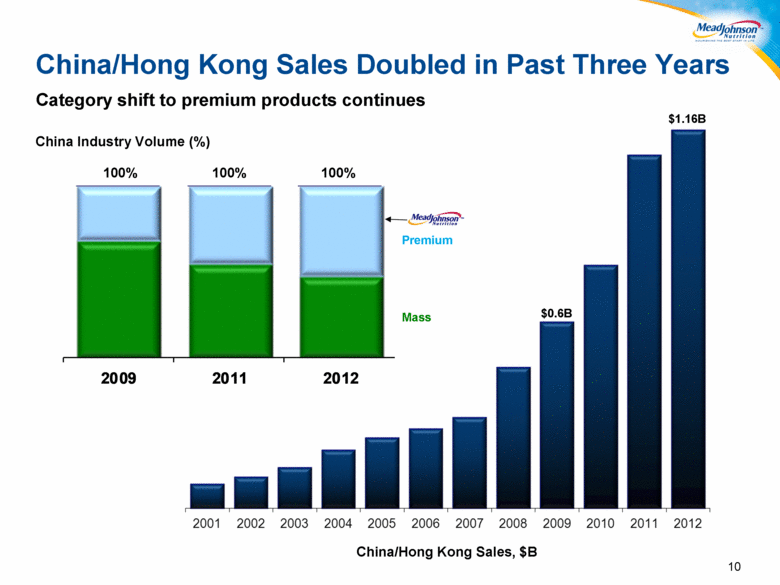
10 10 $1.16B China/Hong Kong Sales, $B $0.6B Premium Mass 100% 100% 100% China/Hong Kong Sales Doubled in Past Three Years China Industry Volume (%) Category shift to premium products continues 2009 2011 2012 |
|
|
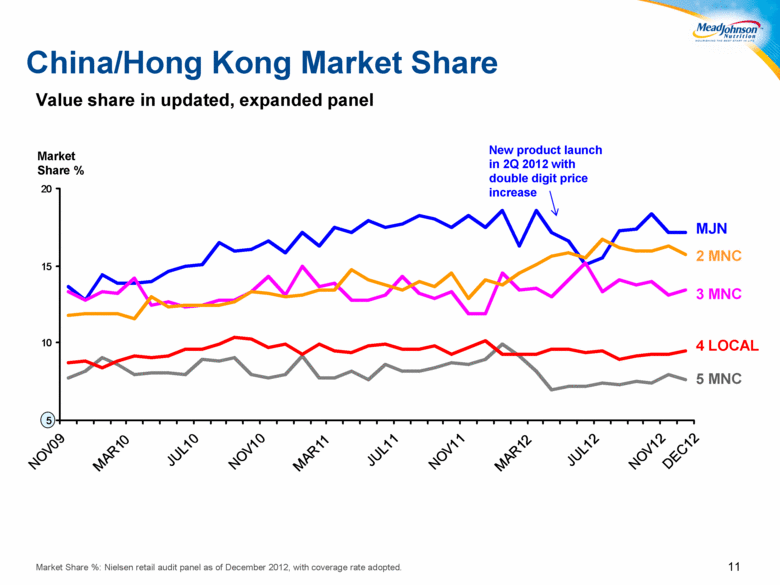
11 China/Hong Kong Market Share Market Share %: Nielsen retail audit panel as of December 2012, with coverage rate adopted. Value share in updated, expanded panel Market Share % 3 MNC 4 LOCAL 2 MNC MJN 5 MNC New product launch in 2Q 2012 with double digit price increase 5 10 15 20 NOV09 MAR10 JUL10 NOV10 MAR11 JUL11 NOV11 MAR12 JUL12 NOV12 DEC12 |
|
|
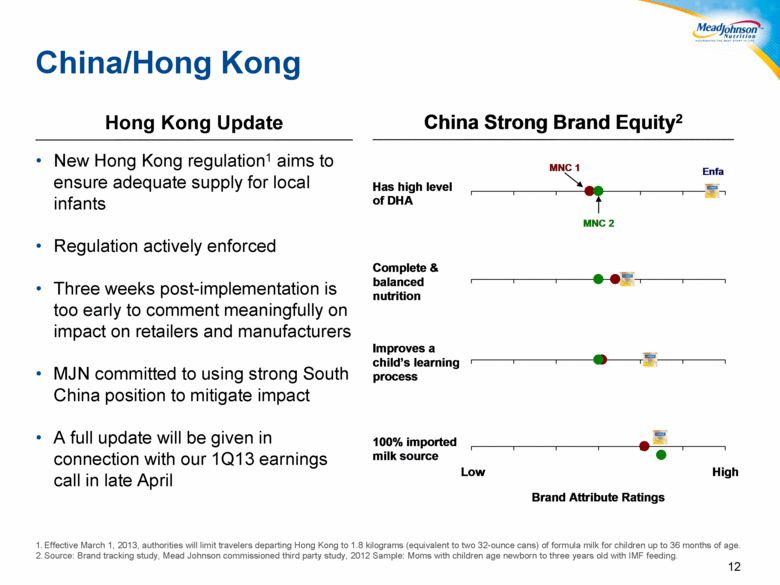
12 China/Hong Kong New Hong Kong regulation1 aims to ensure adequate supply for local infants Regulation actively enforced Three weeks post-implementation is too early to comment meaningfully on impact on retailers and manufacturers MJN committed to using strong South China position to mitigate impact A full update will be given in connection with our 1Q13 earnings call in late April Hong Kong Update Effective March 1, 2013, authorities will limit travelers departing Hong Kong to 1.8 kilograms (equivalent to two 32-ounce cans) of formula milk for children up to 36 months of age. Source: Brand tracking study, Mead Johnson commissioned third party study, 2012 Sample: Moms with children age newborn to three years old with IMF feeding. China Strong Brand Equity 2 Improves a child ’ s learning process 100% imported milk source Complete & balanced nutrition Has high level of DHA MNC 2 MNC 1 Enfa Low High Brand Attribute Ratings |
|
|
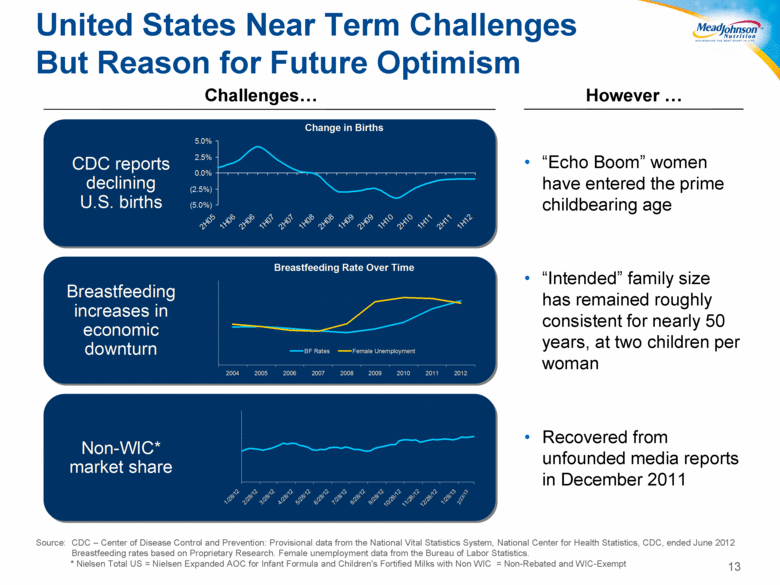
13 13 “Echo Boom” women have entered the prime childbearing age Challenges However United States Near Term Challenges But Reason for Future Optimism Source: CDC – Center of Disease Control and Prevention: Provisional data from the National Vital Statistics System, National Center for Health Statistics, CDC, ended June 2012 Breastfeeding rates based on Proprietary Research. Female unemployment data from the Bureau of Labor Statistics. * Nielsen Total US = Nielsen Expanded AOC for Infant Formula and Children's Fortified Milks with Non WIC = Non-Rebated and WIC-Exempt “Intended” family size has remained roughly consistent for nearly 50 years, at two children per woman Recovered from unfounded media reports in December 2011 CDC reports declining U.S. births (5.0%) (2.5%) 0.0% 2.5% 5.0% 2H05 1H06 2H06 1H07 2H07 1H08 2H08 1H09 2H09 1H10 2H10 1H11 2H11 1H12 Change in Births Breastfeeding increases in economic downturn 2004 2005 2006 2007 2008 2009 2010 2011 2012 BF Rates Female Unemployment Breastfeeding Rate Over Time Non - WIC* market share 1/28/12 2/28/12 3/28/12 4/28/12 5/28/12 6/28/12 7/28/12 8/28/12 9/28/12 10/28/12 11/28/12 12/28/12 1/28/13 2/23/13 |
|
|
14 14 Financial Overview |
|
|
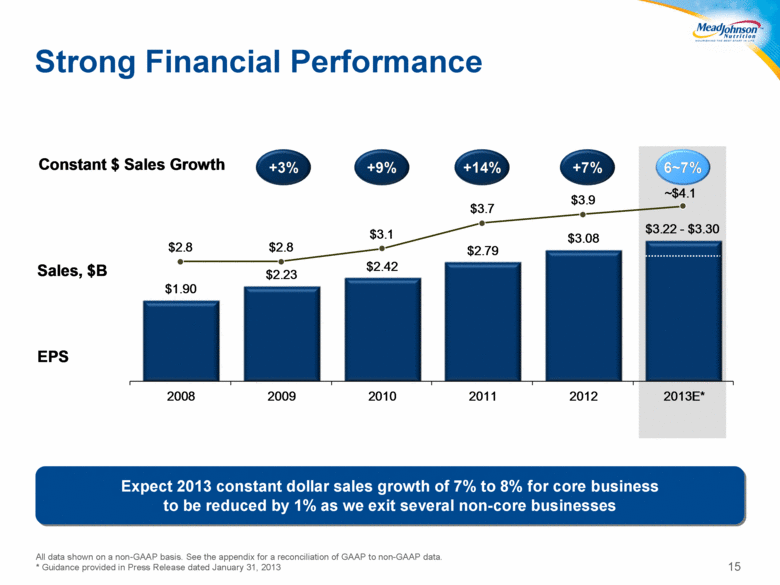
15 Strong Financial Performance All data shown on a non-GAAP basis. See the appendix for a reconciliation of GAAP to non-GAAP data. * Guidance provided in Press Release dated January 31, 2013 Expect 2013 constant dollar sales growth of 7% to 8% for core business to be reduced by 1% as we exit several non-core businesses $1.90 $2.23 $2.42 $2.79 $3.08 $3.22 - $3.30 $2.8 $2.8 $3.1 $3.7 $3.9 ~$4.1 2008 2009 2010 2011 2012 2013E* Sales, $B EPS +9% 6~7% +3% Constant $ Sales Growth +14% +14% +7% +7% |
|
|
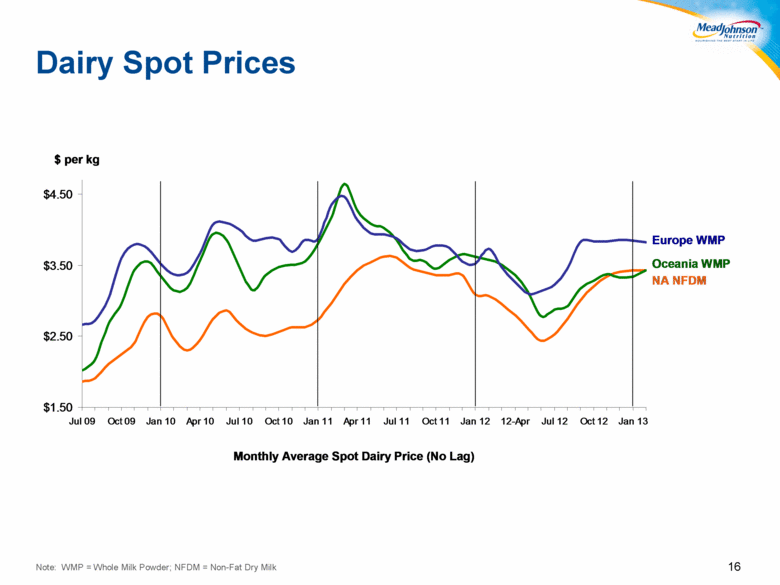
16 Dairy Spot Prices Note: WMP = Whole Milk Powder; NFDM = Non-Fat Dry Milk $1.50 $2.50 $3.50 $4.50 Jul 09 Oct 09 Jan 10 Apr 10 Jul 10 Oct 10 Jan 11 Apr 11 Jul 11 Oct 11 Jan 12 12-Apr Jul 12 Oct 12 Jan 13 $ per kg Monthly Average Spot Dairy Price (No Lag) Europe WMP NA NFDM Oceania WMP |
|
|
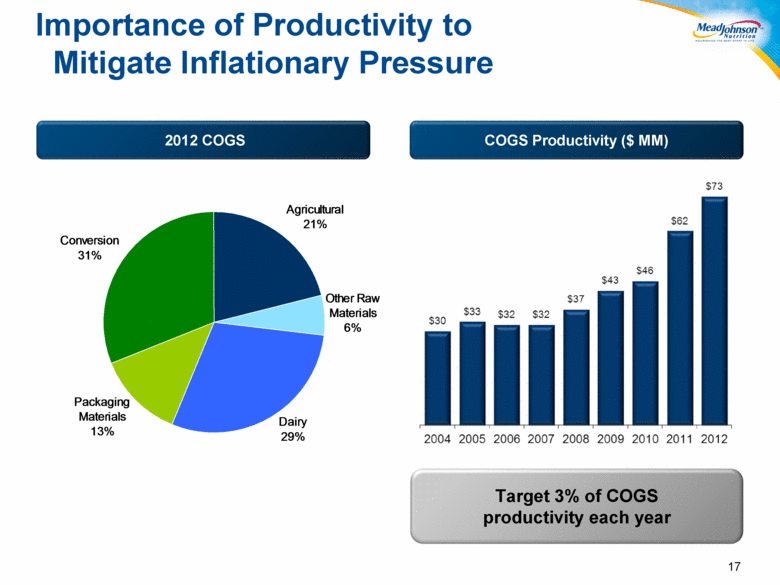
17 COGS Productivity ($ MM) Target 3% of COGS productivity each year 2012 COGS Importance of Productivity to Mitigate Inflationary Pressure |
|
|
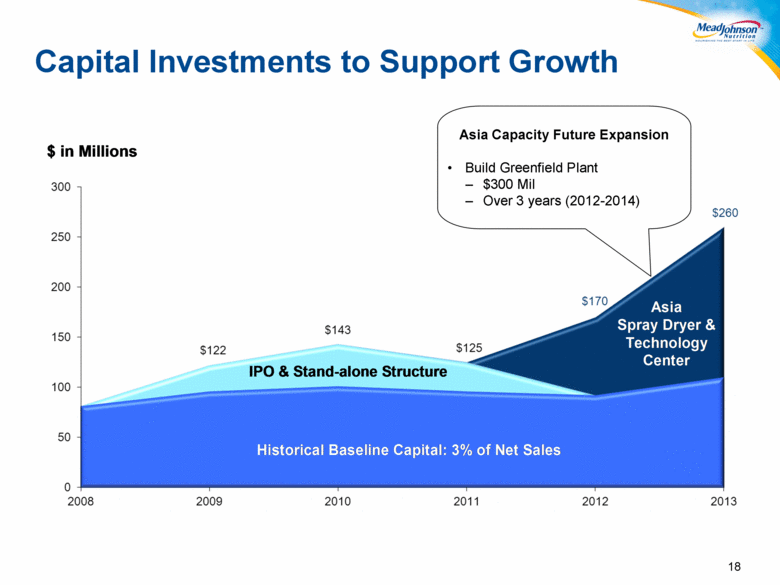
18 Capital Investments to Support Growth Asia Capacity Future Expansion Build Greenfield Plant $300 Mil Over 3 years (2012-2014) $ in Millions Historical Baseline Capital: 3% of Net Sales IPO & Stand - alone Structure Asia Spray Dryer & Technology Center |
|
|
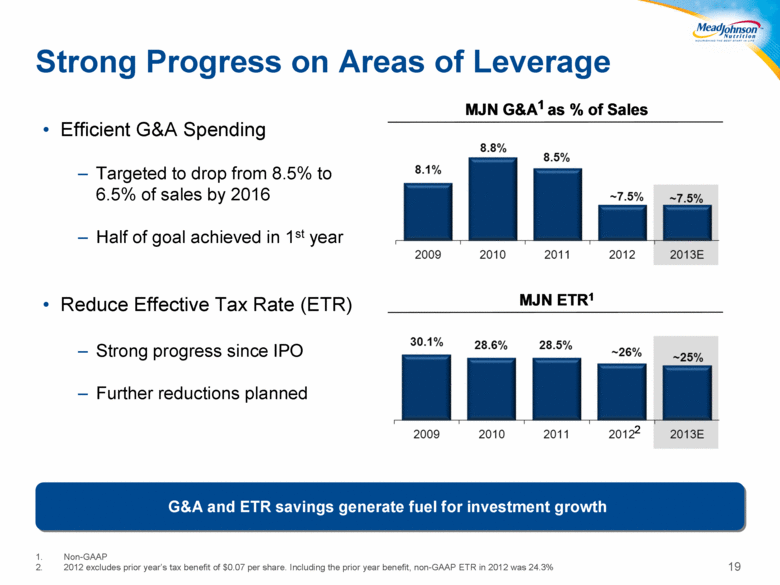
19 Efficient G&A Spending Targeted to drop from 8.5% to 6.5% of sales by 2016 Half of goal achieved in 1st year Reduce Effective Tax Rate (ETR) Strong progress since IPO Further reductions planned Strong Progress on Areas of Leverage Non-GAAP 2012 excludes prior year’s tax benefit of $0.07 per share. Including the prior year benefit, non-GAAP ETR in 2012 was 24.3% G&A and ETR savings generate fuel for investment growth MJN G&A 1 as % of Sales MJN ETR 1 2 |
|
|
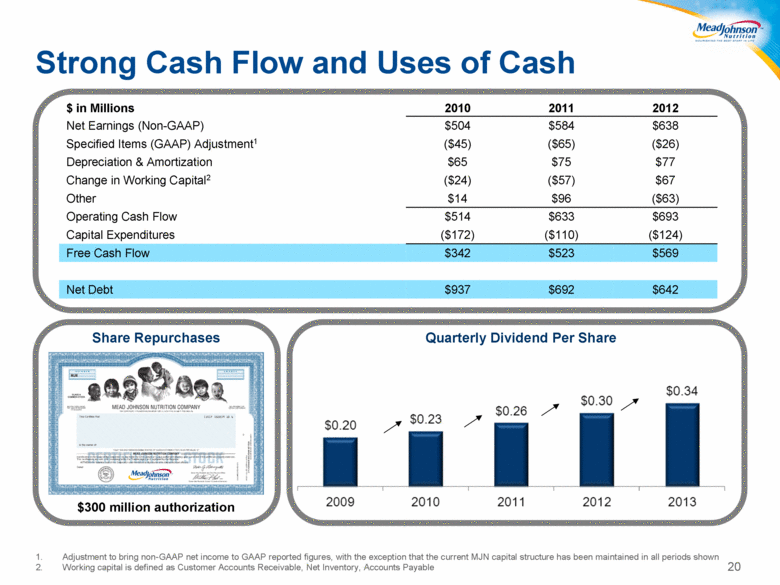
20 Strong Cash Flow and Uses of Cash Share Repurchases $300 million authorization $ in Millions 2010 2011 2012 Net Earnings (Non-GAAP) $504 $584 $638 Specified Items (GAAP) Adjustment1 ($45) ($65) ($26) Depreciation & Amortization $65 $75 $77 Change in Working Capital2 ($24) ($57) $67 Other $14 $96 ($63) Operating Cash Flow $514 $633 $693 Capital Expenditures ($172) ($110) ($124) Free Cash Flow $342 $523 $569 Net Debt $937 $692 $642 Adjustment to bring non-GAAP net income to GAAP reported figures, with the exception that the current MJN capital structure has been maintained in all periods shown Working capital is defined as Customer Accounts Receivable, Net Inventory, Accounts Payable Quarterly Dividend Per Share |
|
|
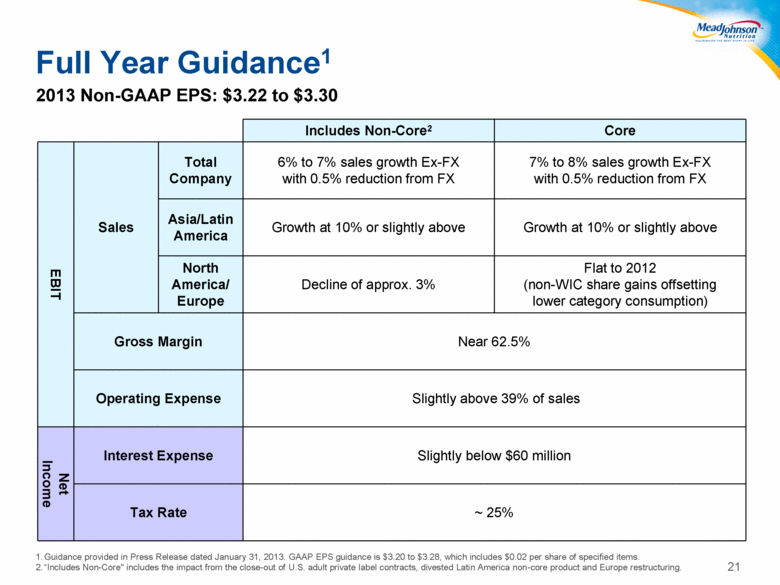
21 Full Year Guidance1 2013 Non-GAAP EPS: $3.22 to $3.30 Includes Non-Core2 Core EBIT Sales Total Company 6% to 7% sales growth Ex-FX with 0.5% reduction from FX 7% to 8% sales growth Ex-FX with 0.5% reduction from FX Asia/Latin America Growth at 10% or slightly above Growth at 10% or slightly above North America/ Europe Decline of approx. 3% Flat to 2012 (non-WIC share gains offsetting lower category consumption) Gross Margin Near 62.5% Operating Expense Slightly above 39% of sales Net Income Interest Expense Slightly below $60 million Tax Rate ~ 25% Guidance provided in Press Release dated January 31, 2013. GAAP EPS guidance is $3.20 to $3.28, which includes $0.02 per share of specified items. “Includes Non-Core" includes the impact from the close-out of U.S. adult private label contracts, divested Latin America non-core product and Europe restructuring. |
|
|
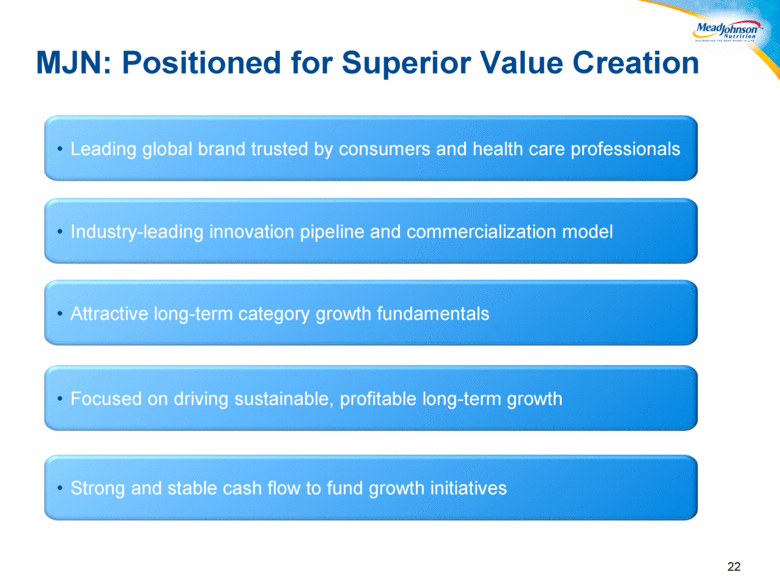
22 MJN: Positioned for Superior Value Creation Leading global brand trusted by consumers and health care professionals Industry-leading innovation pipeline and commercialization model Attractive long-term category growth fundamentals Focused on driving sustainable, profitable long-term growth Strong and stable cash flow to fund growth initiatives |
|
|
23 |
|
|
24 Appendix |
|
|
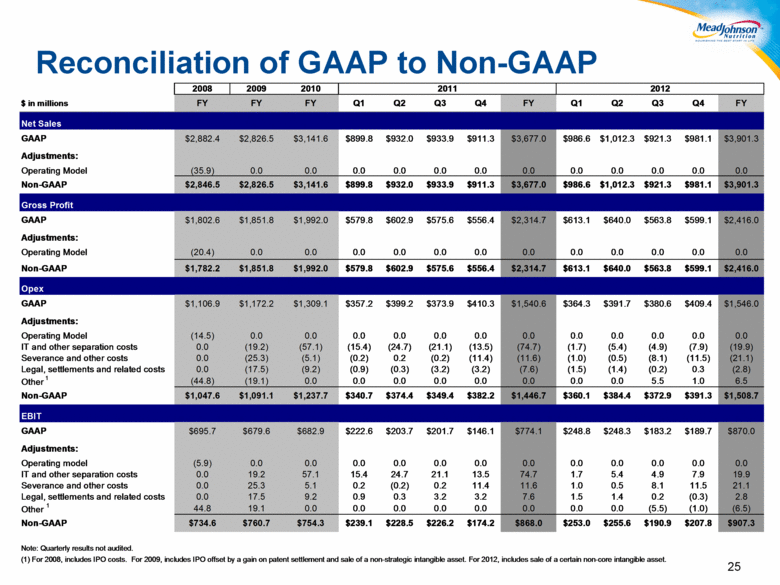
25 Reconciliation of GAAP to Non-GAAP $ in millions FY FY FY Q1 Q2 Q3 Q4 FY Q1 Q2 Q3 Q4 FY Net Sales GAAP $2,882.4 $2,826.5 $3,141.6 $899.8 $932.0 $933.9 $911.3 $3,677.0 $986.6 $1,012.3 $921.3 $981.1 $3,901.3 Adjustments: Operating Model (35.9) 0.0 0.0 0.0 0.0 0.0 0.0 0.0 0.0 0.0 0.0 0.0 0.0 Non-GAAP $2,846.5 $2,826.5 $3,141.6 $899.8 $932.0 $933.9 $911.3 $3,677.0 $986.6 $1,012.3 $921.3 $981.1 $3,901.3 Gross Profit GAAP $1,802.6 $1,851.8 $1,992.0 $579.8 $602.9 $575.6 $556.4 $2,314.7 $613.1 $640.0 $563.8 $599.1 $2,416.0 Adjustments: Operating Model (20.4) 0.0 0.0 0.0 0.0 0.0 0.0 0.0 0.0 0.0 0.0 0.0 0.0 Non-GAAP $1,782.2 $1,851.8 $1,992.0 $579.8 $602.9 $575.6 $556.4 $2,314.7 $613.1 $640.0 $563.8 $599.1 $2,416.0 Opex GAAP $1,106.9 $1,172.2 $1,309.1 $357.2 $399.2 $373.9 $410.3 $1,540.6 $364.3 $391.7 $380.6 $409.4 $1,546.0 Adjustments: Operating Model (14.5) 0.0 0.0 0.0 0.0 0.0 0.0 0.0 0.0 0.0 0.0 0.0 0.0 IT and other separation costs 0.0 (19.2) (57.1) (15.4) (24.7) (21.1) (13.5) (74.7) (1.7) (5.4) (4.9) (7.9) (19.9) Severance and other costs 0.0 (25.3) (5.1) (0.2) 0.2 (0.2) (11.4) (11.6) (1.0) (0.5) (8.1) (11.5) (21.1) Legal, settlements and related costs 0.0 (17.5) (9.2) (0.9) (0.3) (3.2) (3.2) (7.6) (1.5) (1.4) (0.2) 0.3 (2.8) Other 1 (44.8) (19.1) 0.0 0.0 0.0 0.0 0.0 0.0 0.0 0.0 5.5 1.0 6.5 Non-GAAP $1,047.6 $1,091.1 $1,237.7 $340.7 $374.4 $349.4 $382.2 $1,446.7 $360.1 $384.4 $372.9 $391.3 $1,508.7 EBIT GAAP $695.7 $679.6 $682.9 $222.6 $203.7 $201.7 $146.1 $774.1 $248.8 $248.3 $183.2 $189.7 $870.0 Adjustments: Operating model (5.9) 0.0 0.0 0.0 0.0 0.0 0.0 0.0 0.0 0.0 0.0 0.0 0.0 IT and other separation costs 0.0 19.2 57.1 15.4 24.7 21.1 13.5 74.7 1.7 5.4 4.9 7.9 19.9 Severance and other costs 0.0 25.3 5.1 0.2 (0.2) 0.2 11.4 11.6 1.0 0.5 8.1 11.5 21.1 Legal, settlements and related costs 0.0 17.5 9.2 0.9 0.3 3.2 3.2 7.6 1.5 1.4 0.2 (0.3) 2.8 Other 1 44.8 19.1 0.0 0.0 0.0 0.0 0.0 0.0 0.0 0.0 (5.5) (1.0) (6.5) Non-GAAP $734.6 $760.7 $754.3 $239.1 $228.5 $226.2 $174.2 $868.0 $253.0 $255.6 $190.9 $207.8 $907.3 Note: Quarterly results not audited. (1) For 2008, includes IPO costs. For 2009, includes IPO offset by a gain on patent settlement and sale of a non-strategic intangible asset. For 2012, includes sale of a certain non-core intangible asset. 2012 2011 2010 2008 2009 |
|
|
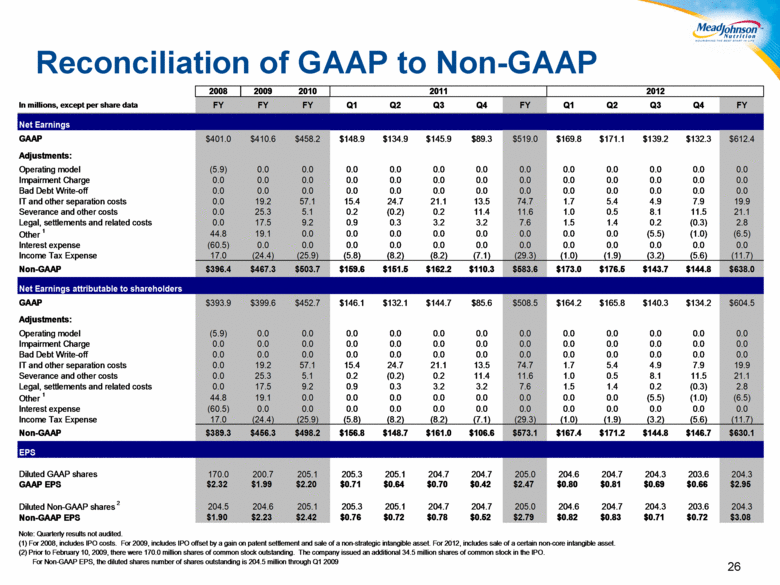
26 Reconciliation of GAAP to Non-GAAP In millions, except per share data FY FY FY Q1 Q2 Q3 Q4 FY Q1 Q2 Q3 Q4 FY Net Earnings GAAP $401.0 $410.6 $458.2 $148.9 $134.9 $145.9 $89.3 $519.0 $169.8 $171.1 $139.2 $132.3 $612.4 Adjustments: Operating model (5.9) 0.0 0.0 0.0 0.0 0.0 0.0 0.0 0.0 0.0 0.0 0.0 0.0 Impairment Charge 0.0 0.0 0.0 0.0 0.0 0.0 0.0 0.0 0.0 0.0 0.0 0.0 0.0 Bad Debt Write-off 0.0 0.0 0.0 0.0 0.0 0.0 0.0 0.0 0.0 0.0 0.0 0.0 0.0 IT and other separation costs 0.0 19.2 57.1 15.4 24.7 21.1 13.5 74.7 1.7 5.4 4.9 7.9 19.9 Severance and other costs 0.0 25.3 5.1 0.2 (0.2) 0.2 11.4 11.6 1.0 0.5 8.1 11.5 21.1 Legal, settlements and related costs 0.0 17.5 9.2 0.9 0.3 3.2 3.2 7.6 1.5 1.4 0.2 (0.3) 2.8 Other 1 44.8 19.1 0.0 0.0 0.0 0.0 0.0 0.0 0.0 0.0 (5.5) (1.0) (6.5) Interest expense (60.5) 0.0 0.0 0.0 0.0 0.0 0.0 0.0 0.0 0.0 0.0 0.0 0.0 Income Tax Expense 17.0 (24.4) (25.9) (5.8) (8.2) (8.2) (7.1) (29.3) (1.0) (1.9) (3.2) (5.6) (11.7) Non-GAAP $396.4 $467.3 $503.7 $159.6 $151.5 $162.2 $110.3 $583.6 $173.0 $176.5 $143.7 $144.8 $638.0 GAAP $393.9 $399.6 $452.7 $146.1 $132.1 $144.7 $85.6 $508.5 $164.2 $165.8 $140.3 $134.2 $604.5 Adjustments: Operating model (5.9) 0.0 0.0 0.0 0.0 0.0 0.0 0.0 0.0 0.0 0.0 0.0 0.0 Impairment Charge 0.0 0.0 0.0 0.0 0.0 0.0 0.0 0.0 0.0 0.0 0.0 0.0 0.0 Bad Debt Write-off 0.0 0.0 0.0 0.0 0.0 0.0 0.0 0.0 0.0 0.0 0.0 0.0 0.0 IT and other separation costs 0.0 19.2 57.1 15.4 24.7 21.1 13.5 74.7 1.7 5.4 4.9 7.9 19.9 Severance and other costs 0.0 25.3 5.1 0.2 (0.2) 0.2 11.4 11.6 1.0 0.5 8.1 11.5 21.1 Legal, settlements and related costs 0.0 17.5 9.2 0.9 0.3 3.2 3.2 7.6 1.5 1.4 0.2 (0.3) 2.8 Other 1 44.8 19.1 0.0 0.0 0.0 0.0 0.0 0.0 0.0 0.0 (5.5) (1.0) (6.5) Interest expense (60.5) 0.0 0.0 0.0 0.0 0.0 0.0 0.0 0.0 0.0 0.0 0.0 0.0 Income Tax Expense 17.0 (24.4) (25.9) (5.8) (8.2) (8.2) (7.1) (29.3) (1.0) (1.9) (3.2) (5.6) (11.7) Non-GAAP $389.3 $456.3 $498.2 $156.8 $148.7 $161.0 $106.6 $573.1 $167.4 $171.2 $144.8 $146.7 $630.1 EPS Diluted GAAP shares 170.0 200.7 205.1 205.3 205.1 204.7 204.7 205.0 204.6 204.7 204.3 203.6 204.3 GAAP EPS $2.32 $1.99 $2.20 $0.71 $0.64 $0.70 $0.42 $2.47 $0.80 $0.81 $0.69 $0.66 $2.95 Diluted Non-GAAP shares 2 204.5 204.6 205.1 205.3 205.1 204.7 204.7 205.0 204.6 204.7 204.3 203.6 204.3 Non-GAAP EPS $1.90 $2.23 $2.42 $0.76 $0.72 $0.78 $0.52 $2.79 $0.82 $0.83 $0.71 $0.72 $3.08 Note: Quarterly results not audited. (1) For 2008, includes IPO costs. For 2009, includes IPO offset by a gain on patent settlement and sale of a non-strategic intangible asset. For 2012, includes sale of a certain non-core intangible asset. (2) Prior to February 10, 2009, there were 170.0 million shares of common stock outstanding. The company issued an additional 34.5 million shares of common stock in the IPO. For Non-GAAP EPS, the diluted shares number of shares outstanding is 204.5 million through Q1 2009 2012 2011 2010 Net Earnings attributable to shareholders 2008 2009 |
|
|
27 |

