Attached files
| file | filename |
|---|---|
| 8-K - FORM 8-K - Gramercy Property Trust Inc. | v338593_8k.htm |
| EX-99.1 - EXHIBIT 99.1 - Gramercy Property Trust Inc. | v338593_ex99-1.htm |

Business Plan Update March 19, 2013
Cautionary Note Regarding Forward - Looking Information This investment presentation contains "forward - looking statements" based upon the Company's current best judgment and expectations . You can identify forward - looking statements by the use of forward - looking expressions such as “may,” “will,” “should,” “expect,” “believe,” “anticipate,” “estimate,” “intend,” “plan,” “project,” “continue,” or any negative or other variations on such expressions . Forward - looking statements include information concerning possible or assumed future results of the Company's operations, including any forecasts, projections, plans and objectives for future operations . Although the Company believes that its plans, intentions and expectations as reflected in or suggested by those forward - looking statements are reasonable, the Company can give no assurance that the plans, intentions or expectations will be achieved . The Company has listed below some important risks, uncertainties and contingencies which could cause its actual results, performance or achievements to be materially different from the forward - looking statements it makes in this presentation . These risks, uncertainties and contingencies include, but are not limited to, the following : the success or failure of the Company's efforts to implement its Company's current business strategy ; the Company's ability to identify and complete additional property acquisitions and risks of real estate acquisitions ; availability of investment opportunities on real estate assets and real estate - related and other securities ; the performance and financial condition of tenants and corporate customers ; the adequacy of the Company's cash reserves, working capital and other forms of liquidity ; the availability, terms and deployment of short - term and long - term capital ; demand for office and industrial space ; the actions of the Company's competitors and ability to respond to those actions ; the timing of cash flows from the Company's investments ; the cost and availability of the Company's financings, which depends in part on the Company's asset quality, the nature of the Company's relationships with its lenders and other capital providers, the Company's business prospects and outlook and general market conditions ; the continuity of the management agreement for the KBS portfolio ; economic conditions generally and in the commercial finance and real estate markets and the banking industry specifically ; unanticipated increases in financing and other costs, including a rise in interest rates ; the Company's ability to maintain its current relationships with financial institutions and to establish new relationships with additional financial institutions ; reduction in cash flows received from the Company's investments, in particular its CDOs ; the Company's ability to profitably dispose of non - core assets ; availability of, and ability to retain, qualified personnel and directors ; changes to the Company's management and board of directors ; changes in governmental regulations, tax rates and similar matters ; legislative and regulatory changes (including changes to laws governing the taxation of REITs or the exemptions from registration as an investment company) ; environmental and/or safety requirements ; the Company's ability to satisfy complex rules in order for it to qualify as a REIT, for federal income tax purposes and qualify for the Company's exemption under the Investment Company Act, the Company's operating partnership’s ability to satisfy the rules in order for it to qualify as a partnership for federal income tax purposes, and the ability of certain of the Company's subsidiaries to qualify as REITs and certain of the Company's subsidiaries to qualify as TRSs for federal income tax purposes, and the Company's ability and the ability of its subsidiaries to operate effectively within the limitations imposed by these rules ; the continuing threat of terrorist attacks on the national, regional and local economies ; and other factors discussed under Item 1 A, “Risk Factors” of the Company's Annual Report on Form 10 - K for the year ended December 31 , 2012 . The Company assumes no obligation to update publicly any forward - looking statements, whether as a result of new information, future events, or otherwise . In evaluating forward - looking statements, you should consider these risks and uncertainties, together with the other risks described from time - to - time in the Company's reports and documents which are filed with the SEC, and you should not place undue reliance on those statements . The risks included here are not exhaustive . Other sections of this report may include additional factors that could adversely affect the Company's business and financial performance . Moreover, the Company operates in a very competitive and rapidly changing environment . New risk factors emerge from time to time and it is not possible for management to predict all such risk factors, nor can it assess the impact of all such risk factors on the Company's business or the extent to which any factor, or combination of factors, may cause actual results to differ materially from those contained in any forward - looking statements . Given these risks and uncertainties, investors should not place undue reliance on forward - looking statements as a prediction of actual results . Forward - Looking Information 2

Business Plan – 2013 - 2015 • Sell CDOs • Invest cash to create recurring cash flow • Maximize Gramercy Asset Management profit center • Significantly reduce MG&A • Grow equity base • Streamline business, simplify story • Create durable, growing dividends 3

SELL CDOs
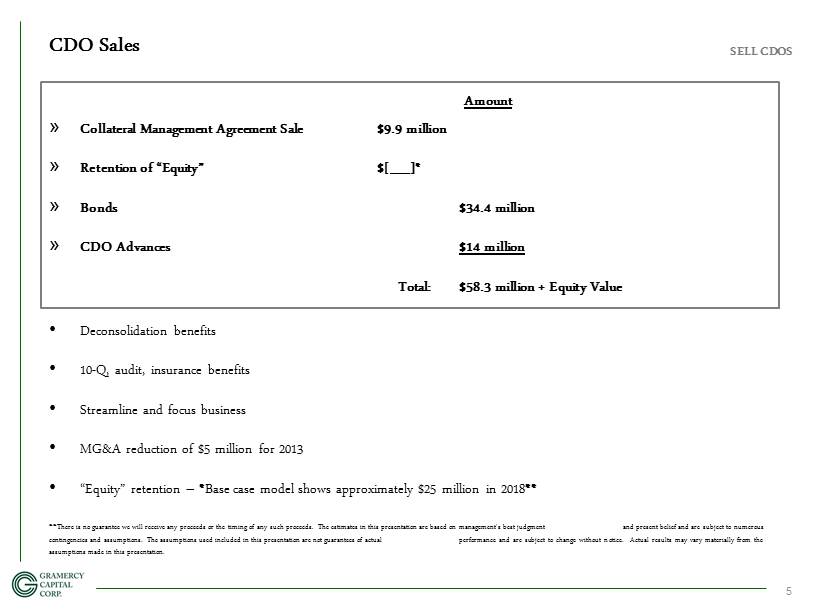
Amount » Collateral Management Agreement Sale $9.9 million » Retention of “Equity” $[__]* » Bonds $34.4 million » CDO Advances $14 million Total: $58.3 million + Equity Value • Deconsolidation benefits • 10 - Q, audit, insurance benefits • Streamline and focus business • MG&A reduction of $5 million for 2013 • “Equity” retention – * Base case model shows approximately $25 million in 2018 ** SELL CDOS CDO Sales 5 ** There is no guarantee we will receive any proceeds or the timing of any such proceeds . The estimates in this presentation are based on management's best judgment and present belief and are subject to numerous contingencies and assumptions . The assumptions used included in this presentation are not guarantees of actual performance and are subject to change without notice . Actual results may vary materially from the assumptions made in this presentation .

SELL CDOS As Adjusted Balance Sheet (As of 3/31/13) 6 (Unaudited, amounts in thousands) Assets: Total real estate investments $ 27,060 $ 202,621 (1) Cash and cash equivalents (including restricted cash) 143,458 (2) 143,458 (2) Investments in Joint Ventures 75,771 210 Advances due from CDOs 13,600 13,600 Assets held for sale - - Other assets - - Total Assets $ 259,889 $ 359,889 Liabilities: Total secured and other debt $ - $ 100,000 (3) Accounts payable and accrued expenses - - Other liabilities - - Total Liabilities $ - $ 100,000 Equity / (Deficit): Common stock 61 61 Preferred stock 88,146 88,146 Preferred stock - accrued dividends 32,228 32,228 Accumulated retained earnings and additional paid in capital 139,455 139,455 Total Equity $ 259,889 $ 259,889 Total Liabilities and Equity $ 259,889 $ 359,889 Notes: (1) Includes the Bank of America portfolio joint venture assets (2) Includes the proceeds from the sale of the CDO Management Agreement and from the sale of the CDO bonds (3) Represents the GKK share of debt in the Bank of America portfolio joint venture Includes accounts of BofA JV As Adjusted As Further

INVEST CASH TO CREATE RECURRING CASH FLOWS
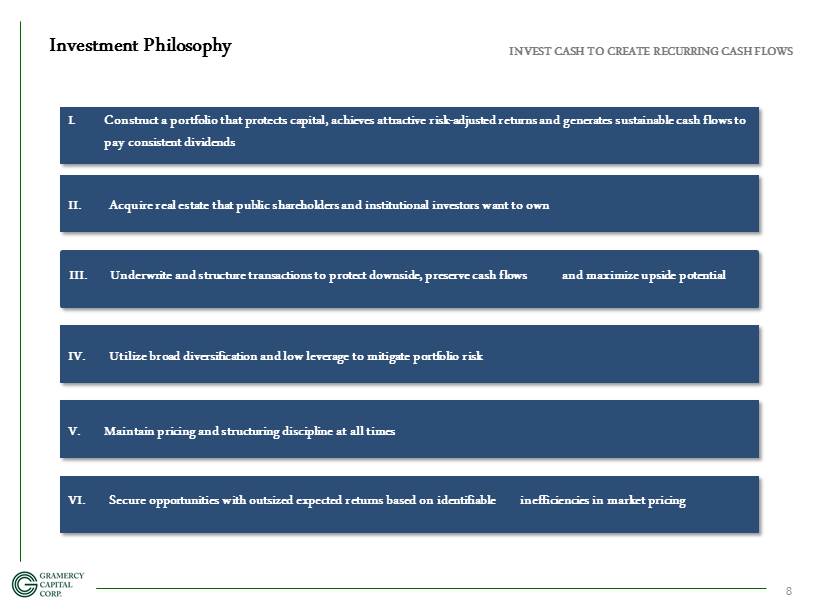
INVEST CASH TO CREATE RECURRING CASH FLOWS Investment Philosophy 8 I. Construct a portfolio that protects capital, achieves attractive risk - adjusted returns and generates sustainable cash flows to pay consistent dividends III. Underwrite and structure transactions to protect downside, preserve cash flows and maximize upside potential VI. Secure opportunities with outsized expected returns based on identifiable inefficiencies in market pricing V. Maintain pricing and structuring discipline at all times IV. Utilize broad diversification and low leverage to mitigate portfolio risk II. Acquire real estate that public shareholders and institutional investors want to own

Acquire primarily office and industrial properties in “Target Markets” with strong demographic and economic growth and high quality infrastructure Target Markets - Locations 9 Target Markets • Los Angeles • Inland Empire • Miami • Seattle • S.F./Bay Area • Houston • Dallas • Chicago • Phoenix • Las Vegas • Indianapolis • DC/Baltimore • New York/ New Jersey • Savannah • Austin (office) • Atlanta • Jacksonville • Memphis • Kansas City INVEST CASH TO CREATE RECURRING CASH FLOWS

• Primarily industrial and office net lease company • Single tenant retail is the most competitive segment with the least attractive risk/return profile today INVEST CASH TO CREATE RECURRING CASH FLOWS Gramercy Focus 10 Cap Rates as of Q4 2012 Retail Office Industrial Source: The Boulder Group 7.25% 8.04% 8.15% 6.75% 7.25% 7.75% 8.25% 8.75% Net Lease Cap Rate Trends Retail Office Industrial

The Gramercy Investment team is constantly refreshing its transaction pipeline from its existing relationships across the net lease industry INVEST CASH TO CREATE RECURRING CASH FLOWS Current Pipeline 11 Real Estate Brokers Regular flow of brokered net lease deals from national network of brokers $450MM Corporate Relationships Tap network of corporate real estate users for sale - leaseback and build - to - suit opportunities $190MM Other Deals from other Gramercy relationships $60MM Portfolio Deals Pursue larger portfolio deals expecting to use a mix of stock/cash $500 MM PE Sponsors Tap network of PE sponsors for sale - leaseback opportunities $330MM $1.5+ billion of current pipeline transactions

Capability » Invested in 117 properties * totaling $564 million closed in Q4 2012/Q1 2013 » Sold 93 properties totaling $408 million in 2012 Experience » 20+ years average real estate experience among top executives » Led by Gordon DuGan – 25 years of experience Former CEO of W.P. Carey & Co. » Approximately $5 billion of net lease experience Relationships » Cultivated relationship with various constituents in net lease world for over 2 decades » “First - call” with many companies, advisors, brokers and private equity firms for sale - leasebacks Deal Flow » See almost everything » Ability to move fast, reputation for closing quickly and on - terms » Quantitative underwriting model allows Gramercy to evaluate best opportunities from a risk/return standpoint INVEST CASH TO CREATE RECURRING CASH FLOWS Gramercy Transaction Capability 12 * Directly or in joint venture

» Reviewed > $5 billion » Activity > $2 billion, >100 transactions » Closed * > 8 transactions, 125 properties, $580 million INVEST CASH TO CREATE RECURRING CASH FLOWS Gramercy Disciplined Underwriting 13 * Expected closings through March 31 , 2013 . There is no guarantee that a transaction will close or will close on terms favorable to the Company . The estimates made in this presentation are based on management's best judgment and present belief and are subject to numerous contingencies and assumptions . Actual results may vary materially from the assumptions presented in this presentation .

Adjusted As of March 31, 2013* ⁻ $ 20 million of Core Real Estate NOI ⁻ $285 million of Core Real Estate @ 7% cap ⁻ 98% occupancy ⁻ 10.1 - year average lease term ⁻ > 70 % investment grade tenancy ⁻ 4.4 million sq. ft. office ⁻ 1.5 million sq. ft. industrial ⁻ Sold: Whiteface Lodge, Makalei and AFR back to CDOs, saving $5.1 million per year in cash drag ⁻ For Sale: Gramercy’s $ 25 - 30 million interest in the value - add BofA joint venture properties that are being sold INVEST CASH TO CREATE RECURRING CASH FLOWS Gramercy Portfolio 14 * Adjusted for Gramercy’s portion of joint ventures deals . There is no guarantee that a transaction will close or will close on terms favorable to the Company . The estimates made in this presentation are based on management's best judgment and present belief and are subject to numerous contingencies and assumptions . Actual results may vary materially from the assumptions presented in this presentation .
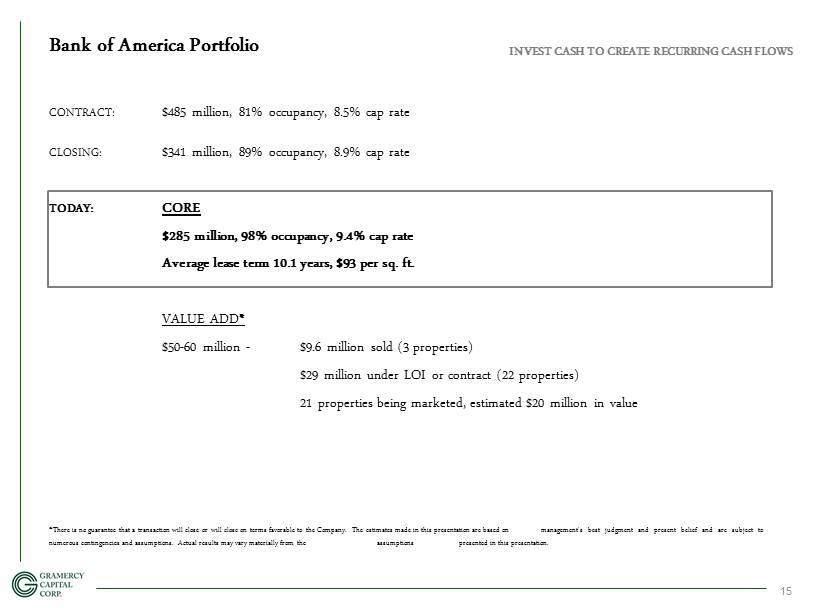
CONTRACT: $485 million, 81% occupancy, 8.5% cap rate CLOSING: $341 million, 89% occupancy, 8.9% cap rate TODAY: CORE $285 million, 98% occupancy, 9.4% cap rate Average lease term 10.1 years, $93 per sq. ft. VALUE ADD * $50 - 60 million - $9.6 million sold (3 properties) $29 million under LOI or contract (22 properties) 21 properties being marketed, estimated $20 million in value INVEST CASH TO CREATE RECURRING CASH FLOWS Bank of America Portfolio 15 * There is no guarantee that a transaction will close or will close on terms favorable to the Company . The estimates made in this presentation are based on management's best judgment and present belief and are subject to numerous contingencies and assumptions . Actual results may vary materially from the assumptions presented in this presentation .
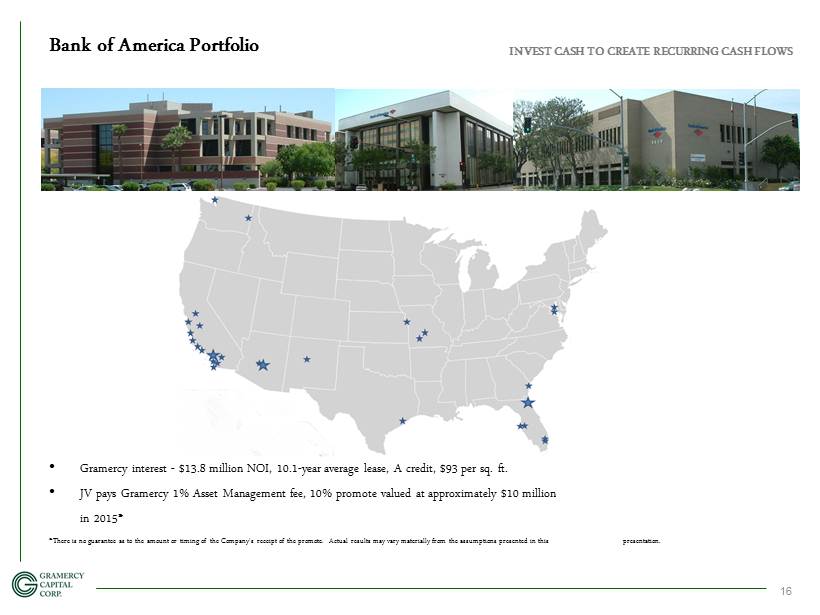
• Gramercy interest - $13.8 million NOI, 10.1 - year average lease, A credit, $93 per sq. ft. • JV pays Gramercy 1% Asset Management fee, 10% promote valued at approximately $10 million in 2015 * INVEST CASH TO CREATE RECURRING CASH FLOWS Bank of America Portfolio 16 * There is no guarantee as to the amount or timing of the Company's receipt of the promote . Actual results may vary materially from the assumptions presented in this presentation .
• $27.1 million ($50 per sq. ft.) • 540,000 sq. ft., 2 class A building, built in 2008 • 100% occupied » Nestlé Waters, a subsidiary of Nestl é (S&P: AA) (50% ) » Stanley Security Systems, a subsidiary of Black & Decker (S&P: A) (34%) » Privately held medical supply company (16%) • 10.2 - year average lease term • Cap rate of 8.36% • $14.5 million financing term sheet with Northwestern Mutual at 3.28% fixed for five years • > 13% ROE INVEST CASH TO CREATE RECURRING CASH FLOWS Indianapolis Industrial 17
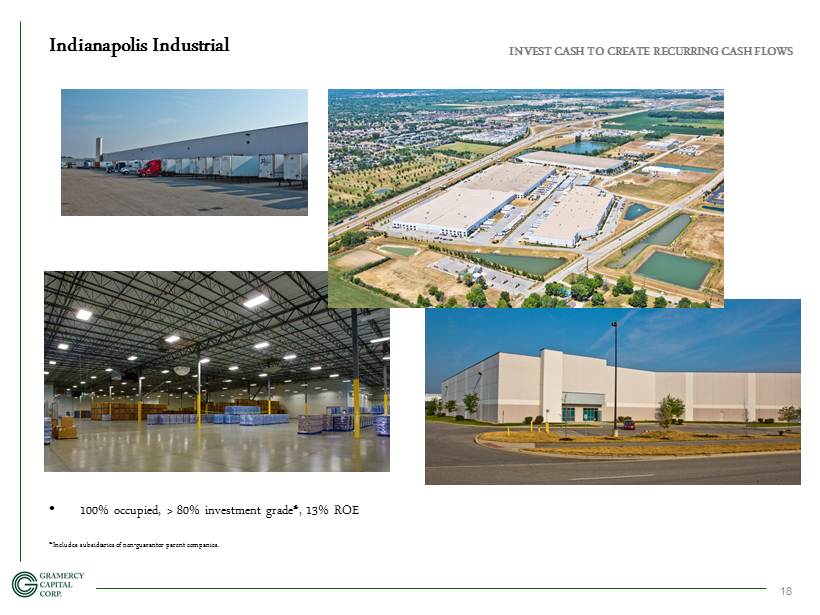
• 100% occupied, > 80% investment grade * , 13% ROE * Includes subsidiaries of non - guarantor parent companies. INVEST CASH TO CREATE RECURRING CASH FLOWS Indianapolis Industrial 18
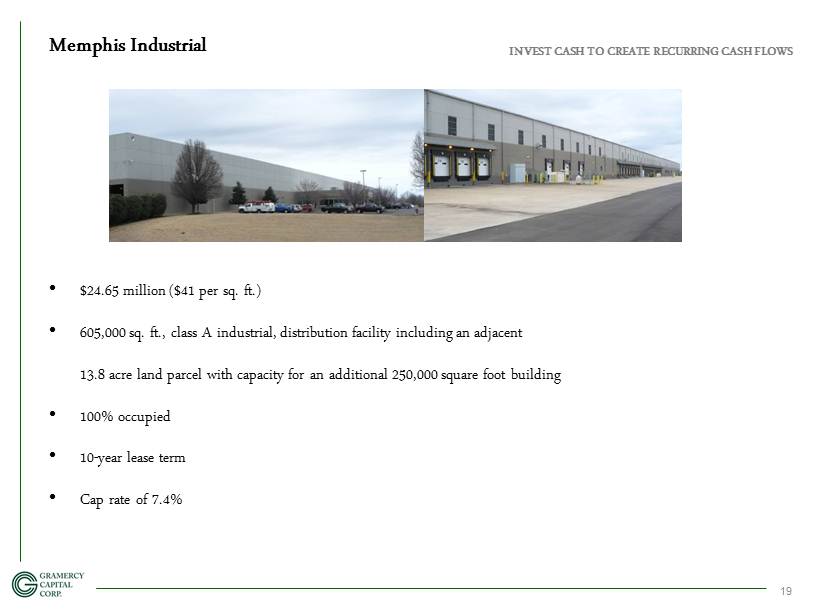
• $24.65 million ($41 per sq. ft.) • 605,000 sq. ft., class A industrial, distribution facility including an adjacent 13.8 acre land parcel with capacity for an additional 250,000 square foot building • 100 % occupied • 10 - year lease term • Cap rate of 7.4% INVEST CASH TO CREATE RECURRING CASH FLOWS Memphis Industrial 19

• 5 investments, approximately $51 million » 7.5% cap rate » 11 - year average lease term • Pipeline - $84 million in contract » 9.6% cap rate » 19 - year average lease term • LOI’s - > $500 million • Reviewing - > $1 billion INVEST CASH TO CREATE RECURRING CASH FLOWS Q1 Investment Activity* 20 * There is no guarantee that a transaction will close or will close on terms favorable to the Company . The estimates made in this presentation are based on management's best judgment and present belief and are subject to numerous contingencies and assumptions . Actual results may vary materially from the assumptions presented in this presentation .

• $1.5 - $2.0 trillion of U.S. real estate owned by corporate owner - occupiers * • Growth of Net Lease REIT’s provides capital for companies to off - load owned real estate • Lack of significant activity over the past five years in the sale - leaseback market relative to pre - crisis time, potential pent - u p supply • Analogy to Healthcare REIT’s INVEST CASH TO CREATE RECURRING CASH FLOWS Net Lease Macro Trends 21 “ To us, this space is reminiscent of the healthcare REIT sector’s growth over the past 10 years – both are primarily yield - focused companies in fragmented industries that have seen tremendous growth and consolidation . ” Joshua Barber, Stifel Nicolaus & Co., Inc., March 8, 2013 * Source: Rosen Consulting Group market study
MAXIMIZE ASSET MANAGEMENT PROFIT CENTER

• Gramercy - 94 employees today • Gramercy Finance/CDO Management – 12 employees • Gramercy Asset Management – 59 current employees MAXIMIZE ASSET MANAGEMENT PROFIT CENTER Asset Management 23 * This is not a guarantee of future performance . The estimates in this presentation are based on management’s best judgment and present belief and are subject to numerous contingencies and assumptions . Actual results may differ materially from management's estimates of the Company's performance . Estimated 2013 REVENUE Asset Management Revenue 10,500,000$ Property Management Revenue 6,300,000$ TOTAL REVENUES 16,800,000$ EXPENSES TOTAL EXPENSES (11,100,000)$ Net Contribution 5,700,000$ *

» Asset Management subsidizes Gramercy MG&A while cash is converted into income - producing real estate » Asset Management source of Gramercy’s capability to close many transactions quickly » Asset Management source of investment opportunities – Bank of America Portfolio – Wells Fargo Portfolio – An option on 5 assets totaling approximately $30 million MAXIMIZE ASSET MANAGEMENT PROFIT CENTER Asset Management 24

SIGNIFICANTLY REDUCE MANAGEMENT, GENERAL & ADMINISTRATIVE (MG&A)
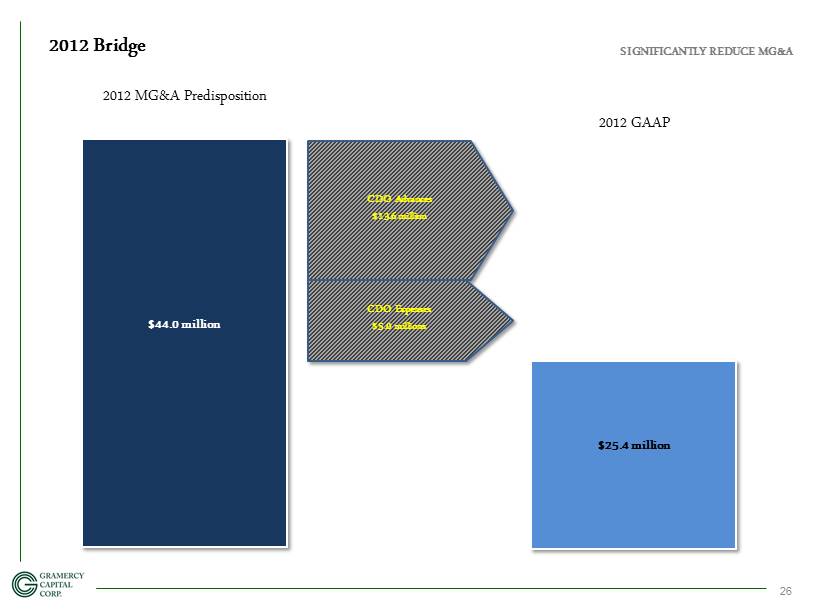
SIGNIFICANTLY REDUCE MG&A 2012 Bridge 26 $44.0 million 2012 GAAP 2012 MG&A Predisposition $25.4 million CDO Advances $13.6 million CDO Expenses $ 5 .0 millions

SIGNIFICANTLY REDUCE MG&A 2013 Bridge 27 $25.4 million $13.1 million 2012 GAAP 2013 Core MG&A Asset Management MG&A $5.2 million Insurance, Legal, Accounting, Rent, IT, etc. $3.0 million Project Glacier $2.6 million Executive & Senior Level Compensation $1.5 million

• Existing Core MG&A will provide a platform for growth of business in 2014 and beyond • In the absence of any growth opportunities, Gramercy Core MG&A could be reduced to approximately $10 - $11 million for 2014 primarily through: – $2.5 million personnel reduction – $0.5 million professional fees/information technology (IT) reduction SIGNIFICANTLY REDUCE MG&A 2014 28
GROW EQUITY BASE
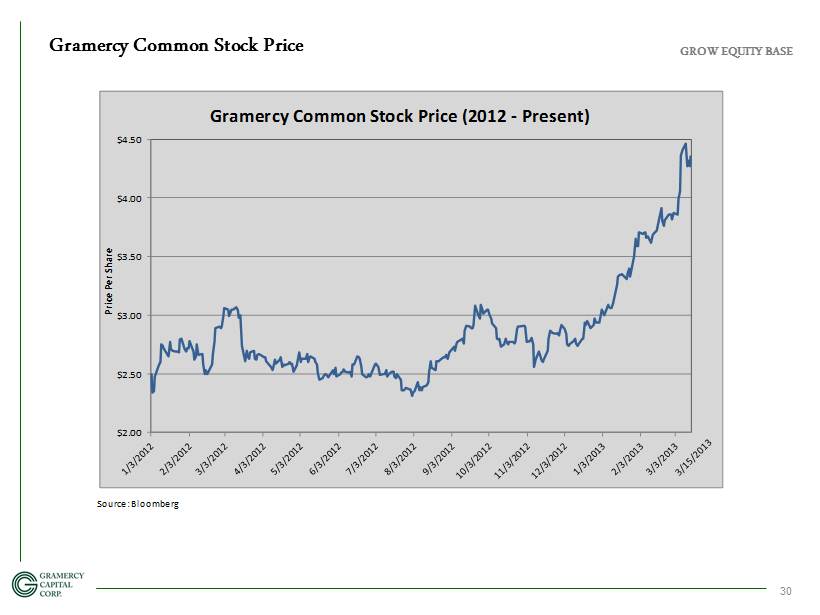
GROW EQUITY BASE Gramercy Common Stock Price 30 Source: Bloomberg $2.00 $2.50 $3.00 $3.50 $4.00 $4.50 Price Per Share Gramercy Common Stock Price (2012 - Present)
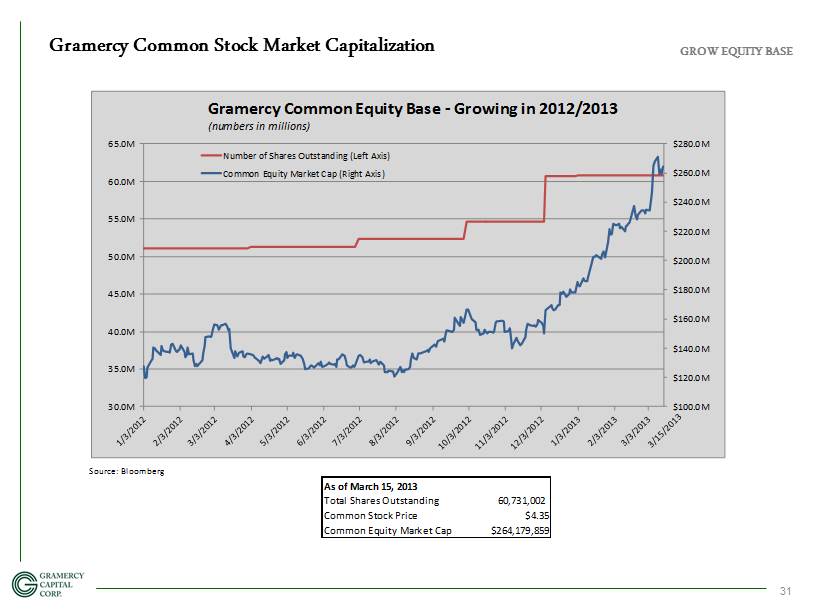
GROW EQUITY BASE Gramercy Common Stock Market Capitalization 31 Source: Bloomberg As of March 15, 2013 Total Shares Outstanding 60,731,002 Common Stock Price $4.35 Common Equity Market Cap $264,179,859 $100.0M $120.0M $140.0M $160.0M $180.0M $200.0M $220.0M $240.0M $260.0M $280.0M 30.0M 35.0M 40.0M 45.0M 50.0M 55.0M 60.0M 65.0M Gramercy Common Equity Base - Growing in 2012/2013 (numbers in millions) Number of Shares Outstanding (Left Axis) Common Equity Market Cap (Right Axis)

GROW EQUITY BASE Gramercy Preferred Stock 32 Source: Bloomberg Current Market Price (3/15/13) $32.71 Current Par Plus Accrued $33.63 Percentage 97.3% 0.0% 10.0% 20.0% 30.0% 40.0% 50.0% 60.0% 70.0% 80.0% 90.0% 100.0% $0.00 $5.00 $10.00 $15.00 $20.00 $25.00 $30.00 $35.00 $40.00 GKK Preferred Stock - Market Price vs. Par Value Market Price (left axis) Par Value, including accrued (left axis) Mkt Price divided by Par Value (right axis) Preferred tender (1.07 million shares at $15/share)

• Very favorable environment for net lease companies • Net Lease REIT’s trade at very favorable valuations • Net lease REITs raised $987.1 million in common equity capital in 2012 • Net lease REITs raised $986.0 million in preferred equity capital in 2012 • Realty Income just completed a $750.0 million equity raise, the largest ever net lease equity offering • Lexington Realty Trust priced a public common stock offering of 20 million shares raising approximately $230 million GROW EQUITY BASE Net Lease Environment 33 (As of March 15, 2013) Company Ticker Stock Price Total Market Cap (1) Dividend Yield Price/AFFO Price/Book Value Price/NAV Realty Income O $44.74 $11.5Bn 4.9% 22.8x 4.4x 166.8% National Retail Properties NNN $35.00 $5.9Bn 4.5% 19.7x 1.9x 122.3% Lexington Realty Trust LXP $11.88 $5.4Bn 5.1% 13.1x 2.2x 109.6% EPR Properties EPR $51.33 $4.1Bn 6.2% 14.3x 2.1x 114.4% Spirit Realty Capital SRC $19.60 $3.6Bn 6.4% 18.0x 1.3x 110.3% Getty Realty Corp. GTY $21.03 $0.9Bn 3.8% 21.2x 1.9x 181.3% Total/Wtd. Avg. - - $31.4Bn 5.1% 18.8x 2.8x 135.6% Sources: Bloomberg, Yahoo Finance, Stifel Nicolaus Weisel Weekly Scorecard (1) Total Market Cap equal to equity market cap, plus any debt and preferred equity as of 4Q 2012
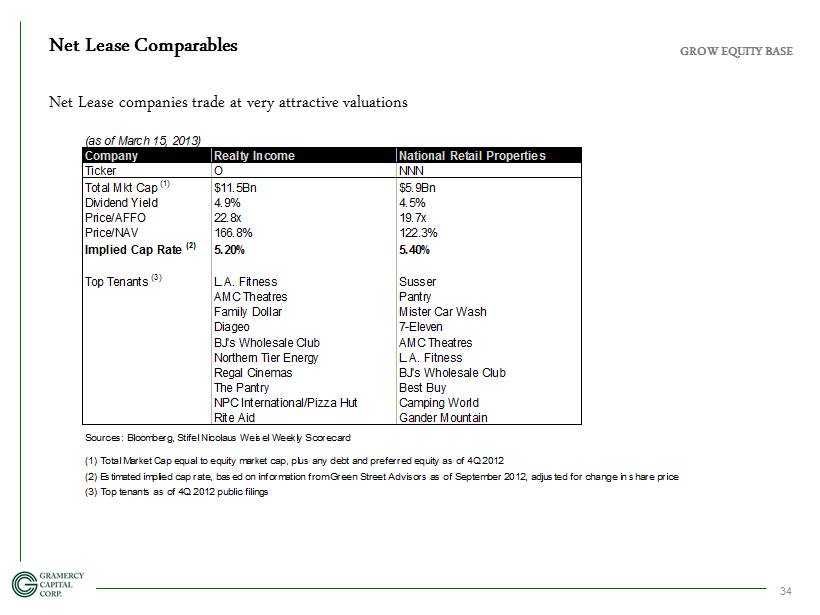
Net Lease companies trade at very attractive valuations GROW EQUITY BASE Net Lease Comparables 34 (as of March 15, 2013) Company Realty Income National Retail Properties Ticker O NNN Total Mkt Cap (1) $11.5Bn $5.9Bn Dividend Yield 4.9% 4.5% Price/AFFO 22.8x 19.7x Price/NAV 166.8% 122.3% Implied Cap Rate (2) 5.20% 5.40% Top Tenants (3) L.A. Fitness Susser AMC Theatres Pantry Family Dollar Mister Car Wash Diageo 7-Eleven BJ's Wholesale Club AMC Theatres Northern Tier Energy L.A. Fitness Regal Cinemas BJ's Wholesale Club The Pantry Best Buy NPC International/Pizza Hut Camping World Rite Aid Gander Mountain Sources: Bloomberg, Stifel Nicolaus Weisel Weekly Scorecard (1) Total Market Cap equal to equity market cap, plus any debt and preferred equity as of 4Q 2012 (2) Estimated implied cap rate, based on information from Green Street Advisors as of September 2012, adjusted for change in share price (3) Top tenants as of 4Q 2012 public filings

• Two major merger and acquisition transactions occurring in 2013 involve Net Lease REITs GROW EQUITY BASE Net Lease Portfolio Liquidity 35 Liquidity exists for large portfolios of net leases at very attractive valuations Company ARCT REIT Cole Credit II REIT Year 2013 2013 Type of Seller Private REIT Private REIT Buyer Realty Income (NYSE:O) Spirit Finance (NYSE:SRC) Portfolio Size $2.0 billion $3.7 billion Property Quality Class B Class B and C Property Type Office, Industrial & Retail Office, Industrial & Retail Cap Rate 6.0% 7.0% (1) Average Lease Term 12.5 years 9.8 years Top Tenants FedEx Walgreens Walgreens Church's Chicken CVS Academy Sports GSA Circle K Dollar General CVS BSFS Home Depot Express Scripts Ferguson Enterprises Payless Tractor Supply (1) Estimated cap rate per Stifel Nicolaus report Sources: Bloomberg, Public Filings

• Well managed, well capitalized public net lease companies trade at attractive valuations: – 1.3x NAV – 20x AFFO – 2.8x Book • $8.0 b illion of net lease portfolio companies have been sold/merged in the last three years at an average straight - lined cap rate for recent transactions of 6.5% • Two public net lease companies (Realty Income, National Retail Properties) have investment grade ratings, with one more on the cusp • All of the above has been achieved despite a broad variety of real estate asset quality and type • Gramercy has the opportunity to be a “best - in - class” industrial and office net lease REIT and take advantage of a very attractive marketplace GROW EQUITY BASE Net Lease Marketplace Summary 36

• Potential to use Stock/OP Units to acquire privately held assets or portfolios • REIT IPO Market continues to be moribund, while Secondary Equity Market is booming • Likely need common dividend to be successful with Stock/OP U nits for property strategy GROW EQUITY BASE Alternatives 37 Gramercy’s public listing is a potentially valuable asset Source: NAREIT (reit.com) Note: 2012 data through November 30, 2012 $0 $5,000 $10,000 $15,000 $20,000 $25,000 $30,000 $35,000 2004 2005 2006 2007 2008 2009 2010 2011 2012 Dollars in millions Historical REIT IPO/Secondary Equity Issuance IPO Market Issuance Secondary Equity Market Issuance

Streamline Business, Simplify Story
• Exited mortgage finance business • Disposed of non - core assets, except CDO equity • Focused business on area of opportunity • Building “best - in - class” office and industrial net lease portfolio STREAMLINE BUSINESS, SIMPLIFY STORY Streamline Business, Simplify Story 39
Gramercy Property Trust 40 • April 15, 2013 • Change name to reflect business as pure play Equity REIT • Change NYSE ticker to “GPT” from “GKK” STREAMLINE BUSINESS, SIMPLIFY STORY

Goal: Create Durable, Growing Dividends
CREATE DURABLE, GROWING DIVIDENDS Gramercy Property Trust – Business Dashboard 42 2013 REVENUE Net Lease Business Gramercy Asset Management Gramercy Finance/CDO Business EXPENSES Net Lease Business Gramercy Asset Management Gramercy Finance/CDO Business CONTRIBUTION BY SEGMENT Net Lease Business Gramercy Asset Management Gramercy Finance/CDO Business CORPORATE LEVEL PROFIT Preferred Dividend Tax Expense
• Mortgage financing • Put in place line - of - credit – approximately $100 million, end of Q2 2013 • Preferred true - up and dividend • Common dividend CREATE DURABLE, GROWING DIVIDENDS Access to Capital 43 Goal of growing, durable dividends

ROE Disclaimer ROE as defined in this presentation is the asset - level yield minus the assumed financing cost divided by the invested equity . The ROE assumption included in this presentation reflects the Company's assumptions and expectations which are not guarantees of its future performance . The Company's actual return on equity may vary materially from the assumptions presented in this presentation . The results that an investor in the Company will actually receive will depend, to a significant degree, on the actual performance of the Company's assets, which may be impacted by material economic and market risk factors . NOI Disclaimer Net operating income is a non - GAAP financial measure that represents property revenues on a straight - lined basis minus property expenses before interest and capital reserves/expenditures . The NOI assumption included in this presentation reflects the Company's assumptions and expectations which are not guarantees of its future performance . The Company's actual NOI may vary materially from the assumptions presented in this presentation . The results that an investor in the Company will actually receive will depend, to a significant degree, on the actual performance of the Company's assets, which may be impacted by material economic and market risk factors . Cap Rate Disclaimer A rate of return on a real estate investment property based on the expected, straight - lined income that the property will generate . Capitalization rate is used to estimate the Company’s potential return on its investment . This is done by dividing the income the property will generate (before debt service and depreciation and after fixed costs and variable costs) by the acquisition price of the property . 44 ROE Disclaimer / NOI Disclaimer / Cap Rate Disclaimer