Attached files
| file | filename |
|---|---|
| 8-K - FORM 8-K - Bristow Group Inc | d504544d8k.htm |
 Howard Weil 41
st
Annual Energy
Conference
Bristow Group Inc.
March 17-21, 2013
Exhibit 99.1 |
 2
Forward-looking statements |
 3
Bristow is the leading provider of helicopter services
and is a unique investment in oil field services
•
~20 countries
•
556 aircraft
•
~3,400 employees
•
Ticker: BRS
•
Stock price
*
: $59.69/share
•
Market cap
*
: ~$2.2 billion
•
Quarterly dividend of $0.20/share
$67
Bristow flies crews and light cargo to production platforms, vessels and rigs
* Based on 36.6 million fully diluted weighted average shares outstanding for the
nine months ended 12/31/2012 and stock price as of March 14, 2013. |
 4
Why Bristow?
$275
•
Bristow
is
the
largest
of
only
two
global
helicopter
providers
•
Bristow
is
stable
as
we
have
long
term
contracts
that
serve
mostly production
•
Bristow
is
growing
with
demand
not
dependent
on
economic
or commodity cycles
•
Bristow’s
asset
values
are
resilient
even
in
depressed
economic times as there is strong demand for helicopters
outside of E&P
•
Bristow
pays
a
quarterly
dividend
of
$0.20/share
after
a
33%
increase in June 2012 and has a $100 million share repurchase
reauthorization |
 5
•
Safety is our primary core value
•
Bristow’s ‘Target Zero’
program is now the leading example
emulated industry-wide
•
Safety Performance accounts for 25% of management
incentive compensation
•
2011 National Ocean Industries Association (NOIA) Safety
in Seas Award Winner |
 6
Our value proposition is based on three principles:
secular growth, financial safety, and balanced return
Long term value for our
shareholders
2. Prudent Balance
Sheet management
with ample liquidity
1. Growth not dependent
on economic or
commodity cycles
3. Capital Return
through dividends and
opportunistic share repurchases
Investment:
FY 2012 -
2016 |
 7
1. Bristow services are utilized in every phase of
offshore oil and gas activity, especially production
•
Largest share of revenues (>60%) relates to
oil and gas production, providing stability and
growth opportunities
•
There are ~ 8,000 offshore production
installations worldwide —
compared with
>600 exploratory drilling rigs
•
~ 1,700 helicopters are servicing the
worldwide oil and gas industry of which
Bristow’s fleet is approximately one-third
•
Bristow revenues are primarily driven by
operating expenditures
Typical revenues by segment
Exploration
20%
Development
10%
Production
60%
Other 10%
ABANDONMENT
EXPLORATION
SEISMIC
DEVELOPMENT
PRODUCTION |
 8
Fixed
monthly
65%
Variable
hourly
35%
Fixed
monthly
70%
Variable
hourly
30%
Bristow’s contract structure generates predictable
cashflow:
Significant operating leverage
Revenue sources
•
Two tiered contract structure includes both:
–
Fixed monthly standing charge to reserve helicopter capacity
–
Variable fees based on hours flown with fuel pass through
•
Bristow contracts earn 65% of revenue without flying
Operating income |
 9
Bristow global operations deliver excellence
Safety
Reliability
Service
Performance
Fleet management improvements for availability ongoing. Global
Account Management instituted for best service. New consistent
operational reporting tools being designed and implemented to track
performance. Bristow Air Incident Rate (BAIR) instituted.
Service has been excellent. On average we’re receiving less than 1
complaint and almost 6 compliments for each 10,000 passengers
transported.
Our on-time departure and availability statistics averaging 95%*
and 99%* respectively during the same period highlighting
exceptional operational performance.
TRIR was 0.28*, which is world class. We continue to strive for
improvement.
* from April 1, 2012 to January 31, 2013 |
 10
•
During an October 2012 flight to an offshore platform, an EC225 helicopter flown by
another operator performed a controlled ditching due to gear shaft failure.
UK and Norwegian CAAs issued safety directives, requiring operators to
suspend operations of similar aircraft.
•
We continue to actively support the ongoing efforts to determine
the root cause and the
development of acceptable mitigating measures to resume flight operations.
•
Bristow is not operating a total of 16 large EC225 aircraft until further notice:
12 in the UK, three in Australia and one in Norway. Globally across the
industry approximately 80 aircraft are affected.
•
Bristow has increased utilization of other in-region aircraft, has moved, or is
moving, available aircraft to mitigate the impact to our clients, and had
brought new a/c into the UK.
•
Currently no client contracts have been cancelled.
•
Bristow has the financial strength to handle this challenge. The
previously announced
order of ten new Sikorsky S-92 large helicopters is an example of our ability
to manage through this issue, and importantly, react quickly to provide
solutions for our clients in an already tight supply environment.
EC225 Fleet update |
 11
Our growth tracker has been updated for FY14-
FY18 with 474 a/c opportunities (11% increase) |
 12
•
Bristow uses specific
opportunities to create
our order book
•
Opportunities are
condensed to 288
realistic bids
•
82 high probability
targets are derived from
a view that we have an
~33% bid success rate
•
Our order book is then
managed using primarily
capital efficient a/c
options with our OEMs
* Orders and options are as of March 7, 2013
474 aircraft opportunities identified
82 high
probability targets
48
orders*
430 demand for new aircraft
288 realistic bid
opportunities
70 options
We manage our opportunities through the purchase of
118 a/c options and committed orders |
 13
2. Bristow enjoys the strongest balance sheet in our
industry with ample liquidity, cash flow and asset value
Ample
Liquidity
Significant
Cash Flow
generation
•
BVA leads to a focus on cash and cash flows from
operations. Bristow generated 5% more operating cash
flow in FY12 compared to FY11
•
Bristow closed Q3 FY13 with more than $430 million of
liquidity
Prudent
Balance
Sheet
management
•
Adjusted Debt/Capital Ratio less than 44% with a BBB-
rating from Standard & Poor’s for secured debt
•
Operating lease strategy used to finance growth with a
very competitive cost of capital |
 14
Our focus on returns has yielded much higher
operating cash flow generation . . .
Net cash provided by operating activities*
* See 10-Q for more information on cash flow provided by operating
activities |
 15
. . . leading to a robust cash and liquidity position |
 16
. . . And growth in our asset values
•
Our net asset value (NAV) primarily consists of the fair market
value of the fleet, which has resilient value through downturns
•
In the past two years, Bristow has increased our NAV per share
by almost 20% while maintaining prudent balance sheet
management and increasing BVA |
 17
3. Bristow has a proven commitment to a balanced return
for our shareholders as demonstrated in the past year
Share
Repurchase
Regular
Dividend
•
FY12 quarterly dividend initiated at $0.15/share
•
Dividend increased by 33% to $0.20/share in
June 2012 quarter
•
Bristow has renewed its $100 million share
repurchase reauthorization with ~$1 million
repurchased in 3QFY13
•
Value is key to decision with net book value
and aircraft FMV being guide posts |
 18
Bristow has also delivered consistent financial
performance over the past year
•
Annual adjusted EPS guidance has been raised to $3.60 -
$3.85 per share
from $3.25 -
$3.55 per share
* Assuming revenue earned in same regions and same mix
•
Eighth consecutive quarterly dividend since the end of FY11
•
Repurchased $1.2 million of shares in Q3 FY13 |
 19
Conclusions
•
Safety continues to be our number one priority as we strive to
achieve Target Zero
•
We see continued improvement in revenue generation
through new contract awards across all business units
coupled with an ongoing effective cost management focus
•
Higher year-over-year EBITDAR and BVA demonstrate the
strength of our business model, especially with the investment
in Cougar
•
Our prudent balance sheet allows us to respond to and
successfully manage through industry challenges such as the
EC225 suspension of operations |
 20
Bristow Group Inc. (NYSE: BRS)
2103 City West Blvd., 4
th
Floor
Houston, Texas 77042
t
713.267.7600
f
713.267.7620
bristowgroup.com
Contact us |
 21
Appendix |
 22
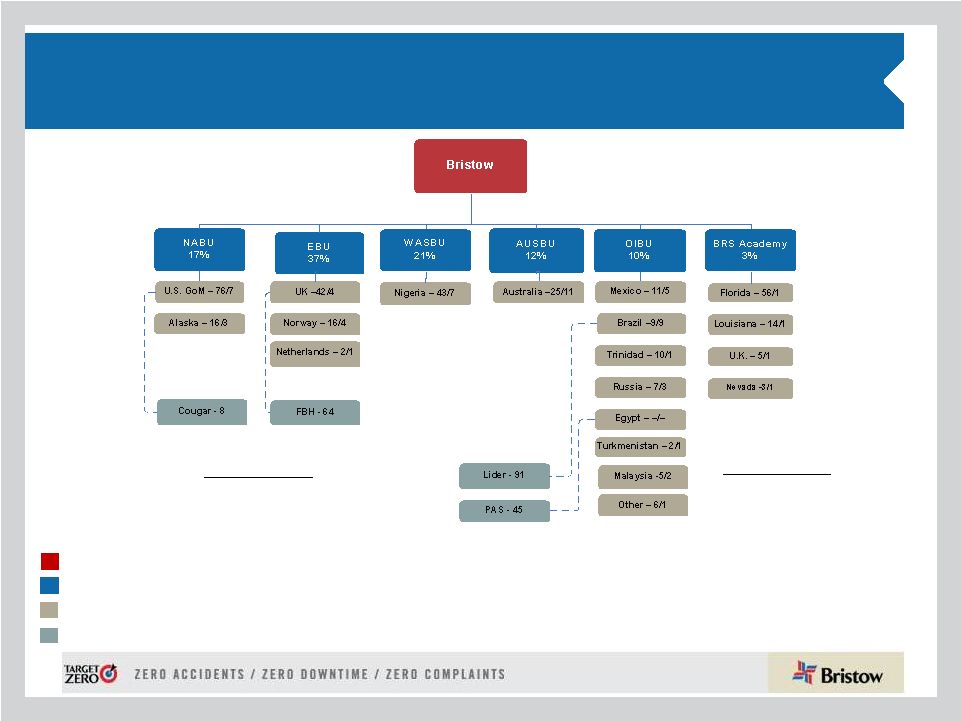
Organizational Chart -
as of December 31, 2012
Business
Unit
(%
of
FY13
Operating
Revenue)
Corporate
Region
( # of Aircraft / # of Locations)
Joint
Venture
(#
of
aircraft)
Key
Operated Aircraft
Bristow owned and/or operated
356 aircraft as of December 31,
2012
Affiliated Aircraft
Bristow affiliates and joint
ventures operated 200 aircraft
as of December 31, 2012 |
 23
Aircraft Fleet –
Medium and Large
As of December 31, 2012
Next Generation Aircraft
Medium capacity 12-16 passengers
Large capacity 18-25 passengers
Mature Aircraft Models
Fair market value of our owned fleet is $2.0 billion and leased fleet is $400 million
2
1
Aircraft
Type
No. of PAX
Engine
Consl
Unconsl
Total
Ordered
Large Helicopters
AS332L Super Puma
18
Twin Turbine
20
-
20
-
AW189
16
Twin Turbine
-
-
-
6
EC175
16
Twin Turbine
-
-
-
5
EC225
25
Twin Turbine
20
-
20
3
Mil MI 8
20
Twin Turbine
7
-
7
-
Sikorsky S-61
18
Twin Turbine
2
-
2
-
Sikorsky S-92
19
Twin Turbine
42
7
49
18
91
7
98
32
LACE
89
Medium Helicopters
AW139
12
Twin Turbine
7
2
9
6
Bell 212
12
Twin Turbine
14
14
-
Bell 412
13
Twin Turbine
30
20
50
-
EC155
13
Twin Turbine
1
-
1
-
Sikorsky S-76A/A++
12
Twin Turbine
15
5
20
-
Sikorsky S-76C/C++
12
Twin Turbine
51
34
85
-
Sikorsky S-76D
12
Twin Turbine
10
104
75
179
16
LACE
45
1)
LACE does not include held for sale, training and fixed wing helicopters
2)
Order book is as of March 7, 2013 |
 24
Aircraft Fleet –
Small, Training and Fixed
As of December 31, 2012 (continued)
Next Generation Aircraft
Mature Aircraft Models
Small capacity 4-7 passengers
Training capacity 2-6 passengers
1)
LACE does not include held for sale, training and fixed wing helicopters
2)
Order book is as of March 7, 2013 |
 25
Operating lease strategy: lowering the cost and
amount of capital needed to grow
•
Of the 61 aircraft currently leased in our fleet, 31 are training and 30 are
commercial (22 LACE)
•
22 LACE aircraft represent approximately 14% of our commercial fleet
•
Our
goal
is
for
commercial
fleet
operating
leases
to
account
for
20-30%
of
our
LACE
Leased aircraft as of December 31, 2012
See
10-Q
Note
6
“Commitments
and
contingencies”
for
more
information
provided
on
operating
leases
Small
Medium
Large
Total
Leased LACE
Total LACE
% Leased
EBU
-
-
10
10
10
51
20%
WASBU
-
1
-
1
1
20
3%
NABU
1
11
2
14
8
39
20%
AUSBU
2
-
3
5
4
17
21%
OIBU
-
-
-
-
-
27
-
Total
3
12
15
30
22
154
14% |
 26
Consolidated fleet changes and aircraft sales for
Q3 FY13
See 10-Q Note 6 “Commitments and contingencies”
for more information provided on operating leases
Small
Medium
Large
Total
EBU
-
2
2
4
WASBU
-
1
-
1
NABU
-
-
-
-
AUSBU
-
4
-
4
OIBU
-
8
-
8
Total
-
15
2
17
Held for sale aircraft in consolidated fleet
Small
Medium
Large
Training
Total
EBU
-
-
10
-
10
WASBU
-
1
-
-
1
NABU
1
11
2
-
14
AUSBU
2
-
3
-
5
OIBU
-
-
-
-
-
Academy
-
-
-
31
31
Total
3
12
15
31
61
Leased aircraft in consolidated fleet
# of A/C Sold
Received**
Q1 FY13
4
19.0
$
Q2 FY13
5
16.5
Q3 FY13
4
7.5
Totals
13
43.0
$
** Amounts stated in millions
Q1 FY13
Q2 FY13
Q3 FY13
YTD
Fleet Count Beginning
361
357
349
361
Delivered
-
B412EP
1
1
S-92
2
10
12
EC225
1
1
2
Total Delivered
2
1
12
15
Removed
Sales
(4)
(5)
(5)
(14)
Other*
(2)
(4)
-
(6)
Total Removed
(6)
(9)
(5)
(20)
357
349
356
356
* Includes destroyed aircraft, lease returns and commencements
Fleet changes |
 27
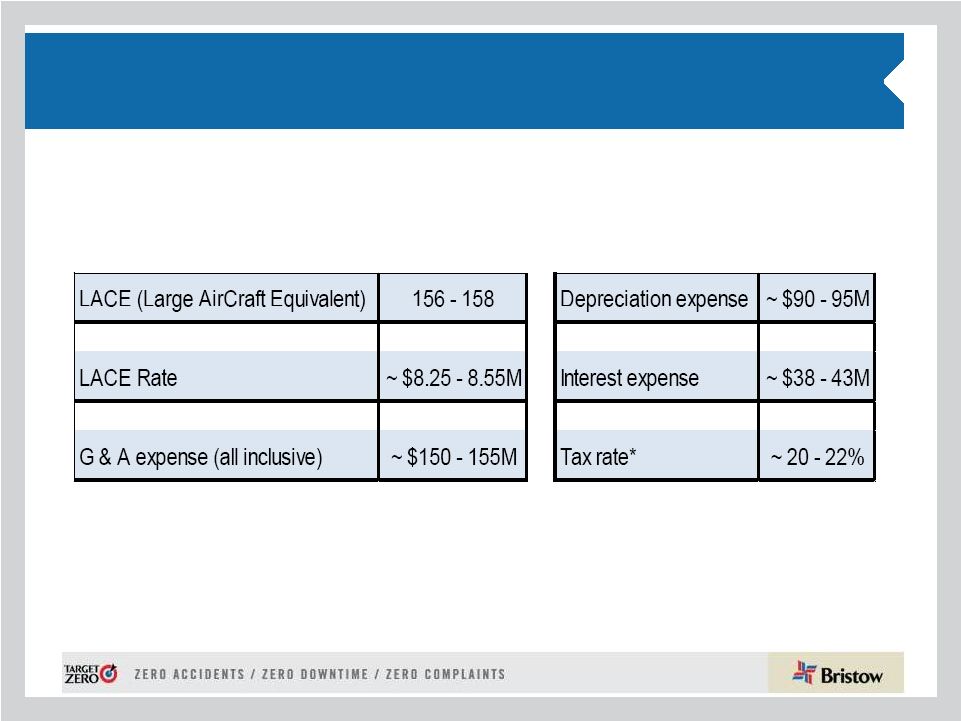
Operating revenue, LACE and LACE Rate by BU
1) $ in millions
2) LACE Rate is annualized
3) $ in millions per LACE |
 28
Historical LACE and LACE Rate by BU
1) $ in millions
2) LACE Rate is annualized
Q1
Q2
Q3
Q4
Q1
Q2
Q3
Q4
Q1
Q2
Q3
EBU
42
43
48
46
44
46
46
45
47
45
51
WASBU
24
24
21
22
23
22
22
22
22
22
20
NABU
39
35
34
29
30
29
30
30
30
31
39
AUSBU
20
23
24
20
19
20
20
19
18
17
17
OIBU
33
33
33
38
39
38
38
34
32
28
27
Consolidated
157
158
159
154
154
154
155
149
147
142
154
Q1
Q2
Q3
Q4
Q1
Q2
Q3
Q4
Q1
Q2
Q3
EBU
$8.20
$8.50
$7.90
$8.40
$9.80
$9.60
$9.63
$10.09
$10.60
11.03
9.74
WASBU
9.70
9.40
10.70
9.90
9.10
10.30
11.17
11.46
12.35
12.24
13.71
NABU
5.40
6.10
6.00
6.60
5.80
6.30
5.89
5.79
7.05
7.11
5.84
AUSBU
6.80
6.00
6.00
7.50
8.60
7.10
6.96
7.78
8.48
9.29
9.55
OIBU
3.90
4.10
4.40
3.90
3.50
3.70
3.78
4.22
4.22
4.62
4.76
Consolidated
6.70
6.90
6.90
7.10
7.30
7.40
7.43
7.89
8.55
8.95
8.49
LACE
2011
2012
2011
2012
2013
2013
LACE Rate
1,2 |
 29
Order and options book as of March 7, 2013 |
 30
Adjusted EBITDAR margin* trend
*
Adjusted
EBITDAR
excludes
special
items
and
asset
dispositions
and
calculated
by
taking
adjusted
EBITDAR
divided
by
operating
revenue
Q1
Q2
Q3
Q4
Full Year
Q1
Q2
Q3
Q4
Full Year
EBU
31.2%
31.7%
31.9%
28.0%
30.8%
29.8%
31.5%
34.6%
34.4%
32.7%
WASBU
31.7%
36.8%
33.7%
39.1%
36.0%
33.7%
36.9%
35.8%
34.3%
35.2%
NABU
18.3%
20.0%
14.9%
17.7%
17.8%
20.8%
25.8%
15.9%
8.5%
18.5%
AUSBU
26.5%
36.7%
34.4%
31.3%
32.4%
33.2%
26.1%
27.0%
31.1%
29.3%
OIBU
34.4%
37.6%
25.9%
25.1%
31.0%
18.3%
40.2%
37.4%
59.4%
39.3%
Consolidated
24.7%
27.8%
24.7%
23.9%
25.3%
23.8%
27.5%
25.9%
29.6%
26.7%
Q1
Q2
Q3
Q4
Full Year
Q1
Q2
Q3
EBU
33.0%
31.4%
30.7%
36.1%
32.9%
32.2%
34.6%
39.5%
WASBU
29.5%
35.5%
37.2%
36.6%
35.0%
31.9%
26.5%
35.0%
NABU
14.3%
20.6%
14.8%
19.4%
17.3%
23.2%
20.7%
29.1%
AUSBU
20.2%
14.4%
23.5%
35.6%
24.3%
27.0%
28.0%
27.3%
OIBU
48.1%
19.1%
47.8%
42.9%
39.5%
36.2%
44.2%
55.7%
Consolidated
23.4%
24.0%
27.6%
31.2%
26.6%
26.3%
26.1%
31.5%
2010
2011
2012
2013
(fiscal year ended) |
 31
Adjusted EBITDAR* reconciliation
* Adjusted EBITDAR excludes special items and asset dispositions
($ in millions)
Q1
Q2
Q3
Q4
YTD
Q1
Q2
Q3
Q4
YTD
Net income
$24.0
$33.7
$27.1
$28.7
$113.5
$20.9
$38.8
$42.3
$31.2
$133.3
Income tax expense
9.5
11.2
5.7
2.6
29.0
8.5
3.3
-11.8
7.1
7.1
Interest expense
10.0
10.6
11.0
10.8
42.4
11.1
11.5
13.8
9.9
46.2
Gain on disposal of assets
-6.0
-4.9
-2.4
-5.3
-18.7
-1.7
-1.9
0.0
-5.1
-8.7
Depreciation and amortization
18.2
18.5
20.7
17.4
74.7
19.3
21.0
21.3
27.7
89.4
Special items
2.5
-2.4
-1.2
1.0
0.0
0.0
0.0
-1.2
2.4
1.2
EBITDA Subtotal
58.2
66.7
60.8
55.1
240.9
58.1
72.7
64.4
73.3
268.5
Rental expense
7.0
6.9
7.2
6.3
27.3
6.6
6.1
8.7
7.7
29.2
Adjusted EBITDAR
$65.2
$73.6
$0.1
$61.3
$268.2
$64.7
$78.8
$73.1
$81.1
$297.7
($ in millions)
Q1
Q2
Q3
Q4
YTD
Q1
Q2
Q3
Net income
$21.2
$3.0
$26.5
$14.6
$65.2
$24.2
$30.4
$36.7
Income tax expense
6.6
-1.9
7.1
2.4
14.2
6.2
8.3
7.8
Interest expense
9.0
9.5
9.8
10.0
38.1
8.8
8.6
14.7
Gain on disposal of assets
-1.4
1.6
2.9
28.6
31.7
5.3
1.3
-7.4
Depreciation and amortization
22.7
25.4
22.7
25.3
96.1
21.4
23.3
24.9
Special items
0.0
24.6
0.0
3.4
28.1
2.2
-2.8
14.9
EBITDA Subtotal
58.1
62.1
68.9
84.3
273.4
68.0
69.2
91.6
Rental expense
9.0
9.1
12.8
15.1
46.0
16.3
15.3
17.6
Adjusted EBITDAR
$67.0
$71.2
$81.8
$99.5
$319.5
$84.3
$84.5
$109.2
3/31/2010
3/31/2011
3/31/2012
Fiscal year ended,
3/31/2013 |
 32
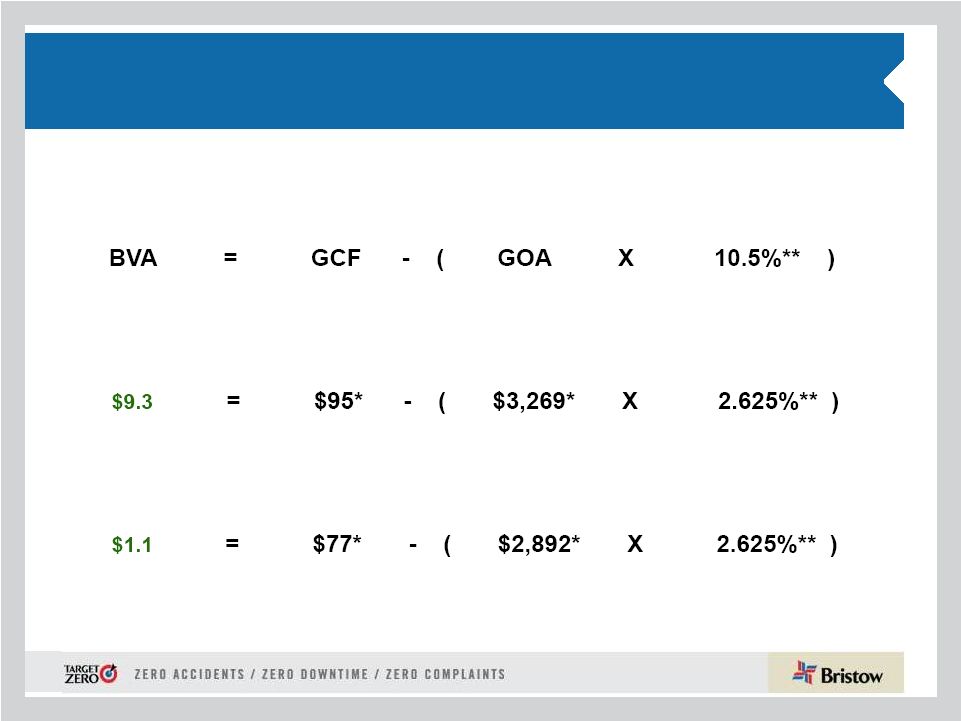
Bristow Value Added = Gross Cash Flow –
(Gross Operating Assets X Capital Charge)
Bristow Value Added calculation for Q3 FY13
Bristow Value Added calculation for Q3 FY12
Bristow Value Added (BVA)
Sample calculation for Q3 FY13 and Q3 FY12
* Reconciliation for these items follows right after
this slide ** Quarterly capital charge of 2.625% is based on
annual capital charge of 10.5% |
 33
Gross Cash Flow Reconciliation
(in millions)
Gross Cash Flow Reconciliation
Q3 FY13
Q3 FY12
Net Income
$36
$26
Depreciation and Amortization
25
23
Interest Expense
15
10
Interest Income
(0)
(0)
Rent
18
13
Other Income/expense-net
15
0
Earnings of Discontinued Operations
-
-
Gain/loss on Asset Sale
(7)
3
Special Items
-
-
Tax Effect from Special Items
(3)
(1)
Earnings (losses) from Unconsolidated Affiliates, Net
(9)
(3)
Non-controlling Interests
0
1
Gross Cash Flow (before Lider)
$90
$71
Gross Cashflow -Lider prportional
5
6
Gross Cash Flow after Lider
$95
$77 |
 34
Gross Operating Asset Reconciliation |
 35
GAAP Reconciliation
Three Months Ended
Nine Months Ended
December 31,
December 31,
2012
2011
2012
2011
(In thousands)
Adjusted operating income
$
66,724
$
46,418
$
160,000
$
119,900
Gain (loss) on disposal of assets
7,396
(2,865)
819
(3,060)
Special items
—
—
622
(27,287)
Operating income
$
74,120
$
43,553
$
161,441
$
89,553
Adjusted EBITDAR
$
109,223
$
81,769
$
277,950
$
220,029
Gain (loss) on disposal of assets
7,396
(2,865)
819
(3,060)
Special items
(14,932)
—
(14,310)
(24,610)
Depreciation and amortization
(24,867)
(22,709)
(69,560)
(70,848)
Rent expense
(17,604)
(12,836)
(49,160)
(30,897)
Interest expense
(14,742)
(9,756)
(32,113)
(28,170)
Provision for income taxes
(7,788)
(7,118)
(22,310)
(11,779)
Net income
$
36,686
$
26,485
$
91,316
$
50,665
Adjusted net income
$
42,632
$
27,790
$
101,304
$
71,089
Gain (loss) on disposal of assets
(i)
6,101
(2,258)
658
(2,482)
Special items
(i)
(12,341)
—
(12,240)
(19,319)
Net income attributable to Bristow Group
$
36,392
$
25,532
$
89,722
$
49,288
Adjusted diluted earnings per share
$
1.17
$
0.76
$
2.77
$
1.93
Gain (loss) on disposal of assets
(i)
0.17
(0.06)
0.02
(0.07)
Special items
(i)
(0.34)
—
(0.33)
(0.53)
Diluted earnings per share
1.00
0.70
2.45
1.34
(i)
These amounts are presented after applying the appropriate tax effect to each item and dividing by
the weighted average shares outstanding during the related period to calculate the earnings
per share impact. |
 36
Leverage Reconciliation
*Adjusted EBITDAR exclude gains and losses on dispositions of assets
Debt
Investment
Capital
Leverage
(a)
(b)
(c) = (a) + (b)
(a) / (c)
(in millions)
As of December 31, 2012
900.6
$
1,616.8
$
2,517.4
$
35.8%
Adjust for:
Unfunded Pension Liability
115.7
115.7
NPV of Lease Obligations
243.9
243.9
Letters of credit
2.6
2.6
Adjusted
1,262.7
$
(d)
1,616.8
$
2,879.5
$
43.9%
Calculation of debt to adjusted EBITDAR multiple
TTM Adjusted EBITDAR*:
FY 2013
377.4
$
(e)
\
= (d) / (e)
3.35:1 |
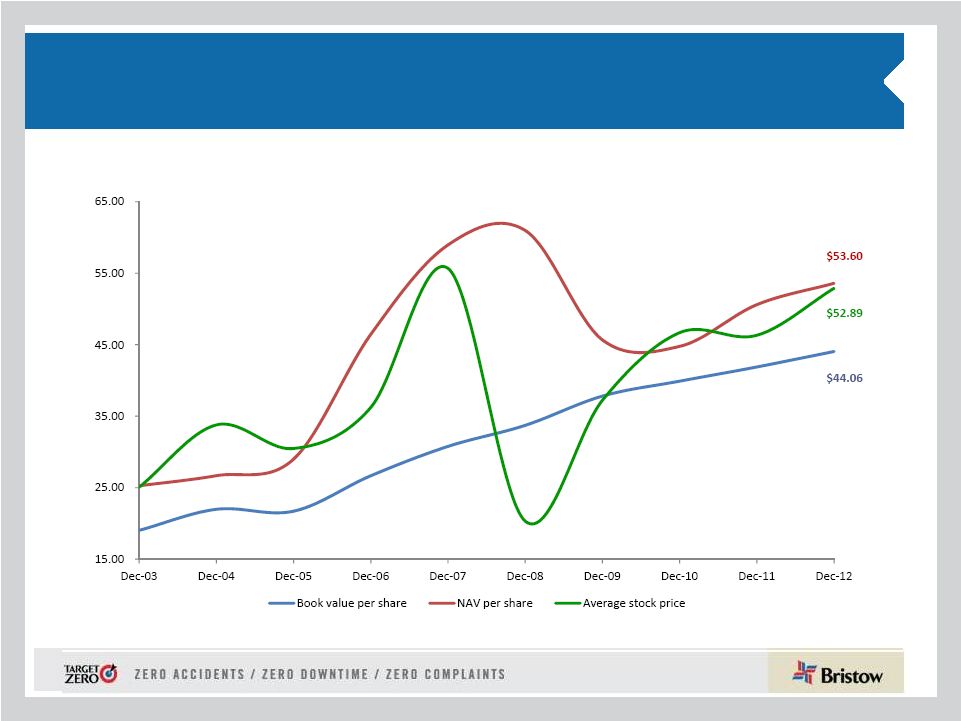 37
Net Asset Value (NAV) Comparison:
12/31/2003 to 12/31/2012 |
 38
Bristow Group Inc. (NYSE: BRS)
2103 City West Blvd., 4
th
Floor
Houston, Texas 77042
t
713.267.7600
f
713.267.7620
bristowgroup.com
Contact Us |