Attached files
| file | filename |
|---|---|
| 8-K - CURRENT REPORT OF MATERIAL EVENTS OR CORPORATE CHANGES - Digital Generation, Inc. | a13-7713_18k.htm |
Exhibit 99.1
|
|
1 Digital Generation, Inc. Craig Holmes EVP and CFO March 2013 The Digital Sweet Spot ©2013 Digital Generation Inc. All rights reserved |
|
|
2 Risks and Uncertainties / Regulation G Risk and Uncertainties Certain statements contained herein may be deemed to constitute “forward-looking statements.” Words such as “may,” “anticipate,” “estimate,” “expects,” “projects,” “future,” “intends,” “will,” “plans,” “believes” and words and terms of similar substance used in connection with any discussion of future operating or financial performance, identify forward looking statements. All forward-looking statements are management’s present expectations of future events and are subject to a number of risks and uncertainties that could cause actual results to differ materially from those described in the forward-looking statements. You are cautioned to read the risks and uncertainties under the heading “Risk Factors” in our various filings with the Securities and Exchange Commission. In light of these assumptions, risks and uncertainties, the results and events discussed in the forward-looking statements contained herein might not occur. You are cautioned not to place undue reliance on forward-looking statements, which speak only as of the date of this filing. We are not under any obligation, and we expressly disclaim any obligation, to update or alter any forward-looking statements, whether as a result of new information, future events or otherwise, except as may be required by applicable law. All subsequent forward-looking statements attributable to management or to any person authorized to act on our behalf are expressly qualified in their entirety by the cautionary statements contained or referred to in this presentation. Regulation G The following presentation includes use of Segment EBITDA (a non-GAAP financial measure as defined in Regulation G of the Securities Exchange Act of 1934). A reconciliation of Segment EBITDA to its most comparable GAAP measure, Income from Operations, is included in the last slide of this presentation. ©2013 Digital Generation Inc. All rights reserved |
|
|
Agenda Our Heritage Our Vision Our Financials 3 ©2013 Digital Generation Inc. All rights reserved |

|
|
“We deliver more spots than anyone, anywhere.” 50,000 media destinations across 75 countries 4 ©2013 Digital Generation Inc. All rights reserved |
|
|
1. Our Heritage 5 A little bit about us Because where we have come from will help you determine our ability to get to where you want to go ©2013 Digital Generation Inc. All rights reserved |

|
|
DG Has Transformed 6 Revenue Mix Full-Time Employees Revenue Mix Full-Time Employees 2010 Acquisitions 2012 Online 8% TV 92% Online 17% TV 83% Online 46% TV 54% Online 36% TV 64% ©2013 Digital Generation Inc. All rights reserved |
|
|
7 Now DG manages 10% of the world’s media assets 10% ©2013 Digital Generation Inc. All rights reserved |
|
|
The DG Universe 8 1,750+ Employees 7,400+ Ad Agency Partners 46 Offices Covering 78 Countries Penetrates 99% of All US Broadcast Destinations 12+ Million Ad Deliveries Since 2010 1.6+ Million Unique TV Ads Distributed Since 1996 Over 1,000 Online Publisher Partnerships 100+ Billion Impressions Served Monthly 800+ Million Unique Users 8,000+ Web Campaigns Delivered 14,000+ Corporate Partners ©2013 Digital Generation Inc. All rights reserved |
|
|
We started the digital ad revolution 9 ©2013 Digital Generation Inc. All rights reserved |
|
|
We invented rich media advertising 10 ©2013 Digital Generation Inc. All rights reserved |

|
|
Driving Consumer Engagement Globally 11 We enabled the first dual-screen ad campaign ©2013 Digital Generation Inc. All rights reserved |

|
|
2. Our Vision 12 A little insight into our mind Because where we set our sights determines the course that will navigate us towards the future we envision. ©2013 Digital Generation Inc. All rights reserved |
|
|
How focused are we on video? 13 ©2013 Digital Generation Inc. All rights reserved |

|
|
We Believe Advertising is Now Video-Centric 14 Streaming Video inBanner inPlayer inApp 2nd Screen Online Ads PCs Mobile Tablets DOOH TV Spots SD/HD OTT Smart TV Mobile TV ©2013 Digital Generation Inc. All rights reserved |
|
|
The DG Hub Product infrastructure 15 MediaMind VideoFusion Assets Analytics & Data ©2013 Digital Generation Inc. All rights reserved |
|
|
3. Our Financials 16 A look into our numbers Understanding financial information to execute the business strategy, satisfy customers, and evaluate performance ©2013 Digital Generation Inc. All rights reserved |
|
|
2012 Financial & Operational Highlights Substantially completed integration of online businesses Online revenues represent over one third of company revenues Online data & analytics products and services increased 200% HD penetration rates grew from 18% to 31% HD ASPs declined by approximately 25% Political revenues of $8.5M for 2012, $3.5M for Q4 2012 Arbitration award of $3.5M to be recorded once received New experienced management team Credit Agreement amendment completed in March 2013 17 ©2013 Digital Generation Inc. All rights reserved |
|
|
18 ($ in millions) A reconciliation of Income from Operations to Segment EBITDA (non-GAAP) can be found on the last page of the presentation. Historical Revenue and Segment EBITDA 2008 2009 2010 2011 2012 $153 $183 $241 $325 $387 Revenue $74 $92 $135 $152 Segment EBITDA TV Online $152 2008 2009 2010 2011 2012 $170 $223 $247 $246 $153 $130 $138 ©2013 Digital Generation Inc. All rights reserved |
|
|
TV Segment Performance 19 = Net Increase Political + M&A Revenue = Segment EBITDA Q4 Full Year ($ in millions) = Revenue $64.3 $62.4 $58.7 $37.4 $33.5 58% 54% 56% 53% 2011 2012 2011 2012 ©2013 Digital Generation Inc. All rights reserved A reconciliation of Income from Operations to Segment EBITDA (non-GAAP) can be found on the last page of the presentation. |
|
|
Online Segment Performance 20 = 2011 EyeWonder Revenue = Segment EBITDA Q4 Full Year ($ in millions) = Revenue $44.0 $41.2 $34.5 $10.7 $11.2 24% 27% 19% 16% 2011 2012 2011 2012 $39.4 = 2012 Peer39 Revenue $140.7 $77.5 $15.0 $22.6 $136.2 $65.0 ©2013 Digital Generation Inc. All rights reserved A reconciliation of Income from Operations to Segment EBITDA (non-GAAP) can be found on the last page of the presentation. |
|
|
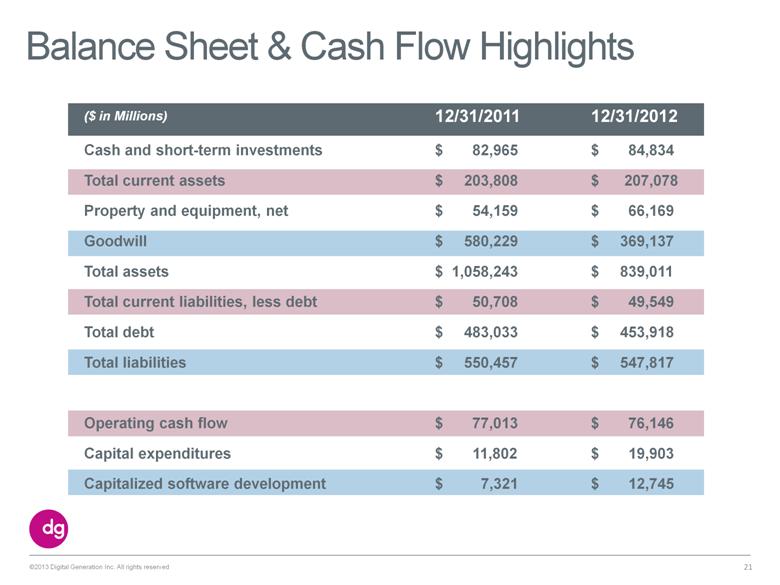
Balance Sheet & Cash Flow Highlights 21 ($ in Millions) 12/31/2011 12/31/2012 Cash and short-term investments $ 82,965 $ 84,834 Total current assets $ 203,808 $ 207,078 Property and equipment, net $ 54,159 $ 66,169 Goodwill $ 580,229 $ 369,137 Total assets $ 1,058,243 $ 839,011 Total current liabilities, less debt $ 50,708 $ 49,549 Total debt $ 483,033 $ 453,918 Total liabilities $ 550,457 $ 547,817 Operating cash flow $ 77,013 $ 76,146 Capital expenditures $ 11,802 $ 19,903 Capitalized software development $ 7,321 $ 12,745 ©2013 Digital Generation Inc. All rights reserved |
|
|
Growth Strategy Leverage leadership position in TV and online with platform approach to gain greater share of video advertising dollars Provide advertising agencies with one source for innovative and effective multiscreen advertising platform solutions Pursue aggressive product roadmap to bring revolutionary offerings for superior campaign management to the advertising marketplace Increase the technology component of TV operations to improve efficiencies and protect margins and cash generation Utilize strong cash flows to pay down debt and improve financial position 22 ©2013 Digital Generation Inc. All rights reserved |
|
|
Spot on. Thanks. |

|
|
In addition to providing financial measurements based on generally accepted accounting principles in the United States of America (GAAP), we have historically provided additional financial measures that are not prepared in accordance with GAAP (non-GAAP). Legislative and regulatory changes discourage the use of and emphasis on non-GAAP financial measures and require companies to explain why non-GAAP financial measures are relevant to management and investors. We believe that the inclusion of Adjusted EBITDA and Segment EBITDA before corporate overhead as non-GAAP financial measures helps investors gain a meaningful understanding of our past performance and future prospects, consistent with how we measure and forecast our performance, especially when comparing such results to previous periods or forecasts. We use Adjusted EBITDA and Segment EBITDA before corporate overhead as non-GAAP financial measures, in addition to GAAP financial measures, as the basis for measuring our core operating performance and comparing such performance to that of prior periods and to the performance of our competitors. These measures are also used by us in our financial and operational decision making. There are limitations associated with reliance on any non-GAAP financial measures because they are specific to our operations and financial performance, which makes comparisons with other companies’ financial results more challenging. By providing both GAAP and non-GAAP financial measures, we believe that investors are able to compare our GAAP results to those of other companies, while also gaining a better understanding of how we evaluate our operating performance. ($ in millions) Reconciliation of Non-GAAP Financial Measures ©2013 Digital Generation Inc. All rights reserved FY FY FY FY FY Q4 Q4 2008 2009 2010 2011 2012 2011 2012 Income from Operations $ 37.7 $ 47.3 $ 81.8 $ 68.3 $(177.2) $ 23.9 $ 4.2 Stock based compensation 1.2 4.0 4.8 12.4 17.5 4.8 3.7 Depreciation and amortization 21.4 26.5 29.2 38.7 57.3 13.0 15.9 Transaction Expenses - - 0.3 15.1 8.5 1.3 3.0 Goodwill Impairment - - - - 219.6 - 11.4 Adjusted EBITDA $ 60.3 $ 77.8 $116.1 $134.6 $ 125.7 $ 43.1 $ 38.1 Less: Corporate Overhead (13.5) (13.7) (18.6) (18.7) (26.6) (5.0) (6.6) Segment EBITDA $ 73.8 $ 91.5 $134.7 $153.3 $ 152.3 $ 48.1 $ 44.7 TV Segment EBITDA $138.3 $ 129.6 $ 37.4 $ 33.5 Online Segment EBITDA $ 15.0 $ 22.7 $ 10.7 $ 11.2 |