Attached files
| file | filename |
|---|---|
| EX-31.2 - EX-31.2 - Digital Generation, Inc. | a2202100zex-31_2.htm |
| EX-32.1 - EX-32.1 - Digital Generation, Inc. | a2202100zex-32_1.htm |
| EX-31.1 - EX-31.1 - Digital Generation, Inc. | a2202100zex-31_1.htm |
| EX-21.1 - EX-21.1 - Digital Generation, Inc. | a2202100zex-21_1.htm |
| EX-23.1 - EX-23.1 - Digital Generation, Inc. | a2202100zex-23_1.htm |
Use these links to rapidly review the document
TABLE OF CONTENT
INDEX TO FINANCIAL STATEMENTS
UNITED STATES
SECURITIES AND EXCHANGE COMMISSION
Washington, D.C. 20549
FORM 10-K
| (Mark One) | ||
ý |
ANNUAL REPORT PURSUANT TO SECTION 13 OR 15(d) OF THE SECURITIES EXCHANGE ACT OF 1934 |
|
For the fiscal year ended December 31, 2010 |
||
or |
||
o |
TRANSITION REPORT PURSUANT TO SECTION 13 OR 15(d) OF THE SECURITIES EXCHANGE ACT OF 1934 |
|
For the transition period from to |
||
Commission file number: 0-27644
DG FastChannel, Inc.
(Exact name of registrant as specified in its charter)
| Delaware (State or other jurisdiction of incorporation or organization) |
94-3140772 (I.R.S. Employer Identification No.) |
|
750 West John Carpenter Freeway, Suite 700 Irving, Texas (Address of principal executive offices) |
75039 (Zip Code) |
(972) 581-2000
(Registrant's telephone number, including area code)
Securities registered pursuant to Section 12(b) of the Act:
| Title of each class | Name of each exchange on which registered | |
|---|---|---|
| Common Stock | NASDAQ Global Select Market |
Securities registered pursuant to section 12(g) of the Act: None
Indicate by check mark if the registrant is a well-known seasoned issuer, as defined in Rule 405 of the Securities Act. Yes o No ý
Indicate by check mark if the registrant is not required to file reports pursuant to Section 13 or Section 15(d) of the Exchange Act. Yes o No ý
Indicate by check mark whether the registrant (1) has filed all reports required to be filed by Section 13 or 15(d) of the Securities Exchange Act of 1934 during the preceding 12 months (or for such shorter period that the registrant was required to file such reports) and (2) has been subject to such filing requirements for the past 90 days. Yes ý No o
Indicate by check mark whether the registrant has submitted electronically and posted on its corporate Web site, if any, every Interactive Data File required to be submitted and posted pursuant to Rule 405 of Regulation S-T (§ 232.405 of this chapter) during the preceding 12 months (or for such shorter period that the registrant was required to submit and post such files). Yes o No o
Indicate by check mark if disclosure of delinquent filers pursuant to Item 405 of Regulation S-K is not contained herein, and will not be contained, to the best of registrant's knowledge, in definitive proxy or information statements incorporated by reference in Part III of this Form 10-K or any amendment to this Form 10-K. ý
Indicate by check mark whether the registrant is a large accelerated filer, an accelerated filer, a non-accelerated filer, or a smaller reporting company. See the definitions of "large accelerated filer," "accelerated filer" and "smaller reporting company" in Rule 12b-2 of the Exchange Act.
| Large accelerated filer ý | Accelerated filer o | Non-accelerated filer o (Do not check if a smaller reporting company) |
Smaller reporting company o |
Indicate by check mark whether the registrant is a shell company (as defined in Rule 12b-2 of the Exchange Act). Yes o No ý
The aggregate market value of the voting and non-voting common equity held by non-affiliates of the registrant (assuming for these purposes, but without conceding, that all executive officers and directors are "affiliates" of the registrant) as of June 30, 2010, the last business day of the registrant's most recently completed second fiscal quarter, was $ (based on the closing sale price of the registrant's common stock on that date as reported on the NASDAQ Global Select Market).
As of February 28, 2011 the registrant had 27,929,946 shares of common stock outstanding.
DOCUMENTS INCORPORATED BY REFERENCE
Part III incorporates certain information by reference to the registrant's definitive proxy statement or amendment to this Form 10-K to be filed within 120 days of year end as required.
Cautionary Note Regarding Forward-Looking Statements
The Securities and Exchange Commission ("SEC") encourages companies to disclose forward-looking information so that investors can better understand a company's future prospects and make informed investment decisions. Certain statements contained herein may be deemed to constitute "forward-looking statements."
Words such as "may," "anticipate," "estimate," "expects," "projects," "future," "intends," "will," "plans," "believes" and words and terms of similar substance used in connection with any discussion of future operating or financial performance, identify forward-looking statements. All forward-looking statements are management's present expectations of future events and are subject to a number of risks and uncertainties that could cause actual results to differ materially from those described in the forward-looking statements. These risks and uncertainties include, among other things:
- •
- our potential inability to further identify, develop and achieve commercial success for new products;
- •
- the possibility of delays in product development;
- •
- the development of competing distribution products;
- •
- our ability to protect our proprietary technologies;
- •
- patent-infringement claims;
- •
- risks of new, changing and competitive technologies; and
- •
- other factors discussed elsewhere herein under the heading "Risk Factors."
In light of these assumptions, risks and uncertainties, the results and events discussed in the forward-looking statements contained herein might not occur. You are cautioned not to place undue reliance on forward-looking statements, which speak only as of the date of this filing. We are not under any obligation, and we expressly disclaim any obligation, to update or alter any forward-looking statements, whether as a result of new information, future events or otherwise, except as may be required by applicable law. All subsequent forward-looking statements attributable to management or to any person authorized to act on our behalf are expressly qualified in their entirety by the cautionary statements contained or referred to in this section.
2
3
DG FastChannel, Inc. (the "Company," "we," "us" or "our") is a leading provider of digital technology services that enable the electronic delivery of advertisements, syndicated programs, and video news releases to traditional broadcasters, online publishers and other media outlets. We operate three nationwide digital networks out of our Network Operation Centers ("NOCs"), located in Irving, Texas ("Irving NOC"), Atlanta, Georgia ("Atlanta NOC") and Jersey City, New Jersey ("New Jersey NOC"), which link more than 5,000 advertisers, advertising agencies and content owners with more than 29,000 television, radio, cable, print and web publishing destinations electronically throughout the United States, Canada, and Europe. Through our NOCs, we deliver video, audio, image and data content that comprise transactions among advertisers, content owners, and various media outlets, including those in the broadcast industries. We offer a variety of other ancillary products that serve the advertising industry.
For the year ended December 31, 2010, we provided delivery services for 23 of the top 25 advertisers, as ranked by Ad Age. The majority of our revenue is derived from multiple services relating to the electronic delivery of video and audio advertising content. Our primary source of revenue is the delivery of television and radio advertisements, or spots, which are typically performed digitally but sometimes physically. We offer a digital alternative to the dub and ship delivery method of spot advertising. We generally bill our services on a per transaction basis.
Our services include online creative research, media production and duplication, distribution, management of existing advertisements and broadcast verification. This suite of innovative services addresses the needs of our customers at multiple stages along the value chain of advertisement creation and delivery in a cost-effective manner and helps simplify the overall process of content delivery. Information regarding our business segments is presented in the Consolidated Financial Statements filed herewith.
We were organized in 1991 as a Delaware corporation. Over the past five fiscal years, we have completed several strategic transactions including the following:
- •
- On May 31, 2006, we completed a tax-free merger transaction with privately-held FastChannel
Network, Inc. ("FastChannel") whereby FastChannel became a wholly-owned subsidiary of ours. The $28.8 million purchase price consisted of 5.2 million shares of our common stock
valued at $27.4 million and $1.4 million of transaction costs. Similar to us, FastChannel operated a digital distribution network serving the advertising and broadcast industries. The
merger with FastChannel expanded our electronic network, increased our customer base, and resulted in operating synergies.
- •
- On June 4, 2007, we acquired privately-held Pathfire, Inc. ("Pathfire") for $29.7 million
in cash. Pathfire distributes third-party long-form content, such as news and syndicated programming, through a proprietary server-based network via satellite and Internet channels. The
acquisition increased our customer base and resulted in operating synergies.
- •
- In December 2006 and early 2007, we acquired an approximate 16% interest in Point.360. On August 13, 2007, we completed the purchase of all of the issued and outstanding shares of common stock of Point.360 that we did not already own (approximately 84%) in exchange for 2.0 million shares of our common stock. In the aggregate, the total purchase price was valued at $49.7 million. The acquisition increased our customer base and resulted in operating synergies. Immediately prior to the exchange, Point.360 spun off its post-production operations to its
4
- •
- On August 31, 2007, we acquired substantially all the assets of privately-held GTN, Inc. ("GTN")
for $11.5 million in cash (including transaction costs). GTN provided media services in Detroit, Michigan and was focused on the automotive advertising market. GTN also had post production
operations that we sold immediately following the closing of the acquisition for $3.0 million in cash. The acquisition increased our customer base and resulted in operating synergies.
- •
- On June 5, 2008, we completed the acquisition of substantially all the assets and certain liabilities of the Vyvx
advertising services business ("Vyvx"), including its distribution, post-production and related operations, from Level 3 Communications, Inc. ("Level 3") for
approximately $135.4 million in cash (including transaction costs). Vyvx operated an advertising services and distribution business similar to our video and audio content distribution business.
The purpose of the acquisition was to expand our customer base and operations, and resulted in operating synergies.
- •
- In May 2007 we acquired 10.8 million shares, or 13% of the then outstanding shares, of Enliven Marketing
Technologies Corporation's ("Enliven") common stock. On October 2, 2008, we completed a merger with Enliven. Pursuant to the merger agreement, as amended, we exchanged 0.033 of a share of our
common stock for each of the approximately 88 million shares of Enliven common stock outstanding and not previously held by us. In the aggregate, we issued approximately 2.9 million
shares of our common stock in the exchange. In total, including shares of Enliven previously held, the purchase price was $74.6 million. The purpose of the acquisition was to expand our
customer base and service offerings.
- •
- On October 1, 2010, we acquired the assets and operations of privately-held Match Point Media LLC and its divisions, Treehouse Media Services, Inc. and Voltage Video, Inc. (collectively referred to as "Match Point"), a market leader in the customization and distribution of direct response advertising, for $27.7 million in cash, which includes $1.0 million paid into escrow related to a potential earnout obligation. Depending on Match Point's future revenues, we may be required to pay up to $3.0 million under the earnout obligation. Match Point provides media advertising services to advertising agencies and advertisers participating in the direct response advertising industry and is part of our video and audio content distribution segment. We acquired Match Point to expand our customer base and product offerings. The acquisition also gives us an opportunity to bring digital distribution and digital workflow solutions to the direct response marketplace which will likely result in operating synergies.
shareholders (other than us), such that on the closing date, Point.360 consisted solely of an advertising distribution services business.
We file quarterly and annual reports, proxy statements and other documents with the Securities and Exchange Commission ("SEC") under the Securities Exchange Act of 1934 (the "Exchange Act").
The public may read and copy any materials that we file with the SEC at the SEC's Public Reference Room at 100 F Street N.E., Washington, D.C. 20549. The public may obtain information on the operation of the Public Reference Room by calling the SEC at 1-800-SEC-0330. Also, the SEC maintains a website that contains reports, proxy and information statements, and other information regarding issuers, including us, that file electronically with the SEC. The public can obtain any documents that we file with the SEC at http://www.sec.gov.
We also make available free of charge through our website (www.dgit.com) our Annual Report on Form 10-K, Quarterly Reports on Form 10-Q, Current Reports on Form 8-K, and, if applicable, amendments to those reports filed or furnished pursuant to the Exchange Act as soon as reasonably practicable after we electronically file such material with, or furnish it to, the SEC.
5
There are approximately 11,000 commercial radio and 4,800 television, cable and network broadcast stations in the United States and Canada. These stations primarily generate revenue by selling airtime to advertisers. In addition, there are approximately 8,400 daily and weekly newspapers in circulation in the United States. Newspapers also primarily generate revenues from advertising. Further, there are over 5,000 online publishers operating in the United States and Canada. Advertising is most frequently produced under the direction of advertising agencies for large national or regional advertisers or by station personnel for local advertisers. Television advertising is characterized as network or spot, depending on how it is purchased and distributed. Network advertising typically is delivered to stations as part of a network feed (bundled with network programming), while spot advertising is delivered to stations independently of other programming content.
Advertising agencies and advertisers use third-party service companies to ensure their media assets are delivered to multiple broadcast destinations on a time-sensitive basis. Certain advertising campaigns can be extremely complex and include dozens of commercial television and radio spots which may require delivery to hundreds of discrete media locations across the United States. Additionally, advertising agencies and advertisers require certain quality control standards, web-based order management capabilities and certain tagging/editing functions by the third party service provider. Finally, these service providers must offer immediate confirmation of the delivery of the commercial content to the media outlet and detailed billing services.
Broadcast media time is typically purchased by advertising agencies or media buying firms on behalf of advertisers. Advertisers, their agencies and media buying firms select individual stations or groups of stations to support marketing objectives, which usually are based on the stations' geographic and demographic characteristics. The actual commercials or spots are typically produced at a digital production studio and recorded on digital tape. Variations of the spot intended for specific demographic groups are also produced at this time. The spots undergo a review of quality and content before being cleared for distribution to broadcast stations, and can be delivered physically, via the traditional dub and ship method, or electronically.
While many television and radio broadcasters now embrace digital technology for much of their production processes and in-station media management, current methods for the distribution of video and audio advertising content still include manual duplication and physical delivery of analog tapes. Many companies, commonly known as dub and ship houses, duplicate video and audio tapes, assemble them according to agency specified bills of material and package them for air express delivery. Advertisers and their agencies can choose to have advertising content delivered electronically via the Internet and satellite transmissions. Electronic transmission has several advantages over dub and ship delivery, including: cost, transmission time, labor, materials, quality of content and control of distribution. The amount of advertising content transmitted electronically has steadily increased, and we estimate that approximately 95% of radio spots and approximately 65% of video spots are now electronically distributed. We believe that these figures will continue to grow as advertisers continue to take advantage of the benefits of electronic distribution.
Television and radio continue to attract significant portions of the advertising dollars spent by advertisers and advertising agencies and represent powerful mediums for cost-effectively reaching large, targeted audiences and offer the accountability and returns that advertisers increasingly demand.
The unique capabilities of online advertising, the growing number of Internet users and increased Internet traffic have contributed to the rapid growth in online advertising spending over the last several years. According to eMarketer, an advertising trade journal, online advertising represented 13.9% of the total United States advertising market in 2009. ZenithOptimedia predicts worldwide online advertising spending will increase to 17.9% of the total worldwide advertising market by 2013. Additionally, according to the ZenithOptimedia, global online advertising expenditures are projected to
6
grow from $61.8 billion in 2010 to $91.5 billion in 2013, representing a compound annual growth rate of 13.9%. eMarketer predicts online advertising expenditures in the United States are to grow from $22.7 billion in 2009 to $40.5 billion in 2014, representing a compound annual growth rate of 12.3%.
While historically a large component of the online advertising market growth was driven by Internet-centric publishers, retailers and direct marketing providers, traditional media advertisers, including consumer packaged goods and brand advertisers, are increasingly recognizing the significance and unique capabilities of the Internet and are allocating more of their marketing budgets to online advertising. The growth in online advertising is also being driven by strong increases in online brand marketing through display ads, rich media and video ads. While the majority of online advertising spending is still allocated to direct response campaigns, including paid search ads, classifieds, e-mail advertising and lead generation or referrals, advertisers are increasingly recognizing the potential offered by the unique branding capabilities of the Internet. As a result, many advertisers seek to utilize innovative media formats to create highly engaging brand experiences for their online customers.
According to eMarketer, online video and rich media advertising continue their year over year growth. Online video advertising is expected to be the fastest growing advertising format in the United States and spending is projected to increase from $1.0 billion in 2009 to over $5.5 billion in 2014, representing a compound annual growth rate of 40.3%. Emerging media formats and channels, such as mobile devices, game consoles and on-demand television, provide significant opportunities for advertisers to expand audience reach and strengthen their relationship with their target audience in innovative ways. Rich media advertising in the United States is expected to grow from $1.5 billion in 2009 to $1.8 billion in 2014 yielding a compound annual growth rate of 3.7%.
Through our suite of innovative services, we seek to address the needs of advertisers at various stages along the value chain of advertisement creation and delivery. These include idea generation, production and duplication, content distribution, media asset management and broadcast verification products. By offering services that encompass multiple stages of content creation and delivery, we are able to simplify the workflow process for advertisers. We believe our solutions offer advertisers tools essential to the creation and strategic distribution of advertisements in a cost-effective manner. We continually upgrade our systems to meet our customers' needs. During the years ended December 31, 2010, 2009 and 2008 we spent $10.6 million, $6.3 million and $4.3 million, respectively, on research and development activities, none of which were sponsored by customers. Our services address our clients' needs for efficient, accurate and reliable solutions for the development and delivery of advertising content across a wide spectrum of media, and include the following offerings:
Advertising Distribution. We provide primarily electronic and, to a lesser extent, physical distribution of broadcast advertising content to broadcast stations throughout the United States and Canada. We operate a digital network, currently connecting more than 5,000 advertisers and advertising agencies with approximately 4,800 television, cable and network broadcast destinations, approximately 11,000 radio stations, and approximately 8,400 daily and weekly newspapers in circulation and over 5,000 online publishers operating in the United States and Canada. Our network enables the rapid, cost-effective and reliable electronic transmission of video and audio spots and other content and provides a high level of quality, accountability and flexibility to both advertisers and broadcasters. Our technologically advanced digital network delivers near master quality video and audio to broadcasters, which is equal or superior to the content currently delivered on dub and ship analog tapes. Our network routes transmissions to stations through an automated online transaction and delivery system, enabling delivery in as little as one hour after an order is received.
- •
- Video. We receive video content electronically primarily via our proprietary file transfer software that is deployed in post production studios. Video content also can be ingested through our
7
- •
- Audio. Audio content can be uploaded via the Internet
electronically. In addition, audio can be received using our Upload Internet audio collection system. Audio transmissions are delivered over the Internet via our SpotCentral audio application that
allows the radio stations to download the radio spots on demand.
- •
- Print. Print content can be uploaded via the Internet electronically into our print media distribution system. Print transmissions are delivered over the Internet to various newspaper locations via proprietary web-based software applications. The print transmissions are modified to the specific format as required by the individual newspapers.
various regional operations facilities throughout the United States. When video content is received, our employees conduct a quality control of the content, digitize the material and upload the content to our NOC, where it is combined with the customer's electronic transaction to transmit the various combinations of video to designated television stations. Video transmissions are sent via a high-speed fiber link to the digital satellite uplink facility over which they are then delivered directly to our servers, including our HD Xtreme™ servers, that we have placed in television stations and cable interconnects.
Video and audio transmissions are received at designated television and radio stations on DG FastChannel Spot Boxes, Client Workstations and Digital Media Managers. The servers enable stations to receive and play back material delivered through our digital distribution network. The units are owned by us and typically installed in the master control or production area of the stations. Upon receipt, station personnel generally review the content and transfer the spot to a standardized internal format for subsequent broadcast. Through our NOCs, we monitor the spots stored in each of our servers and ensure that space is always available for new transmissions. We can quickly transmit video or audio at the request of a station or in response to a customer who wishes to alter an existing order, allowing us to effectively adapt to customer needs and to distribute to hundreds of locations in as little as one hour, which would be impossible for traditional physical dub and ship houses.
We offer various levels of digital video and audio distribution services to advertisers distributing content to broadcasters. These include the following: DGFC Priority, a service which guarantees arrival of the first spot on an order within one hour; DGFC Express, which guarantees arrival within four hours; DGFC Standard, which guarantees arrival by noon the next day; and DGFC Economy, which guarantees arrival by noon on the second day. We also offer a set of premium services enabling advertisers to distribute video or audio spots provided after normal business hours. We generally charge a fee per delivery for our advertising distribution service, which varies based on the service level ordered by the customer.
In addition to our standard services, we have developed unique products to service customers with particular time-sensitive delivery needs, including the delivery of political advertising during election campaigns, providing a rapid response mechanism for candidates and issue groups. We also provide advertising services to advertising agencies and advertisers participating in the direct response industry.
Online Advertising Solutions. We offer an online advertising campaign management and deployment product known as the "Unicast Advertising Platform" ("UAP"). UAP permits publishers, advertisers, and their agencies to manage the complex process of deploying online advertising campaigns. This process includes creating the advertising assets, selecting the sites on which the advertisements will be deployed, setting the campaign parameters (ad rotation, the frequency with which an ad may be deployed, and others), deployment, and tracking of campaign results.
The UAP integrates creative assembly with campaign management and detailed performance analysis. In addition, UAP has the broad capabilities to deliver multiple ad formats and media types, including several different video formats, 3D content, and all major "rich media" formats.
8
UAP is "technology agnostic," meaning it delivers advertisements that utilize all major technologies and formats. UAP offers a suite of products including Unicast Transitional (full screen and partial screen video and interactive ads that are shown to consumers as they navigate between pages), Unicast In-Page (video and interactive ads embedded within web pages including standard and expandable banners, pre-roll and post-roll ads), and Unicast Over-the-Page (video and interactive ads that "float"/play over the top of an Internet site page).
We offer these advertising formats delivered through the UAP to customers, charging them in the standard manner consistent with industry practices with fees based on the number of times an advertisement is deployed (i.e., on a "CPM", or cost per thousand impression basis). CPM fees vary by type of advertisement, with static ads realizing relatively low fees and rich media ads—particularly video ads—realizing higher fees. Rates charged for advertising ranged from $0.02 to $8.44 per thousand impressions in 2010.
Long-form Programming Distribution. We also deliver digital video broadcast services through our Digital Media Gateway® ("DMG") owned and operated by Pathfire, our wholly-owned subsidiary. The DMG consists of hardware and a suite of software applications that enable content creators and distributors to ingest, digitize, transport, store and prepare digital video media assets for broadcast. The DMG incorporates a sophisticated IP multicast network of satellites and can deliver all forms of video content including news, Video News Releases ("VNR"s), syndicated programming, infomercials, and Electronic Press Kits ("EPK"s). Another feature of the DMG is a terrestrial-based return-path network, which automatically tracks and notifies the Atlanta NOC of transmission failures, system health problems and content usage data. When notified of a transmission failure, the system automatically resends lost data packets using the minimum bandwidth necessary to complete the transmission. The DMG also uses the terrestrial network to send notification that the complete digital video transmission has been received in the DMG server at the broadcast television station. This system is fully automated and involves only minimal intervention by station technicians and customer support staff.
The DMG platform consists of both hardware and software applications. These applications are responsible for three main tasks: managing the flow of digital video content from its source to Pathfire-enabled digital uplinks; managing the transmission of digital video content using Pathfire's IP multicast store-and-forward software algorithms from the digital uplink system to DMG caching servers at the stations; and managing the workflows for video assets from the DMG caching servers through various station systems.
For syndicated television shows and movies, Pathfire created Pathfire DMG Syndication. The application suite enables syndicators to deliver, track, manage and verify both standard definition and high definition programming to broadcast stations more efficiently. By automating processes, providing tracking information and greatly reducing missed feeds, Pathfire Syndication facilitates content delivery between syndicators and stations. Automated content delivery to broadcast stations through the Pathfire network minimizes the need to schedule or monitor satellite feeds and eliminates the need for tape. Broadcast-quality content arrives on Pathfire servers at stations, where users can access and manage content and metadata through the DMG desktop application. Pathfire DMG Syndication also integrates with existing downstream gear and helps with automation tasks at the station reducing manual labor costs. Pathfire DMG Syndication delivers frame-accurate timing sheets and desktop control for program directors and traffic managers, significantly reducing show preparation labor because station personnel no longer have to manually time syndicated show segments.
Online Creative Research. We own and maintain an online database of content and credits of U.S. television commercials for the advertising and TV commercial production industry. We believe that this is the most comprehensive online television commercial information service available to advertising agencies and production companies. Our SourceEcreative database includes information relating to
9
commercials, individuals and companies. Customers can use our robust search engine specifically designed for the advertising industry. SourceEcreative allows users to find out which director, post house, composer or other production resource worked on specific spots, enabling advertising agencies to identify creative and production resources, and to accelerate their creative development process. Information can be provided via fax, phone, e-mail or over the Internet. SourceEcreative services most of the major U.S. advertising agencies and production companies, as well as television networks, programs and industry associations.
Creative and Digital Marketing Solutions In 2008, as part of our Enliven acquisition, we acquired Springbox, Ltd. ("Springbox"), an Austin-based interactive marketing firm with expertise in digital web marketing and creative solutions that provides fee-based professional services for creating content and implementing visualization solutions. Springbox provides web based marketing solutions for numerous global clients. Springbox was acquired to align with our strategy to enhance our web based product offerings, in order to meet the escalating demand for creative digital and Internet solutions from our clients. Springbox provides creative solutions that can be leveraged across the UAP and integrated with our premium rich media ad delivery capabilities. This combined offering is the next evolution of our business, and will better position us to take advantage of the market opportunity for integrated online marketing solutions.
Springbox allows us to provide full service interactive marketing solutions for our clients. Additionally, the division supports the development of advanced advertising formats and advertising content making the UAP more appealing to marketers. Finally these services keep us on the cutting-edge of the industry, giving us hands-on experience with the design, creation and deployment of rich media websites.
Media Production and Duplication. Our production and duplication capabilities allow us to provide customers with ancillary services, which are offered in addition to our primary distribution service. Our services include storage of client masters or storyboards, editing of materials, tagging content, dubbing, video duplication and copying of media onto various physical multimedia formats, such as CD, DVD or tape. We believe these add-on service offerings allow us to better service our customers by reducing the number of vendors necessary to create and distribute advertisements.
Media Asset Management. Our digital media asset management solution simplifies spot management, access, storage and collaboration for our customers. Our media asset management solution is integrated with our distribution system, enabling automatic archiving of trafficked spots, online search, send-for-review and review-and-approval capabilities, automated digital storyboarding, streaming previews, a comprehensive order and market data history for each spot, script attachment capability and online search, sort, retrieve and hardcopy fulfillment.
A large portion of our revenue is derived from the delivery of spot television and radio advertising to broadcast stations, cable systems and networks. We derive revenue from brand advertisers and advertising agencies, and from our marketing partners, which are typically dub and ship houses that have signed agreements with us to consolidate and forward the deliveries of their advertising agency customers to broadcast stations, cable systems and networks via our electronic delivery service in exchange for price discounts from us. The relative volumes of advertisements distributed by us are representative of the five leading national advertising categories of automotive, retail, business and consumer services, food and related products and entertainment. The volume of advertising from these segments is subject to seasonal, quarterly, and cyclical variations. No single customer accounts for more than 10% of our annual revenue.
10
Sales, Marketing and Customer Service
Brand Strategy. Our brand strategy is to position our services as the standard transaction method for the television, radio, cable, and network broadcast industries. We focus our marketing messages and programs at multiple segments within the advertising and broadcast industries. Each of the segments interacts with us for a different reason. Agencies purchase services from us on behalf of their advertisers. Production studios facilitate the transmission of video and audio to either the Irving or Atlanta NOCs. We operate a separate NOC in New Jersey for our online advertising solutions business. Production studios and dub and ship houses resell delivery services to agencies. Stations join the network to receive the content from their customers: the agencies and advertisers.
Internet/E-Commerce Strategy. SpotCentral provides advertisers and agencies with an intuitive web portal to visualize and manage the distribution of their valuable advertising content. Users can upload spots, choose or create new destination groups, attach traffic instructions, view invoices, distribute media electronically to thousands of destinations across our massive digital network and confirm delivery at the station level through our powerful media server, the DG FastChannel Spot Box. Users have immediate access to key statistics, order status and other data, while workflow automation tools help user groups save routing instructions and destination paths for repeat orders. Users can search billing history and view invoices from any web-connected location. Customized search features let users research order history by brand, service level or transmission date. In addition, spots can be previewed at any time of the day or point in the order process. This design introduces new levels of simplicity, transparency, accountability and customer satisfaction to the spot distribution process.
Sales. We employ a direct sales force that calls on various departments at advertising agencies to communicate the capabilities and comparative advantages of our electronic distribution system, ad serving platform, and related products and services. In addition, our sales force calls on corporate advertisers who are in a position to either direct or influence agencies in directing deliveries to us. A separate staff sells to and services video and audio dealers, who resell our distribution services. We currently have regional sales offices in New York, Los Angeles and Chicago. Our sales force includes regional sales, inside sales, and telemarketing personnel.
Marketing. Our marketing programs are directed to stimulate demand with an emphasis on popularizing the benefits of digital delivery, including fast turnaround (same day services), increased flexibility, higher quality, and greater reliability and accountability. These marketing programs include direct mail and telemarketing campaigns, newsletters, collateral material (including brochures, data sheets, etc.), application stories, and corporate briefings in major United States cities. We also engage in public relations activities including trade show participation, the stimulation of articles in the trade and business press, press tours and advertisements in advertising and broadcast oriented trade publications.
We market to broadcast stations to arrange for the placement of our DG FastChannel Spot Boxes for the receipt of video advertisements.
Customer Service. Our approach to customer service is based on a model designed to provide focused support from key market centered offices, located in Los Angeles, Dallas, Chicago, Detroit, New York and San Francisco. Clients work with specific, assigned account coordinators to place production service and distribution orders. National distribution orders are electronically routed to the NOCs for electronic distribution or, for off-line destinations, to our national duplication center in Louisville, Kentucky. Our distributed service approach provides direct support in key market cities enabling us to develop closer relationships with clients as well as the ability to support client needs for local production services. We also maintain a customer service team dedicated to supporting the needs of radio, television, and network stations. This support is available 7 days a week, 24 hours a day, to respond to station requests for information, traffic instructions or additional media. Providing direct support alleviates the need for client traffic departments to deal with individual stations or the challenges of staffing for off-hours support. Our customer service operation centers are linked to our
11
order management and media storage systems, and national distribution network. These resources enable us to manage the distribution of client orders to the fulfillment location best suited to meet critical customer requirements as well as providing order status and fulfillment confirmation. This distribution model also provides us with significant redundancy and re-route capability, enabling us to meet customer needs when weather or other conditions prevent deliveries using traditional courier services.
Competition within the markets for media distribution is intense. In our advertising distribution business, numerous companies already distribute video and other content to a variety of destinations. Companies such as Google TV Ads, Comcast, and Deluxe Entertainment Group (who recently purchased certain Ascent Media assets) deliver television advertising spots to satellite TV systems, broadcast TV stations, cable networks and/or cable head ends. At the same time, many companies, including Akamai and Limelight Networks are implementing technologies to distribute video to the established traditional channels and new media outlets. Additionally, numerous companies are offering technologies to distribute video content through a variety of means including software-only solutions at broadcast TV stations. For example, Extreme Reach, Hula MX, and Yangaroo use "over the top" technology to distribute television advertising spots to broadcast TV stations, cable networks and/or cable head ends.
We also compete with a variety of dub and ship houses and production studios that have traditionally distributed taped advertising spots via physical delivery. As local distributors, these entities have long-standing ties with advertising agencies that are often difficult for us to replace. In addition, these dub and ship houses and production studios often provide an array of ancillary video services, including archival storage and retrieval, closed captioning and format conversions, enabling them to deliver to their advertiser and agency customers a full range of customizable, media post-production, preparation, distribution and trafficking services. We plan to continue pursuing potential dub and ship house partners where such partnerships make strategic sense.
In our advertising distribution business, we compete with dub and ship houses across the country but additionally with one or more satellite-based video distribution networks. We also anticipate that certain common and/or value-added telecommunications carriers may develop and deploy high bandwidth network services targeted at the advertising and broadcast industries, although we believe that no such carriers have yet begun spot advertising distribution.
In our long-form syndication business, we compete with Pitch Blue, a service offered by a joint venture among Deluxe Entertainment Group (who recently purchased certain Ascent Media assets), Warner Brothers Technical Division and CBS. We also compete with a satellite digital linear process whereby the content owner can manually deliver single feeds directly to broadcast TV stations. We compete with other companies that are focusing or may in the future focus significant resources on developing and marketing products and services that will compete with ours. We believe that our ability to compete successfully depends on a number of factors, both within and outside of our control, including: (1) the price, quality and performance of our products and those of our competitors; (2) the timing and success of new product introductions; (3) the emergence of new technologies; (4) the number and nature of our competitors in a given market; (5) the protection of intellectual property rights; and (6) general market and economic conditions.
Competitors in our online advertising solution business include full service advertising delivery companies like Microsoft and Google. Additionally, certain companies specialize in delivering rich media and video advertisements like Pointroll (a division of Gannett), EyeWonder (a division of Limelight Networks), MediaMind, formerly known as Eyeblaster, and Flashtalking. Competitors in the services sector include advertising agencies, online agencies and independent creative talent that can build content in the Unicast format or in other rich media formats.
12
We expect competition to continue to intensify as existing and new competitors begin to offer products, services, or systems that compete with our products and services. Our current or future competitors, many of whom, individually or together with their affiliates, have substantially greater financial resources, research, and development resources, distribution, marketing, and other capabilities than us, may apply these resources and capabilities to compete successfully against our products and services. A number of the markets in which we sell our products and services are also served by technologies that currently are more widely accepted than ours. Although we believe that our products and services are less expensive to use and more functional than competing products and services that rely on other technologies, it is uncertain whether our potential customers will be willing to make the initial capital investment that may be necessary to convert to our products and services. The success of our systems against these competing technologies depends in part upon whether our systems can offer significant improvements in productivity and sound and video quality in a cost-effective manner. It is uncertain whether our competitors will be able to develop systems compatible with, or that are alternatives to, our proprietary technology or systems. It is also not certain that we will be able to compete successfully against current or future competitors or that competitive pressures faced by us will not materially adversely affect our business, operating results, or financial condition.
Intellectual Property and Proprietary Rights
We primarily rely upon a combination of copyright, trademark and trade secret laws and license agreements to establish and protect proprietary rights in our technologies. We currently have 55 patents issued with expiration dates ranging from March 2016 to May 2026 and 12 other patent applications pending. We also have 71 trademark registrations, 15 trademark applications and approximately 30 copyright registrations.
As of December 31, 2010, we had a total of 897 employees, including 147 in research and development, 62 in sales and marketing, 590 in operations, and 98 in finance and administration; 879 of these employees are located in the United States and 18 are located in the United Kingdom. Our employees are not represented by a collective bargaining agreement and we have not experienced a work stoppage. We consider our relations with our employees to be good.
Our business and prospects depend in significant part upon the continued service of our key management, sales and marketing and administrative personnel. The loss of key management or technical personnel could materially adversely affect our operating results and financial condition. We believe that our prospects depend in large part upon our ability to attract and retain highly skilled managerial, sales and marketing and administrative personnel. Competition for such personnel is intense, and we may not be successful in attracting and retaining such personnel. Failure to attract and retain key personnel could have a material adverse effect on our operating results and financial condition.
In evaluating an investment in our Company, the following risk factors should be considered.
The media distribution products and services industry is divided into several distinct segments, some of which are relatively mature while others are growing rapidly. If the mature segments begin to decline at a time when the developing segments fail to grow as anticipated, it will be increasingly difficult to maintain profitability.
To date, our design and marketing efforts for our products and services have involved the identification and characterization of the broadcast market segments within the media distribution products and services industry that will be the most receptive to our products and services. We may not have correctly identified and characterized such markets and our planned products and services may not address the needs of those markets. Furthermore, our current technologies may not be suitable for
13
specific applications within a particular market and further design modifications, beyond anticipated changes to accommodate different markets, may be necessary.
While the electronic distribution of media has been available for several years and growth of this market is modest, many of the products and services now on the market are relatively new. It is difficult to predict the rate at which the market for these new products and services will grow, if at all. Even if the market does grow, it will be necessary to quickly conform our products and services to customer needs and emerging industry standards in order to be a successful participant in those markets, such as the market for High Definition "HD" advertising spots. If the market fails to grow, or grows more slowly than anticipated, it will be difficult for any market participant to succeed and it will be increasingly difficult for us to maintain our current level of profitability.
To sustain profitability and growth, we must expand our product and service offerings beyond the broadcast markets to include additional market segments within the media distribution products and services industry. Potential new applications for our existing products in new markets include online video advertising networks, digital asset management, and business to consumer markets. While our products and services could be among the first commercial products that may be able to serve the convergence of several industry segments, including digital networking, telecommunications, compression products and Internet services, our products and services may not be accepted by that market. In addition, it is possible that:
- •
- the convergence of several industry segments may not continue;
- •
- the markets may not develop as a result of such convergence; or
- •
- if markets develop, such markets may not develop either in a direction beneficial to our products or product positioning or within the time frame in which we expect to launch new products and product enhancements.
Because the convergence of digital networking, telecommunications, compression products and Internet services is new and evolving, the growth rate, if any, and the size of the potential market for our products cannot be predicted. If markets for these products fail to develop, develop more slowly than expected or become served by numerous competitors, or if our products do not achieve the anticipated level of market acceptance, our future growth could be jeopardized. Broad adoption of our products and services will require us to overcome significant market development hurdles, many of which we cannot predict.
The industry is in a state of rapid technological change and we may not be able to keep up with that pace.
The advertisement distribution and management industry is characterized by extremely rapid technological change, frequent new products, service introductions and evolving industry standards. The introduction of products with new technologies and the emergence of new industry standards can render existing products obsolete and unmarketable. Our future success will depend upon our ability to enhance existing products and services, develop and introduce new products and services that keep pace with technological developments and emerging industry standards and address the increasingly sophisticated needs of our customers, including the need for "HD" advertising spots. We may not succeed in developing and marketing product enhancements or new products and services that respond to technological change or emerging industry standards. We may experience difficulties that could delay or prevent the successful development, introduction and marketing of these products and services. Our products and services may not adequately meet the requirements of the marketplace and achieve market acceptance. If we cannot, for technological or other reasons, develop and introduce products and services in a timely manner in response to changing market conditions, industry standards or other customer requirements, particularly if we have pre-announced the product and service releases, our business, financial condition, results of operations and cash flows will be harmed.
14
The marketing and sale of our products and services involve lengthy sales cycles. This makes business forecasting extremely difficult and can lead to significant fluctuations in quarterly results.
Due to the complexity and substantial cost associated with providing integrated product and services to provide audio, video, data and other information across a variety of media and platforms, licensing and selling products and services to our potential customers typically involves a significant technical evaluation. In addition, there are frequently delays associated with educating customers as to the productive applications of our products and services, complying with customers' internal procedures for approving large expenditures and evaluating and accepting new technologies that affect key operations. In addition, certain customers have even longer purchasing cycles that can greatly extend the amount of time it takes to place our products and services with these customers. Because of the lengthy sales cycle and the large size of our existing and potential customers' average orders, if revenues projected from existing and potentials customer for a particular quarter are not realized in that quarter, product revenues and operating results for that quarter could be harmed. Revenues will also vary significantly as a result of the timing of product and service purchases and introductions, fluctuations in the rate of development of new markets and new applications, the degree of market acceptance of new and enhanced versions of our products and services, and the level of use of satellite networking and other transmission systems. In addition, increased competition and the general strength of domestic and international economic conditions also impact revenues.
Because expense levels such as personnel and facilities costs are based, in part, on expectations of future revenue levels, if revenue levels are below expectations, our business, financial condition, results of operations and cash flows will be harmed.
We may be adversely affected by cyclicality or an extended downturn in the United States or worldwide economy in or related to the industries we serve.
Our revenues are generated primarily from providing traditional broadcast and online campaign management solutions and services to advertising agencies and advertisers across digital media channels and a variety of formats. Demand for these services tends to be tied to economic cycles, reflecting overall economic conditions as well as budgeting and buying patterns. For example, in 1999, advertisers spent heavily on Internet advertising, which was followed by a downturn in advertising spending on the Internet in 2002. In addition, during a period of economic weakness in 2001, advertising spending online decreased at a faster rate than overall ad spending, although we believe this was because many of the companies advertising online were Internet companies experiencing significant financial distress. Following the recent negative developments in the world economy, several agency and analyst organizations now predict that the growth in online advertising may be slower than previously expected. We cannot assure you that advertising budgets and expenditures by advertising agencies and advertisers will not decline in any given period or that advertising spending will not be diverted to more traditional media or other online marketing products and services, which would lead to a decline in the demand for our campaign management solutions and services. A decline in the economic prospects of advertisers or the economy in general could alter current or prospective customers' spending priorities. As a result, our revenues may not increase or may decline significantly in any given quarterly or annual period.
Seasonality in buying patterns also makes forecasting difficult and can result in widely fluctuating quarterly results.
Historically, the industry has experienced lower sales for services in the first quarter, which is somewhat offset with higher sales in the fourth quarter due to increased customer advertising volumes for the holiday selling season. In addition, product and service revenues are influenced by political advertising, which generally occurs every two years. Nevertheless, in any single period, product and service revenues and delivery costs are subject to significant variation based on changes in the volume and mix of deliveries performed during such period. In addition, we have historically operated with
15
little or no backlog. The absence of backlog and fluctuations in revenues and costs due to seasonality increases the difficulty of predicting our operating results.
The markets in which we operate are highly competitive, and competition may increase further as new participants enter the market and more established companies with greater resources seek to expand their market share.
Competition within the markets for media distribution is intense. In our advertising distribution business, numerous companies already distribute video and other content to a variety of destinations. Companies such as Google TV Ads, Comcast, and Deluxe Entertainment Group (who recently purchased certain Ascent Media assets) deliver television advertising spots to satellite TV systems, broadcast TV stations, cable networks and/or cable head ends. At the same time, many companies, including Akamai and Limelight Networks are implementing technologies to distribute video to the established traditional channels and new media outlets. Additionally, numerous companies are offering technologies to distribute video content through a variety of means including software-only solutions at broadcast TV stations. For example, Extreme Reach, Hula MX, and Yangaroo use "over the top" technology to distribute television advertising spots to broadcast TV stations, cable networks and/or cable head ends.
While we offer products and services focused on the electronic distribution of media, we compete with dub and ship houses and production studios. Many dub and ship houses and production studios, such as Deluxe Entertainment Group (who recently purchased certain Ascent Media assets), have long-standing ties to local distributors that can be difficult to replace. Many of these dub and ship houses and production studios could have greater financial, distribution and marketing resources than we and have achieved a higher level of brand recognition. Production studios, advertising agencies and media buying firms also could deliver directly through entities with package delivery expertise such as Federal Express, United Parcel Service and the United States Postal Service.
In our long-form syndication business, we compete with Pitch Blue, a service offered by a joint venture among Deluxe Entertainment Group (who recently purchased certain Ascent Media assets), Warner Brothers Technical Division and CBS. We also compete with a satellite digital linear process whereby the content owner can manually deliver single feeds directly to broadcast TV stations. In addition, we compete with one or more satellite-based video distribution networks. We also anticipate that certain common and/or value-added telecommunications carriers and other companies may develop and deploy high bandwidth network services targeted at the advertising and broadcast industries.
In our online advertising solution business we face formidable competition from other companies that provide solutions and services similar to ours. Currently, the primary online video competitors are Google and Microsoft. In March 2008, Google acquired DoubleClick and in May 2007, Microsoft acquired aQuantive. DoubleClick and aQuantive offer solutions and services similar to ours and compete directly with us. We expect that Google and Microsoft will use their substantial financial and engineering resources to expand the DoubleClick and aQuantive businesses and increase their ability to compete with us.
Google and Microsoft have significantly greater name recognition and greater financial, technical and marketing resources than we offer in our online advertising solution business. Microsoft also has a longer operating history and more established relationships with customers. In addition, we believe that both Google and Microsoft have a greater ability to attract and retain customers due to numerous competitive advantages, including their ability to offer and provide their marketing and advertising customers with a significantly broader range of related solutions and services than us. Google and Microsoft may also use their experience and resources to compete with us in a variety of ways, including through acquisitions of competitors or related businesses, research and development, and marketing for new customers more aggressively. Furthermore, Google or Microsoft could use campaign management solutions as a loss leader or may provide campaign management solutions or portions of such solutions without charge or below cost in order to encourage customers to use their other product
16
offerings. If Google or Microsoft is successful in providing solutions or services that are better than ours, leverage platforms more effectively than ours or that are perceived by customers as being more cost-effective, we could experience a significant decline in our customer base and in their use of our solutions and services. Such a decline could have a material adverse effect on our business, financial condition and results of operations.
In addition to Google and Microsoft, we face competition from other companies in our online advertising solutions business. Among our competitors are rich-media solutions companies (such as Pointroll, MediaMind, formerly known as Eyeblaster, EyeWonder, a division of Limelight Networks, and Flashtalking) and ad serving companies (such as Zedo and CheckM8). In addition, we may experience competition from companies that provide web analytics or web intelligence. Our competitors may develop services that are equal or superior to our services or that achieve greater market acceptance than our services. Many of our competitors have longer operating histories, greater name recognition, larger client bases and significantly greater financial, technical and marketing resources than us.
We believe that our ability to compete successfully with all of our service offerings depends on a number of factors, both within and outside of our control, including: (1) the price, quality and performance of our products and those of our competitors; (2) the timing and success of new product introductions; (3) the emergence of new technologies; (4) the number and nature of our competitors in a given market; (5) the protection of intellectual property rights; and (6) general market and economic conditions. In addition, the assertion of intellectual property rights by others factor into the ability to compete successfully. The competitive environment could result in price reductions that could result in lower profits and loss of our market share.
With respect to new markets, such as the delivery of other forms of content to television and radio stations, competition is likely to come from companies in related communications markets and/or package delivery markets. Some of the companies capable of offering products and services with superior functionality include telecommunications providers, such as AT&T, Verizon and other fiber and telecommunication companies, each of which would enjoy materially lower electronic delivery transportation costs. Radio networks such as ABC Radio Networks or Westwood One could also become competitors by selling and transmitting advertisements as a complement to their content programming.
Further, other companies may in the future focus significant resources on developing and marketing products and services that will compete with ours.
In addition, many of our current and potential competitors have established or may establish cooperative relationships among themselves or with third parties and several of our competitors have combined or may combine in the future with larger companies with greater resources than ours. This growing trend of cooperative relationships and consolidation within our industry may create a great number of powerful and aggressive competitors that may engage in more extensive research and development, undertake more far-reaching marketing campaigns and make more attractive offers to existing and potential employees and customers than we are able to. They may also adopt more aggressive pricing policies and may even provide services similar to ours at no additional cost by bundling them with their other product and service offerings. Any increase in the level of competition from these, or any other competitors, is likely to result in price reductions, reduced margins, loss of market share and a potential decline in our revenues. We cannot assure you that we will be able to compete successfully with our existing or future competitors. If we fail to withstand competitive pressures and compete successfully, our business, financial condition and results of operations could be materially adversely affected.
17
We may not be able to obtain additional financing to satisfy our future capital needs.
We intend to continue making capital expenditures to market, develop, produce and deploy at no cost to our customer, the various equipment required by the customers to receive our services and to introduce additional services. In addition, we will need to make the investments necessary to maintain and improve our network. We also expect to expend capital to consummate any mergers and acquisitions that we undertake in the future. We may require additional capital sooner than currently anticipated and may not be able to obtain additional funds adequate for our capital needs. We cannot predict any of the factors affecting the revenues and costs of these activities with any degree of certainty. Accordingly, we cannot predict the precise amount of future capital that we will require, particularly if we pursue one or more additional acquisitions.
Furthermore, additional financing may not be available to us, or if it is available, it may not be available on acceptable terms. Our inability to obtain the necessary financing on acceptable terms may prevent us from deploying our products and services effectively, maintaining and improving our products and network and completing advantageous acquisitions. Our inability to obtain the necessary financing could seriously harm our business, financial condition, results of operations and prospects. Consequently, we could be required to:
- •
- significantly reduce or suspend certain of our operations;
- •
- seek an additional merger partner; or
- •
- sell additional securities on terms that are dilutive to our stockholders.
Our business is highly dependent upon television and radio advertising. If demand for, or margins from, our television and radio advertising delivery services decline, our business results could decline.
We expect that a significant portion of our revenues will continue to be derived from the delivery of television and radio advertising spots from advertising agencies, production studios and dub and ship houses to television and radio stations in the United States. A decline in demand for, or average selling prices of, our television and radio advertising delivery services for any of the following reasons, or otherwise, would seriously harm our business, financial condition, results of operations and prospects:
- •
- competition from new advertising media;
- •
- new product introductions or price competition from competitors;
- •
- a shift in purchases by customers away from our premium services; and
- •
- change in the technology used to deliver such services.
Additionally, we are dependent on our relationship with the television and radio stations in which we have installed communications equipment. Should a substantial number of these stations go out of business, experience a change in ownership or discontinue the use of our equipment in any way, our business, financial condition, results of operations and prospects would be harmed.
If we are not able to maintain and improve service quality, our business and results of operations could decline.
Our business will depend on making cost-effective deliveries to broadcast stations within the time periods requested by our customers. If we are unsuccessful in making these deliveries, for whatever reason, a station might be prevented from selling airtime that it otherwise could have sold. Our ability to make deliveries to stations within the time periods requested by customers depends on a number of factors, some of which are outside of our control, including:
- •
- network operations and / or equipment failure;
18
- •
- interruption in services by telecommunications service providers; and
- •
- inability to maintain our installed base of video and audio units that will comprise our distribution network.
Stations may assert claims for lost air-time in these circumstances and dissatisfied advertisers may refuse to make further deliveries through us in the event of a significant occurrence of lost deliveries, which would result in a decrease in our revenues or an increase in our expenses, either of which could lead to a reduction in net income or an increase in net loss. Although we expect that we will maintain insurance against business interruption, such insurance may not be adequate to protect us from significant loss in these circumstances or from the effects of a major catastrophe (such as an earthquake or other natural disaster), which could result in a prolonged interruption of our business.
Our business is highly dependent on electronic video advertising delivery service deployment.
Our inability to maintain the server equipment necessary for the receipt of electronically delivered video advertising content in an adequate number of television stations or to capture market share among content delivery customers, which may be the result of price competition, new product introductions from competitors or otherwise, would be detrimental to our business objectives and deter future growth. We have made a substantial investment in upgrading and expanding our Irving and Atlanta NOCs and in populating television stations with the server equipment necessary for the receipt of electronically delivered video advertising content. However, we cannot assure you that the maintenance of these units will cause this service to achieve adequate market acceptance among customers that require video advertising content delivery.
In addition, to more fully address the needs of video delivery customers we have developed a set of ancillary services that typically are provided by dub and ship houses. These ancillary services include cataloging, physical archiving, closed-captioning, modification of slates and format conversions. We believe that we will need to provide these services on a localized basis in each of the major cities in which we provide services directly to agencies and advertisers. We currently provide certain of such services to a portion of our customers through our facilities in New York, Los Angeles, San Francisco, Dallas, Detroit and Chicago. However, we may not be able to successfully provide these services to all customers in those markets or any other major metropolitan area at competitive prices. Additionally, we may not be able to provide competitive video distribution services in other U.S. markets because of the additional costs and expenses necessary to do so and because we may not be able to achieve adequate market acceptance among current and potential customers in those markets.
While we are taking the steps we believe are required to achieve the network capacity and scalability necessary to deliver video content, such as HD content, reliably and cost effectively as video advertising delivery volume grows, we may not achieve such goals because they are highly dependent on the services provided by our telecommunication providers and the technological capabilities of both our customers and the destinations to which content is delivered. If our telecommunication providers are unable or unwilling to provide the services necessary at a rate we are willing to pay or if our customers and/or our delivery destinations do not have the technological capabilities necessary to send and/or receive video content, our goals of adequate network capacity and scalability could be jeopardized.
In addition, we may be unable to retain current audio delivery customers or attract future audio delivery customers who may ultimately demand delivery of both media content unless we can successfully continue to develop and provide video transmission services. The failure to retain such customers could result in a reduction of revenues, thereby decreasing our ability to maintain profitability.
19
We rely on bandwidth providers and other third parties for key aspects of the process of providing products and services to our customers, and any failure or interruption in the services and products provided by these third parties could harm our ability to operate our business and damage our reputation.
We rely on third-party vendors, including bandwidth providers. Any disruption in the network access services provided by these third-party providers or any failure of these third-party providers to handle current or higher volumes of use could significantly harm our business. Any financial or other difficulties our providers face may have negative effects on our business, the nature and extent of which we cannot predict. We exercise little control over these third-party vendors, which increases our vulnerability to problems with the services they provide. We license technology from third parties to facilitate aspects of our connectivity operations. We have experienced and expect to continue to experience interruptions and delays in service and availability for such elements. Any errors, failures, interruptions or delays experienced in connection with these third-party technologies could negatively impact our relationship with users and adversely affect our business and could expose us to liabilities to third parties.
If we were no longer able to rely on our existing providers of transmissions services, our business and results of operations could be harmed.
We obtain our local access transmission services and long distance telephone access through contracts with TW Telecom and XO Communications, both of which expire in September 2013. The agreement with TW Telecom provides for reduced pricing on various services provided in exchange for minimum purchases of $0.9 million each year and the XO Communications contract provides reduced pricing in exchange for minimum purchases of $0.5 million each year. The agreements provide for certain achievement credits once specified purchase levels are met. Any interruption in the supply or a change in the price of either local access or long distance carrier service could increase costs or cause a significant decline in revenues, thereby decreasing our operating results.
We face various risks associated with purchasing satellite capacity.
As part of our strategy of providing transmittal of video, audio, data and other information using satellite technology, we periodically purchase satellite capacity from third parties owning satellite systems. Although our management attempts to match these expenditures against anticipated revenues from sales of products or services to customers, they may not be successful at estimating anticipated revenues, and actual revenues from sales of products or services may fall below expenditures for satellite capacity. In addition, purchases of satellite capacity require a significant amount of capital. Any inability to purchase satellite capacity or to achieve revenues sufficient to offset the capital expended to purchase satellite capacity may make our business more vulnerable and significantly affect our financial condition, cash flows and results of operations.
If the existing relationships with Clear Channel Satellite Services or Intelsat is terminated, or if either Clear Channel Satellite Services or Intelsat fails to perform as required under its agreement with us, our business could be interrupted.
We have designed and developed the necessary software to enable our current video delivery systems to receive digital satellite transmissions over Clear Channel's AMC-9 and Intelsat's Galaxy 18 and 19 satellite systems. However, the AMC-9 and Galaxy 18 and 19 satellite systems may not have the capacity to meet our current or future delivery commitments and broadcast quality requirements on a cost-effective basis, if at all. We have non-exclusive agreements with Clear Channel that expires in June 2013 and Intelsat that expire in September 2011 and December 2013. The agreements provide for fixed pricing on dedicated bandwidth and give us access to satellite capacity for electronic delivery of digital video and audio transmissions by satellite. Clear Channel and Intelsat are required to meet performance specifications as outlined in the agreements, and we are given a credit allowance for
20
future fees if Clear Channel or Intelsat do not meet these requirements. The agreements state that Clear Channel or Intelsat can terminate the agreement if we do not make timely payments or become insolvent.
Certain of our products depend on satellites; any satellite failure could result in interruptions of our service that could negatively impact our business and reputation.
A reduction in the number of operating satellites or an extended disruption of satellite transmissions would impair the current utility of the accessible satellite network and the growth of current and additional market opportunities. Satellites and their ground support systems are complex electronic systems subject to weather conditions, electronic and mechanical failures and possible sabotage. The satellites have limited design lives and are subject to damage by the hostile space environment in which they operate. The repair of damaged or malfunctioning satellites is nearly impossible. If a significant number of satellites were to become inoperable, there could be a substantial delay before they are replaced with new satellites. In addition, satellite transmission can be disrupted by natural phenomena causing atmospheric interference, such as sunspots.
Certain of our products rely on signals from satellites, including, but not limited to, satellite receivers and head-end equipment. Any satellite failure could result in interruptions of our service, negatively impacting our business. We attempt to mitigate this risk by having our customers procure their own agreements with satellite providers.
Interruption or failure of our information technology and communications systems could impair our ability to effectively provide our products and services, which could damage our reputation and harm our operating results.
Our provision of our products and services depends on the continuing operation of our information technology and communications systems. Any damage to or failure of our systems could result in interruptions in our service. Interruptions in our service could reduce our revenues and profits, and our brand could be damaged if people believe our system is unreliable. Our systems are vulnerable to damage or interruption from earthquakes, terrorist attacks, floods, fires, power loss, telecommunications failures, computer viruses, computer denial of service attacks or other attempts to harm our systems, and similar events. Some of our systems are not fully redundant, and our disaster recovery planning cannot account for all eventualities. The occurrence of a natural disaster, a decision to close a facility we are using without adequate notice for financial reasons or other unanticipated problems at our Irving or Atlanta NOCs could result in lengthy interruptions in our service.
We have experienced system failures in the past and may in the future. Any unscheduled interruption in our service puts a burden on our entire organization and may result in a loss of revenue. If we experience frequent or persistent system failures in our Irving or Atlanta NOCs or web-based management systems, our reputation and brand could be permanently harmed. The steps we have taken to increase the reliability and redundancy of our systems are expensive, reduce our operating margin and may not be successful in reducing the frequency or duration of unscheduled downtime.
The market price of our common stock is likely to continue to be volatile.
Some of the factors that may cause the market price of our common stock to fluctuate significantly include:
- •
- the addition or departure of key personnel;
- •
- variations in our quarterly operating results;
21
- •
- announcements by us or our competitors of significant contracts, new or enhanced products or service offerings,
acquisitions, distribution partnerships, joint ventures or capital commitments;
- •
- changes in coverage and financial estimates by securities analysts;
- •
- changes in market valuations of networking, Internet and telecommunications companies;
- •
- fluctuations in stock market prices and trading volumes, particularly fluctuations of stock prices quoted on the NASDAQ
Global Select Market; and
- •
- sale of a significant number of shares of our common stock by us or our significant holders.
Sales of substantial amounts of our common stock in the public market could harm the market price of our common stock.
The sale of substantial amounts of our shares (including shares issuable upon exercise of outstanding options and warrants to purchase our common stock) may cause substantial fluctuations in the price of our common stock. Because investors would be more reluctant to purchase shares of our common stock following substantial sales, the sale of these shares also could impair our ability to raise capital through the sale of additional stock.
Our inability to enter into or develop strategic relationships in key market segments could harm our operating results.
Our strategy depends in part on the development of strategic relationships with leading companies in key market segments, including media broadcasters and digital system providers. We may not be able to successfully form or enter into such relationships, which may jeopardize our ability to generate sales of our products or services in those segments. Specific product lines are dependent to a significant degree on strategic alliances and joint ventures formed with other companies. Various factors could limit our ability to enter into or develop strategic relationships, including, but not limited to, our relatively short operating history, history of losses and the resources available to our competitors. Moreover, the terms of strategic alliances and joint ventures may vest control in a party other than us. Accordingly, the success of the strategic alliance or joint venture may depend upon the actions of that party and not us.
Our business may not grow if the Internet advertising market does not continue to develop or if we are unable to successfully implement our business model.
An emerging part of our service offering is to generate revenue by providing interactive marketing solutions to advertisers, ad agencies and web publishers. The profit potential for this business model is unproven. For a portion of our business to be successful, Internet advertising will need to achieve increasing market acceptance by advertisers, ad agencies and web publishers. The intense competition among Internet advertising sellers has led to the creation of a number of pricing alternatives for Internet advertising. These alternatives make it difficult for us to project future levels of advertising revenue and applicable gross margin that can be sustained by us or the Internet advertising industry in general.
Intensive marketing and sales efforts are necessary to educate prospective advertisers regarding the uses and benefits of, and to generate demand for, our products and services. Advertisers could be reluctant or slow to adopt a new approach that may replace, limit or compete with their existing systems. Acceptance of our Internet advertising solutions will depend on the continued emergence of Internet commerce, communication, and advertising, and demand for our solutions. We cannot assure you that use of the Internet will continue to grow or that current uses of the Internet are sustainable.
22
Our business may be harmed if we are not able to protect our intellectual property rights from third-party challenges or if the intellectual property we use infringes upon the proprietary rights of third parties.
The steps taken to protect our proprietary information may not prevent misappropriation of such information, and such protection may not preclude competitors from developing confusingly similar brand names or promotional materials or developing products and services similar to ours. We consider our trademarks, copyrights, advertising and promotion design and artwork to be of value and important to our businesses. We rely on a combination of trade secret, copyright and trademark laws and nondisclosure and other arrangements to protect our proprietary rights. We generally enter into confidentiality or license agreements with our distributors and customers and limit access to and distribution of our software, documentation and other proprietary information. Despite our efforts to protect our proprietary rights, unauthorized parties may attempt to copy or obtain and use information that we regard as proprietary. In addition, the laws of some foreign countries do not protect our proprietary rights to the same extent as do the laws of the United States.
We cannot assure you that our intellectual property does not infringe on the proprietary rights of third parties. While we believe that our trademarks, copyrights, advertising and promotion design and artwork do not infringe upon the proprietary rights of third parties, we may still receive future communications from third parties asserting that we are infringing, or may be infringing, on the proprietary rights of third parties. Any such claims, with or without merit, could be time-consuming, require us to enter into royalty arrangements or result in costly litigation and diversion of management attention. If such claims are successful, we may not be able to obtain licenses necessary for the operation of our business, or, if obtainable, such licenses may not be available on commercially reasonable terms, either of which could prevent our ability to operate our business.
We may enter into or seek to enter into business combinations and acquisitions that may be difficult to integrate, disrupt our business, dilute stockholder value or divert management attention.
We acquired Match Point, Enliven, the Vyvx advertising services business of Level 3 Communications, LLC, Pathfire, Point.360, GTN, and FastChannel Network Inc. Our business strategy might include the acquisition of additional complementary businesses and product lines. Any such acquisitions would be accompanied by the risks commonly encountered in such acquisitions, including:
- •
- the difficulty of assimilating the operations and personnel of the acquired companies;
- •
- the potential disruption of our business;
- •
- the inability of our management to maximize our financial and strategic position by the successful incorporation of
acquired technology and rights into our product and service offerings;
- •
- difficulty maintaining uniform standards, controls, procedures and policies, with respect to accounting matters and
otherwise;
- •
- the potential loss of key employees of acquired companies; and
- •
- the impairment of relationships with employees and customers as a result of changes in management and operational structure.
We may not be able to successfully complete any acquisition or, if completed, the acquired business or product line may not be successfully integrated with our operations, personnel or technologies. Any inability to successfully integrate the operations, personnel and technologies associated with an acquired business and/or product line may negatively affect our business and results of operation. We may dispose of any of our businesses or product lines in the event that we are unable to successfully integrate them, or in the event that management determines that any such business or product line is no longer in our strategic interests.
23
Failure to manage future growth could hinder the future success of our business.
Our personnel, systems, procedures and controls may not be adequate to support our existing as well as future operations. We will need to continue to implement and improve our operational, financial and management information systems, procedures and controls on a timely basis and to expand, train, motivate and manage our work force. We must also continue to further develop our products and services while implementing effective planning and operating processes, such as continuing to implement and improve operational, financial and management information systems; hiring and training additional qualified personnel; continuing to expand and upgrade our core technologies; and effectively managing multiple relationships with various customers, joint venture and technological partners and other third parties.
We depend on key personnel to manage the business effectively, and if we are unable to retain our key employees or hire additional qualified personnel, our ability to compete could be harmed.
Our future success will depend to a significant extent upon the services of Scott K. Ginsburg, Chairman of the Board and Chief Executive Officer, Neil Nguyen, President and Chief Operating Officer, and Omar A. Choucair, Chief Financial Officer. Uncontrollable circumstances, such as the death or incapacity of any key executive officer, could have a serious impact on our business.
Our future success will also depend upon our ability to attract and retain highly qualified management, sales, operations, technical and marketing personnel. At the present time there is, and will continue to be, intense competition for personnel with experience in the markets applicable to our products and services. Because of this intense competition, we may not be able to retain key personnel or attract, assimilate or retain other highly qualified technical and management personnel in the future. The inability to retain or to attract additional qualified personnel as needed could have a considerable impact on our business.
Certain provisions of our bylaws may have anti-takeover effects that could prevent a change in control even if the change would be beneficial to our stockholders.
We have a classified board which might, under certain circumstances, discourage the acquisition of a controlling interest of our stock because such acquirer would not have the ability to replace directors except as the term of each class expires. The directors are divided into three classes with respect to the time for which they hold office. The term of office of one class of directors expires at each annual meeting of stockholders. At each annual meeting of stockholders, directors elected to succeed those directors whose terms then expire are elected for a term of office to expire at the third succeeding annual meeting of stockholders after their election.
Our board of directors may issue, without stockholder approval, preferred stock with rights and preferences superior to those applicable to the common stock.
Our certificate of incorporation includes a provision for the issuance of "blank check" preferred stock. This preferred stock may be issued in one or more series, with each series containing such rights and preferences as the board of directors may determine from time to time, without prior notice to or approval of stockholders. Among others, such rights and preferences might include the rights to dividends, superior voting rights, liquidation preferences and rights to convert into common stock. The rights and preferences of any such series of preferred stock, if issued, may be superior to the rights and preferences applicable to the common stock and might result in a decrease in the price of the common stock.
24
We depend upon a number of single or limited-source suppliers, and our ability to produce video and audio distribution equipment could be harmed if those relationships were discontinued.
We rely on fewer than five single or limited-source suppliers for integral components used in the assembly of our video and audio units. If a supplier were to experience financial or operational difficulties that resulted in a reduction or interruption in component supply to us, this would delay our deployment of video and audio units. We rely on our suppliers to manufacture components for use in our products. Some of our suppliers also sell products to our competitors and may in the future become our competitors, possibly entering into exclusive arrangements with our existing competitors. In addition, our suppliers may stop selling our products or components to us at commercially reasonable prices or completely stop selling our products or components to us. If a reduction or interruption of supply were to occur, it could take a significant period of time for us to qualify an alternative subcontractor, redesign our products as necessary and contract for the manufacture of such products. This would have the effect of depressing our business until we were able to establish sufficient component supply through an alternative source. We believe that there are currently alternative component manufacturers that could supply the components required to produce our products, but based on the financial condition and service levels of our current suppliers, we do not feel the need to pursue agreements or understandings with such alternative sources or pursue long-term contracts with our current suppliers. We have experienced component shortages in the past, and material component shortages or production or delivery delays may occur in the future.
Consolidation of Internet advertising networks, web portals, Internet search engine sites and web publishers may impair our ability to serve advertisements and to collect campaign data and could lead to a loss of significant Unicast customers.
The growing trend of consolidation of Internet advertising networks, web portals, Internet search engine sites and web publishers, and increasing industry presence of a small number of large companies, such as Google, Microsoft and, most recently, Apple, with the announcement of its iAd platform for placing ads on Apple's applications, could harm our business. We are currently able to serve, track and manage advertisements for our customers in a variety of networks and websites, which is a major benefit to our customers' overall campaign management. Concentration of advertising networks could substantially impair our ability to serve advertisements if these networks or websites decide not to permit us to serve, track or manage advertisements on their websites, if they develop ad placement systems that are incompatible with our ad serving systems, or if they use their market power to force their customers to use certain vendors on their networks or websites. These networks or websites could also prohibit or limit our aggregation of advertising campaign data if they use technology that is not compatible with our technology. In addition, concentration of desirable advertising space in a small number of networks and websites could result in pricing pressures and diminish the value of our advertising campaign databases, as the value of these databases depends to some degree on the continuous aggregation of data from advertising campaigns on a variety of different advertising networks and websites. Additionally, major publishers can terminate our ability to serve advertisements on their properties on short notice. If we are no longer able to serve, track and manage advertisements on a variety of networks and websites, our ability to service campaigns effectively and aggregate useful campaign data for our customers will be limited.
The Internet advertising or marketing market may deteriorate, or develop more slowly than expected, which could have a material adverse affect on our business, financial condition or results of operations.
If the market for Internet advertising or marketing deteriorates, or develops more slowly than we expect, our Unicast business could suffer. The future success of our Unicast business is dependent on an increase in the use of the Internet, the commitment or advertisers and advertising agencies to the Internet as an advertising and marketing medium, the advertisers' implementation of advertising campaigns and the willingness of current or potential customers to outsource their Internet advertising and marketing needs. The Internet advertising and marketing market is relatively new and rapidly evolving. As a result, demand and market acceptance for Internet advertising solutions and services is uncertain.
25
Our software products may be wrongly labeled as spyware which might lead to its uninstallation causing a decrease in our revenues.
Our software products, including the Viewpoint Toolbar and the Media Player, have been wrongly characterized as spyware by certain security software vendors. We monitor activity in this area and undertake efforts to educate vendors about the characteristics of our software, and thus far have been successful at getting the vast majority of these vendors to change their characterization of our Viewpoint Toolbar. Should we fail to persuade such vendors about the functionality of our Viewpoint Toolbar, or not learn about a false characterization on a timely basis, a substantial number of our Viewpoint Toolbars could be uninstalled leading to a decrease in our revenues and our business will be materially and adversely affected.
Our revenues will be impacted by seasonal fluctuations and decreases or delays in advertising spending due to general economic conditions and the lack of backlog for our orders makes any forecasting of our operating results inherently uncertain.
We believe that our revenues will be subject to seasonal fluctuations because advertisers generally place fewer advertisements during the first and third calendar quarters of each year and direct marketers mail substantially more marketing materials in the third quarter of each year. Furthermore, Internet user traffic typically drops during the summer months, which reduces the number of advertisements to sell and deliver and searches performed. Expenditures by advertisers and direct marketers tend to vary in cycles that reflect overall economic conditions as well as budgeting and buying patterns. Our revenue could be materially reduced by a decline in the economic prospects of advertisers, direct marketers or the economy in general, which could alter current or prospective advertisers' spending priorities or budget cycles or extend our sales cycle. In addition, any decreases in or delays in advertising spending due to general economic conditions could reduce our revenues or negatively impact our ability to grow our revenues. Due to such risks, you should not rely on quarter-to-quarter comparisons of our results of operations as an indicator of our future results. Our staffing and other operating expenses are based in large part on anticipated revenues. It may be difficult for us to adjust our spending to compensate for any unexpected shortfall. If we are unable to reduce our spending following any such shortfall, our results of operations would be adversely affected. Further, forecasting economic activity is inherently difficult, and the nature of our business provides only limited visibility for our future operating results. We do not have a backlog of orders from customers, and at any point in time our pending orders represent only a day or two of future revenues. Accordingly, our ability to forecast future operating results is limited, any such forecasts would be inherently uncertain and our quarterly results could be quite volatile.
If the accounting estimates we make, and the assumptions on which we rely, in preparing our financial statements prove inaccurate, our actual results may be adversely affected.
Our financial statements have been prepared in accordance with accounting principles generally accepted in the United States of America. The preparation of these financial statements requires us to make estimates and judgments about, among other things, taxes, revenue recognition, stock-based compensation costs, capitalization of internal-use software, investments, contingent obligations, allowance for doubtful accounts, intangible assets and restructuring charges. These estimates and judgments affect the reported amounts of our assets, liabilities, revenues and expenses, the amounts of charges accrued by us, and related disclosure of contingent assets and liabilities. We base our estimates on historical experience and on various other assumptions that we believe to be reasonable under the circumstances and at the time they are made. If our estimates or the assumptions underlying them are not correct, actual results may differ materially from our estimates and we may need to, among other things, accrue additional charges that could adversely affect our results of operations, which in turn could adversely affect our stock price.
26
Future changes in financial accounting standards may adversely affect our reported results of operations.
A change in accounting standards can have a significant effect on our reported results. New accounting pronouncements and interpretations of accounting pronouncements have occurred and may occur in the future. These new accounting pronouncements may adversely affect our reported financial results.
We plan to expand operations in international markets in which we have limited experience, which could harm our business, operating results and financial condition.
We opened a Unicast office in the United Kingdom in 2007 and plan to expand our product offering in the European and other international markets. We have only limited experience in marketing and operating our products and services in international markets, and we may not be able to successfully execute our business model in these markets. In other instances, we may rely on the efforts and abilities of foreign business partners in such markets.
We believe that as the international markets in which we operate continue to grow, competition in these markets will intensify. Local companies may have a competitive advantage because of a greater understanding and focus on the local markets. In addition, certain international markets may be slower than domestic markets in adopting the Internet as an advertising and commerce medium and so our operations in international markets may not develop at a rate that supports our level of investment.
Other risks of doing business internationally include the following:
- •
- difficulties in developing, managing and staffing foreign operations;
- •
- stringent local labor laws or regulations;
- •
- currency exchange rate fluctuations;
- •
- trade barriers and regulations;
- •
- difficulty enforcing contracts in foreign jurisdictions;
- •
- potentially adverse tax consequences;
- •
- import or export restrictions; and
- •
- difficulties in complying with local government regulation or local laws.
- •
- increased expenses associated with sales and marketing, deploying services and maintaining our infrastructure in foreign
countries;
- •
- competition from local content delivery service providers, many of which are very well positioned within their local
markets;
- •
- corporate and personal liability for violations of local laws and regulations;
- •
- longer accounts receivable payment cycles and difficulties in collecting accounts receivable;
- •
- interpretations of laws or regulations that would subject us to regulatory supervision or, in the alternative, require us to exit a country, which could have a negative impact on the quality of our services or our results of operations;
27
Consolidation in the industries in which we operate could lead to increased competition and loss of customers.
The Internet industry (and online advertising in particular) has experienced substantial consolidation. We expect this consolidation to continue. This consolidation could adversely affect our business and results of operations in a number of ways, including the following:
- •
- our customers could acquire or be acquired by our competitors and terminate their relationship with us;
- •
- our customers could merge with each other, which could reduce our ability to negotiate favorable terms; and
- •
- competitors could improve their competitive position through strategic acquisitions.
Our ad campaign management and deployment solution may not be successful and may cause business disruption.
Unicast Advertising Platform (UAP) is our proprietary ad deployment technology. We must, among other things, ensure that this technology will function efficiently at high volumes, interact properly with our database, offer the functionality demanded by our customers and assimilate our sales and reporting functions. Customers may become dissatisfied by any system failure that interrupts our ability to provide our services to them, including failures affecting our ability to deploy advertisements without significant delay to the viewer. Sustained or repeated system failures would reduce the attractiveness of our solutions to advertisers, ad agencies, and web publishers and could result in contract terminations, fee rebates and make-goods, thereby reducing revenue. Slower response time or system failures may also result from straining the capacity of our deployed software or hardware due to an increase in the volume of advertising deployed through our servers. To the extent that we do not effectively address any capacity constraints or system failures, our business, results of operations and financial condition could be materially and adversely affected.
Privacy concerns could lead to legislative and other limitations on our ability to collect usage data from Internet users, including limitations on our use of cookie or conversion tag technology and user profiling, which is crucial to our ability to provide our solutions and services to our customers.
Our ability to conduct targeted advertising campaigns and compile data that we use to formulate campaign strategies for our customers depends on the use of "cookies" and "conversion tags" to track Internet users and their online behavior, which allows us to build anonymous user profiles and measure an advertising campaign's effectiveness. A cookie is a small file of information stored on a user's computer that allows us to recognize that user's browser when we serve advertisements. A conversion tag functions similarly to a banner advertisement, except that the conversion tag is not visible. Our conversion tags may be placed on specific pages of clients of our customers' or prospective customers' websites. Government authorities inside the United States concerned with the privacy of Internet users have suggested limiting or eliminating the use of cookies, conversion tags or user profiling. Bills aimed at regulating the collection and use of personal data from Internet users are currently pending in U.S. Congress and many state legislatures. Attempts to regulate spyware may be drafted in such a way as to include technology like cookies and conversion tags in the definition of spyware, thereby creating restrictions that could reduce our ability to use them. In addition, the Federal Trade Commission and the Department of Commerce have conducted hearings regarding user profiling, the collection of non-personally identifiable information and online privacy.
Our foreign operations may also be adversely affected by regulatory action outside the United States. For example, the European Union has adopted a directive addressing data privacy that limits the collection, disclosure and use of information regarding European Internet users. In addition, the European Union has enacted an electronic communications directive that imposes certain restrictions
28
on the use of cookies and conversion tags and also places restrictions on the sending of unsolicited communications. Each European Union member country was required to enact legislation to comply with the provisions of the electronic communications directive by October 31, 2003 (though not all have done so). Germany has also enacted additional laws limiting the use of user profiling, and other countries, both in and out of the European Union, may impose similar limitations.
Internet users may also directly limit or eliminate the placement of cookies on their computers by using third-party software that blocks cookies, or by disabling or restricting the cookie functions of their Internet browser software. Internet browser software upgrades may also result in limitations on the use of cookies or conversion tags. Technologies like the Platform for Privacy Preferences (P3P) Project may limit collection of cookie and conversion tag information. Individuals have also brought class action suits against companies related to the use of cookies and several companies, including companies in the Internet advertising industry, have had claims brought against them before the Federal Trade Commission regarding the collection and use of Internet user information. We may be subject to such suits in the future, which could limit or eliminate our ability to collect such information.
If our ability to use cookies or conversion tags or to build user profiles were substantially restricted due to the foregoing, or for any other reason, we would have to generate and use other technology or methods that allow the gathering of user profile data in order to provide our services to our customers. This change in technology or methods could require significant reengineering time and resources, and may not be complete in time to avoid negative consequences to our business. In addition, alternative technology or methods might not be available on commercially reasonable terms, if at all. If the use of cookies and conversion tags are prohibited and we are not able to efficiently and cost effectively create new technology, our business, financial condition and results of operations could be materially adversely affected.
In addition, any compromise of our security that results in the release of Internet users' and/or our customers' data could seriously limit the adoption of our solutions and services as well as harm our reputation and brand, expose us to liability and subject us to reporting obligations under various state laws, which could have an adverse effect on our business. The risk that these types of events could seriously harm our business is likely to increase as the amount of data we store for our customers on our servers (including personal information) and the number of countries where we operate has been increasing, and we may need to expend significant resources to protect against security breaches, which could have an adverse effect on our business, financial condition or results of operations.
If we fail to detect click-through fraud or other invalid clicks, we could lose the confidence of our advertisers, thereby causing our business to suffer.
We are exposed to the risk of fraudulent clicks and other invalid clicks on advertisements delivered by us from a variety of potential sources. Invalid clicks are clicks that we have determined are not intended by the user to link to the underlying content, such as inadvertent clicks on the same ad twice and clicks resulting from click fraud. Click fraud occurs when a user intentionally clicks on an ad displayed on a web site for a reason other than to view the underlying content. These types of fraudulent activities could harm our business and our brand. If fraudulent clicks are not detected, the data that our solutions provide to our customers is inaccurate and the affected advertisers may lose confidence in our solutions to deliver a return on their investment. If advertisers become dissatisfied with our solutions, they may choose to do business with our competitors or reduce their Internet advertising spending, which could have a material adverse effect on our business, financial condition and results of operations.
29
Internet security poses risks to our entire business.
The process of e-commerce aggregation by means of our hardware and software infrastructure involves the transmission and analysis of confidential and proprietary information of the advertiser, as well as our own confidential and proprietary information. The compromise of our security or misappropriation of proprietary information could have a material adverse effect on our business, prospects, financial condition and results of operations. We rely on encryption and authentication technology licensed from other companies to provide the security and authentication necessary to effect secure Internet transmission of confidential information, such as credit and other proprietary information. Advances in computer capabilities, new discoveries in the field of cryptography, or other events or developments may result in a compromise or breach of the technology used by us to protect client transaction data. Anyone who is able to circumvent our security measures could misappropriate proprietary information or cause material interruptions in our operations. We may be required to expend significant capital and other resources to protect against security breaches or to minimize problems caused by security breaches. To the extent that our activities or the activities of others involve the storage and transmission of proprietary information, security breaches could damage our reputation and expose us to a risk of loss or litigation and possible liability. Our security measures may not prevent security breaches. Our failure to prevent these security breaches may have a material adverse effect on our business, prospects, financial condition and results of operations.
ITEM 1B. UNRESOLVED STAFF COMMENTS
None
30
Company's principal executive offices are at 750 West John Carpenter Freeway in Irving, Texas. The Company's material properties are listed below:
Location
|
Type | Segment | Lease Expiration |
Square Footage |
Square Footage Sublet |
||||||||||
|---|---|---|---|---|---|---|---|---|---|---|---|---|---|---|---|
Irving, TX |
Headquarters Corporate Office | Ads | 2011 | 26,025 | |||||||||||
Irving, TX |
Headquarters Corporate Office | Ads | 2011 | 2,725 | |||||||||||
Burbank, CA |
Sales and Operations | Ads | 2016 | 24,500 | |||||||||||
Los Angeles, CA |
Sales and Operations | Ads | 2011 | 21,709 | |||||||||||
San Francisco, CA |
Sales and Operations | Ads | 2017 | 9,000 | |||||||||||
Wilmington, DE |
Sales and Operations | Ads | 2020 | 62,050 | |||||||||||
Roswell, GA |
Sales and Operations | Ads | 2016 | 21,681 | |||||||||||
Chicago, IL |
Sales and Operations | Ads | 2017 | 18,500 | |||||||||||
Detroit, MI |
Sales and Operations | Ads | 2012 | 76,488 | 37,157 | ||||||||||
New York, NY |
Sales and Operations | Ads | 2017 | 12,500 | |||||||||||
New York, NY |
Sales and Operations | Ads | 2011 | 22,919 | |||||||||||
New York, NY |
Sales and Operations | Ads | 2016 | 26,200 | |||||||||||
New York, NY |
Sales and Operations | Ads | 2011 | 15,600 | |||||||||||
Dallas, TX |
Sales and Operations | Ads | 2013 | 6,400 | |||||||||||
Chicago, IL |
Storage Facility | Ads | 2020 | 30,678 | |||||||||||
Louisville, KY |
Dub and Ship Facility | Ads | 2013 | 9,100 | |||||||||||
London, England |
Sales and Production | Other | 2014 | 2,961 | |||||||||||
Austin, TX |
Sales and Operations | Other | 2013 | 9,980 | |||||||||||
Austin, TX |
Sales and Operations | Other | 2011 | 12,400 | |||||||||||
Boca Raton, FL |
Administrative, Sales and Operations | Other | 2011 | 3,816 | |||||||||||
In September 2010, a securities class-action lawsuit captioned Duncan v. Ginsburg, et al, was filed against the Company and certain of its officers and directors in the U.S. District Court for the Southern District of New York (10 Civ. 6523). Subsequently, an identical lawsuit by the same plaintiff, also captioned Duncan v. Ginsburg, et al, was filed in the U.S. District Court for the Northern District of Texas (10 Civ. 1769), and a similar lawsuit, captioned Tours v. DG FastChannel Inc., et al, was filed in the U.S. District Court for the Southern District of New York by a different plaintiff (10 Civ. 6930). The Northern District of Texas lawsuit was voluntarily dismissed by the plaintiff and the other two lawsuits were consolidated before Judge Richard J. Sullivan in the U.S. District Court for the Southern District of New York, captioned In re DG FastChannel, Inc. Securities Litigation (10 Civ. 6523). On November 24, 2010, Judge Sullivan appointed a lead plaintiff and ordered that a consolidated amended complaint be filed. On January 24, 2011, the lead plaintiff filed a consolidated amended complaint on behalf of a purported class of persons who purchased or otherwise acquired DG FastChannel common stock between August 4, 2010 and August 27, 2010, inclusive. The consolidated amended complaint alleges violations of Sections 10(b) and 20(a) of the Exchange Act, and Rule 10b-5 promulgated thereunder. The lawsuit alleges, among other things, that the defendants made false or misleading statements of material fact, or failed to disclose material facts, about the Company's financial condition during the class period. The plaintiffs seek unspecified monetary damages and other relief. While the outcome of such lawsuits cannot be predicted with certainty, the Company intends to defend the action vigorously.
We expect our defense costs and any loss that may result from these claims will be covered under our insurance policies.
31
ITEM 5. MARKET FOR REGISTRANT'S COMMON EQUITY, RELATED STOCKHOLDER MATTERS AND ISSUER PURCHASES OF EQUITY SECURITIES
Our common stock is traded on the NASDAQ Global Select Market under the symbol DGIT. The following table sets forth the high and low closing sales prices of our common stock from January 1, 2009 to December 31, 2010. Such prices represent prices between dealers, do not include retail mark-ups, markdowns or commissions and may not represent actual transactions.
| |
Fiscal Year Ended 2010 |
Fiscal Year Ended 2009 |
|||||||||||
|---|---|---|---|---|---|---|---|---|---|---|---|---|---|
| |
High | Low | High | Low | |||||||||
First Quarter |
$ | 34.74 | $ | 26.06 | $ | 19.20 | $ | 12.90 | |||||
Second Quarter |
43.80 | 31.18 | 23.41 | 17.72 | |||||||||
Third Quarter |
41.45 | 15.11 | 21.12 | 16.70 | |||||||||
Fourth Quarter |
28.91 | 20.08 | 29.11 | 20.39 | |||||||||
As of February 17, 2011, we had 28,581,842 and 27,924,670 shares of our common stock issued and outstanding, respectively. As of February 17, 2011, our common stock was held by approximately 292 stockholders of record. We estimate that there are approximately 11,400 beneficial stockholders.
We have never declared or paid cash dividends on our capital stock. We currently expect to retain any future earnings for use in the operation and expansion of our business and do not anticipate paying cash dividends in the foreseeable future.
Purchases of Equity Securities by the Issuer and Affiliated Purchasers
On August 30, 2010, our Board of Directors authorized the purchase of up to $30 million of our common stock in the open market or unsolicited negotiated transactions. The stock repurchase plan has no expiration date. The following table sets forth information with respect to purchases of shares of our common stock during the periods indicated (in thousands, except per share amounts):
Issuer Purchases of Equity Securities
Period
|
Total Number of Shares Purchased |
Average Price Paid per Share |
Total Number of Shares Purchased as Part of Publicly Announced Plans or Programs |
Maximum Dollar Value that May Yet be Purchased Under the Plans or Programs |
||||||||||
|---|---|---|---|---|---|---|---|---|---|---|---|---|---|---|
October 1, 2010 through October 31, 2010 |
— | $ | — | — | $ | 25,577 | ||||||||
November 1, 2010 through November 30, 2010 |
— | $ | — | — | $ | 25,577 | ||||||||
December 1, 2010 through December 31, 2010 |
322 | $ | 27.11 | 322 | $ | 16,852 | ||||||||
Total |
322 | $ | 27.11 | 322 | $ | 16,852 | ||||||||
Stock Performance Table
The table set forth below compares the cumulative total stockholder return on our common stock between December 31, 2005 and December 31, 2010 with the cumulative total return of (i) the NASDAQ Composite Index and (ii) the NASDAQ Computer and Data Processing Index, over the
32
same period. This table assumes the investment of $100.00 on December 31, 2005 in our common stock, the NASDAQ Composite Index and the NASDAQ Computer and Data Processing Index, and assumes the reinvestment of dividends, if any.
The comparisons shown in the table below are based upon historical data. We caution readers that the stock price performance shown in the table below is not indicative of, nor intended to forecast, the potential future performance of our common stock. Information used in the graph was obtained from information published by NASDAQ and Research Data Group, Inc., sources believed to be reliable, but we are not responsible for any errors or omissions in such information.
COMPARISON OF 5 YEAR CUMULATIVE TOTAL RETURN*
Among DG FastChannel, Inc., the NASDAQ Composite Index
and the NASDAQ Computer & Data Processing Index
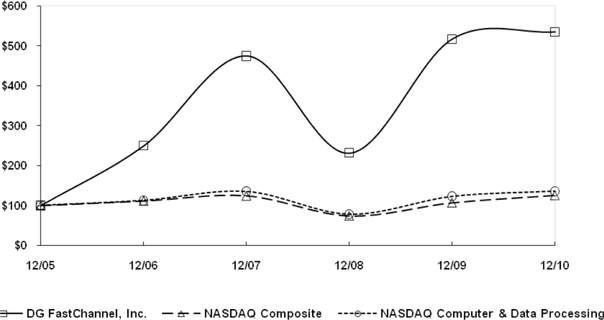
- *
- $100 invested on 12/31/05 in stock or index, including reinvestment of dividends. Fiscal year ending December 31.
| |
12/05 | 12/06 | 12/07 | 12/08 | 12/09 | 12/10 | |||||||||||||
|---|---|---|---|---|---|---|---|---|---|---|---|---|---|---|---|---|---|---|---|
DG FastChannel, Inc. |
$ | 100.00 | $ | 249.63 | $ | 474.81 | $ | 231.11 | $ | 517.22 | $ | 534.81 | |||||||
NASDAQ Composite Index |
100.00 | 111.74 | 124.67 | 73.77 | 107.12 | 125.93 | |||||||||||||
NASDAQ Computer and Data Processing Index |
100.00 | 112.40 | 134.94 | 77.33 | 122.47 | 135.78 | |||||||||||||
Notwithstanding anything to the contrary set forth in any of our previous or future filings under the Securities Act or the Exchange Act that might incorporate this report or future filings made by us under those statutes, this Stock Performance Table shall not be deemed filed with the SEC and shall not be deemed incorporated by reference into any of those prior filings or into any future filings made by us under those statutes.
33
ITEM 6. SELECTED FINANCIAL DATA
The financial data set forth below was derived from our audited consolidated financial statements and should be read in conjunction with the consolidated financial statements and related notes thereto, and "Management's Discussion and Analysis of Financial Condition and Results of Operations" contained elsewhere herein. The data below includes the results of acquired operations from the respective dates of closing as detailed below:
Acquired Operation
|
Date of Closing | |
|---|---|---|
FastChannel Network, Inc. ("FastChannel") |
May 31, 2006 | |
Pathfire, Inc. ("Pathfire") |
June 4, 2007 | |
Point.360 ("Point 360") |
August 13, 2007 | |
GTN, Inc. ("GTN") |
August 31, 2007 | |
Vyvx ("Vyvx") |
June 5, 2008 | |
Enliven Marketing Technologies Corporation ("Enliven") |
October 2, 2008 | |
Match Point Media LLC ("Match Point") |
October 1, 2010 |
See Note 3 to our consolidated financial statements for further information on acquisitions. As a result of our decision to sell the assets of StarGuide Digital Networks, Inc. ("StarGuide") and Corporate Computer Systems, Inc. ("CCS") in 2006 their operating results for all periods presented
34
have been reflected in discontinued operations in the selected financial data below. Amounts are shown in thousands (except per share amounts):
Statements of Operations Data:
| |
For the Years Ended December 31, | |||||||||||||||||
|---|---|---|---|---|---|---|---|---|---|---|---|---|---|---|---|---|---|---|
| |
2010 | 2009 | 2008 | 2007 | 2006 | |||||||||||||
Revenues |
$ | 247,528 | $ | 190,886 | $ | 157,081 | $ | 97,687 | $ | 68,667 | ||||||||
Costs and operating expenses (excluding depreciation and amortization) |
136,056 | 117,083 | 97,999 | 65,770 | 49,803 | |||||||||||||
Depreciation and amortization |
29,992 | 26,501 | 21,351 | 12,865 | 8,563 | |||||||||||||
Impairment of Springbox unit |
5,866 | — | — | — | — | |||||||||||||
Income from operations |
75,614 | 47,302 | 37,731 | 19,052 | 10,301 | |||||||||||||
Other (income) expense: |
||||||||||||||||||
Interest expense and other, net |
7,127 | 11,859 | 11,536 | 2,388 | 2,786 | |||||||||||||
Unrealized loss (gain) on derivative warrant investment |
— | — | 1,544 | (1,707 | ) | — | ||||||||||||
Reduction in fair value of long-term investment |
— | — | — | — | 4,758 | |||||||||||||
Income before income taxes from continuing operations |
68,487 | 35,443 | 24,651 | 18,371 | 2,757 | |||||||||||||
Provision for income taxes |
26,918 | 14,942 | 9,572 | 7,501 | 2,378 | |||||||||||||
Income from continuing operations |
41,569 | 20,501 | 15,079 | 10,870 | 379 | |||||||||||||
Loss from discontinued operations |
— | — | — | (457 | ) | (1,028 | ) | |||||||||||
Net income (loss) |
$ | 41,569 | $ | 20,501 | $ | 15,079 | $ | 10,413 | $ | (649 | ) | |||||||
Basic earnings (loss) per share: |
||||||||||||||||||
Continuing operations |
$ | 1.52 | $ | 0.90 | $ | 0.81 | $ | 0.65 | $ | 0.04 | ||||||||
Discontinued operations |
— | — | — | (0.02 | ) | (0.10 | ) | |||||||||||
Total |
$ | 1.52 | $ | 0.90 | $ | 0.81 | 0.63 | $ | (0.06 | ) | ||||||||
Diluted earnings (loss) per share: |
||||||||||||||||||
Continuing operations |
$ | 1.50 | $ | 0.88 | $ | 0.79 | $ | 0.64 | $ | 0.04 | ||||||||
Discontinued operations |
— | — | — | (0.03 | ) | (0.10 | ) | |||||||||||
Total |
$ | 1.50 | $ | 0.88 | $ | 0.79 | $ | 0.61 | $ | (0.06 | ) | |||||||
Weighted average common shares outstanding: |
||||||||||||||||||
Basic |
27,226 | 22,572 | 18,642 | 16,631 | 10,568 | |||||||||||||
Diluted |
27,570 | 23,091 | 19,073 | 17,096 | 10,568 | |||||||||||||
| |
December 31, | |||||||||||||||
|---|---|---|---|---|---|---|---|---|---|---|---|---|---|---|---|---|
| |
2010 | 2009 | 2008 | 2007 | 2006 | |||||||||||
Balance Sheet Data: |
||||||||||||||||
Cash and cash equivalents |
$ | 73,409 | $ | 33,870 | $ | 17,180 | $ | 10,101 | $ | 24,474 | ||||||
Working capital |
122,954 | 44,150 | 20,856 | 25,601 | 25,106 | |||||||||||
Property and equipment, net |
39,461 | 41,520 | 37,980 | 27,466 | 18,074 | |||||||||||
Total assets |
520,004 | 478,292 | 473,800 | 252,495 | 172,997 | |||||||||||
Long-term debt, net of current portion |
— | 80,962 | 154,985 | 44,325 | 15,650 | |||||||||||
Net assets of discontinued operations |
— | — | — | — | 2,441 | |||||||||||
Stockholders' equity |
496,912 | 347,166 | 269,518 | 192,129 | 141,886 | |||||||||||
35
ITEM 7. MANAGEMENT'S DISCUSSION AND ANALYSIS OF FINANCIAL CONDITION AND RESULTS OF OPERATIONS
The following management's discussion and analysis of financial condition and results of operations ("MD&A") should be read in conjunction with our consolidated financial statements and notes thereto contained elsewhere in this Annual Report on Form 10-K.
MD&A is provided as a supplement to the accompanying consolidated financial statements and notes to help provide an understanding of DG FastChannel Inc.'s (the "Company," "we," "us" or "our") financial condition, changes in financial condition and results of operations. MD&A is organized as follows:
- •
- Overview. This section provides a general description of
our business, as well as recent developments we believe are important in understanding our results of operations and financial condition or in understanding anticipated future trends. In addition, a
brief description is provided of significant transactions and events that impact the comparability of the results being analyzed.
- •
- 2010 Highlights. This section provides some of the
highlights of our 2010 year.
- •
- Results of Operations. This section provides an analysis
of our results of operations for the three years in the period ended December 31, 2010.
- •
- Financial Condition. This section provides a summary of
certain major balance sheet accounts and a discussion of the factors that tend to cause these accounts to change, or the reasons for the change.
- •
- Liquidity and Capital Resources. This section provides an
analysis of our cash flows for the three years in the period ended December 31, 2010, as well as a discussion of our commitments that existed as of December 31, 2010. Included in the
analysis is a discussion of the amount of financial capacity available to fund our future commitments, as well as a discussion of other financing arrangements.
- •
- Critical Accounting Policies. This section discusses
accounting policies that are considered important to our results of operations and financial condition, require significant judgment and require estimates on the part of management. Our significant
accounting policies, including those considered to be critical accounting policies, are summarized in Note 2 to the accompanying consolidated financial statements.
- •
- Recently Adopted and Recently Issued Accounting
Guidance. This section provides a discussion of recently issued accounting guidance that has been adopted or will be adopted in the near
future, including a discussion of the impact or potential impact of such guidance on our consolidated financial statements when applicable.
- •
- Contractual Payment Obligations. This section provides a
summary of our contractual payment obligations by major category and in total, and a breakdown by period.
- •
- Off-Balance Sheet Arrangements. This section provides a summary of our off-balance sheet arrangements and the purpose of these arrangements.
We are a leading provider of digital technology services that enable the electronic delivery of advertisements, syndicated programs, and video news releases to traditional broadcasters, online publishers and other media outlets. We operate three nationwide digital networks which link more than
36
5,000 advertisers, advertising agencies and content owners with more than 29,000 television, radio, cable, print and web publishing destinations electronically throughout the United States, Canada and Europe. We also offer a variety of other ancillary products and services to the advertising industry. Our business can be impacted by several factors including the financial stability of our customers, the overall advertising market, new emerging digital technologies, and the continued transition from analog to digital broadcast signal transmission. We face several factors that impact the growth of digital advertising delivery, including the following:
Increased demand for reliable and rapid means of content delivery. In recent years, technological innovations in digital media have driven increasing demand for reliable and rapid means of information transfer, particularly in the broadcast and telecommunications industries. Digital distribution technologies are increasingly used for distributing media in forms such as video, audio, text and data. Digitized information has many advantages over analog or hard copy formats including ease and efficiency of storage, manipulation, transmission and reproduction, with less degradation and in greater volumes.
Increased adoption and popularity of high definition television. Consumer demand for superior quality, declining high definition television ("HDTV") set prices and increasing availability of HDTV content are driving the rapid growth in HDTV adoption, with the United States leading the charge. Currently, all major broadcasters are delivering prime time content via HD broadcasting and HDTV advertising has been growing steadily. As local television stations complete the upgrade to their infrastructure to enable HDTV signals, advertisers are increasing the number of HDTV commercials, which we believe will likely require digital distribution.
Emergence of video advertising content on the Internet. The confluence of a successful online advertising industry and the penetration of personal broadband connections create a strong platform for the Internet to become a significant medium with respect to video advertisements. The increase in broadband subscribers is fueling the accelerating growth in streaming media. Largely due to this growth in broadband usage, the Internet has become a widely used medium for distributing and receiving video and audio content. As the volume and quality of dynamic content progresses, we believe there will be significant growth in video advertising over the Internet and advertisers will look to existing digital content distributors to provide the necessary capabilities to successfully leverage this emerging medium.
Dependence on Third Parties. We depend on several third party vendors to operate our digital distribution network. Accordingly, we are highly dependent on satellite and high-speed connectivity vendors to properly operate our digital network. Further, we are highly dependent on the video advertising aired on TV and cable networks, cable systems, and other broadcast media outlets.
Significant Transactions. Part of our business strategy is to merge with, acquire, or make investments in, businesses in the media services industry. The purpose of acquiring these businesses is to expand our digital distribution network, customer base and/or product offerings. Over the last three fiscal years we have completed the following transactions:
- •
- Purchase of Match Point
On October 1, 2010, we acquired the assets and operations of privately-held Match Point Media LLC and its divisions, Treehouse Media Services, Inc. and Voltage Video, Inc. (collectively referred to as "Match Point"), a market leader in the customization and distribution of direct response advertising, for $27.7 million in cash, which includes $1.0 million paid into escrow related to a potential earnout obligation. Depending on Match Point's future revenues we may be required to pay up to $3.0 million under the earnout obligation. Match Point provides media advertising services to advertising agencies and advertisers participating in the direct response advertising industry.
37
- •
- Merger with Enliven
- •
- Purchase of Vyvx
On October 2, 2008, we acquired all of the issued and outstanding shares of Enliven Marketing Technologies Corporation's ("Enliven") common stock we did not previously own in exchange for 2.9 million shares of our common stock. In the aggregate, including shares of Enliven previously held, the purchase price was $74.6 million. Enliven has two principal operating units, Unicast Communications Corp. ("Unicast") and Springbox Ltd. ("Springbox"). Unicast offers an online advertising campaign management product and Springbox is an Internet based marketing firm.
On June 5, 2008, we completed the acquisition of substantially all the assets and certain liabilities of the Vyvx advertising services business ("Vyvx"), including its distribution, post-production and related operations, from Level 3 Communications, Inc. ("Level 3"). Vyvx operated an advertising services and distribution business similar to our video and audio content distribution business. The acquisition was completed pursuant to an asset purchase agreement among Level 3, certain affiliates of Level 3 and us for a purchase price of $135.4 million in cash.
2010 Highlights
- •
- Diluted earnings increased to $1.50 per share, or 70%, compared to $0.88 per share in 2009.
- •
- Revenues from HD advertising increased $42.9 million, or 72%, from 2009.
- •
- Revenues from political advertising were $8.5 million, an increase of $6.4 million from 2009.
- •
- We issued 3.65 million shares of our common stock in a public equity offering raising $108 million. We used
a portion of the proceeds to repay all of our outstanding debt.
- •
- We acquired the net assets of Match Point, a direct response advertiser, for $27.7 million.
- •
- We repurchased 600,802 shares of our common stock for $13.1 million.
- •
- We recorded a non-cash impairment charge of $5.9 million, or $0.13 per diluted share, related to the write-down of certain intangible assets of our non-core Springbox unit.
38
2010 vs. 2009
The following table sets forth certain historical financial data (dollars in thousands).
| |
|
|
|
As a % of Revenue |
||||||||||||||
|---|---|---|---|---|---|---|---|---|---|---|---|---|---|---|---|---|---|---|
| |
Year Ended December 31, |
% Change | Year Ended December 31, |
|||||||||||||||
| |
2010 vs. 2009 |
|||||||||||||||||
| |
2010 | 2009 | 2010 | 2009 | ||||||||||||||
Revenues |
$ | 247,528 | $ | 190,886 | 30 | % | 100.0 | % | 100.0 | % | ||||||||
Costs and expenses: |
||||||||||||||||||
Cost of revenues(a) |
78,163 | 71,702 | 9 | 31.6 | 37.6 | |||||||||||||
Sales and marketing |
13,534 | 12,678 | 7 | 5.5 | 6.6 | |||||||||||||
Research and development |
10,601 | 6,257 | 69 | 4.3 | 3.3 | |||||||||||||
General and administrative |
33,758 | 26,446 | 28 | 13.6 | 13.8 | |||||||||||||
Depreciation and amortization |
29,992 | 26,501 | 13 | 12.1 | 13.9 | |||||||||||||
Impairment of Springbox unit |
5,866 | — | NM | 2.4 | — | |||||||||||||
Total costs and expenses |
171,914 | 143,584 | 20 | 69.5 | 75.2 | |||||||||||||
Income from operations |
75,614 | 47,302 | 60 | 30.5 | 24.8 | |||||||||||||
Other (income) expense: |
||||||||||||||||||
Interest expense |
7,350 | 11,774 | (38 | ) | 3.0 | 6.2 | ||||||||||||
Interest (income) and other expense, net |
(223 | ) | 85 | NM | (0.1 | ) | 0.1 | |||||||||||
Income before income taxes |
68,487 | 35,443 | 93 | 27.6 | 18.5 | |||||||||||||
Provision for income taxes |
26,918 | 14,942 | 80 | 10.9 | 7.8 | |||||||||||||
Net income |
$ | 41,569 | $ | 20,501 | 103 | % | 16.7 | % | 10.7 | % | ||||||||
- (a)
- Excludes depreciation and amortization.
NM—Not meaningful
Reconciliation of Income from Operations to Adjusted EBITDA (Non-GAAP financial measure)
Income from operations |
$ | 75,614 | $ | 47,302 | 60 | % | 30.5 | % | 24.8 | % | |||||||
Depreciation and amortization |
29,992 | 26,501 | 13 | 12.1 | 13.9 | ||||||||||||
Impairment of Springbox unit |
5,866 | — | NM | 2.4 | — | ||||||||||||
Share-based compensation |
4,805 | 3,983 | 21 | 2.0 | 2.1 | ||||||||||||
Adjusted EBITDA(b) |
$ | 116,277 | $ | 77,786 | 49 | 47.0 | 40.8 | ||||||||||
Reconciliation of Net Income to Non-GAAP Net Income (Non-GAAP financial measure)
Net income |
$ | 41,569 | $ | 20,501 | 103 | % | 16.7 | % | 10.7 | % | |||||||
Amortization of intangibles |
12,588 | 11,724 | 7 | 5.1 | 6.1 | ||||||||||||
Impairment of Springbox unit |
5,866 | — | NM | 2.4 | — | ||||||||||||
Share-based compensation |
4,805 | 3,983 | 21 | 2.0 | 2.1 | ||||||||||||
Write-off of deferred loan fees and loss on interest rate swap termination |
5,010 | 266 | NM | 2.0 | 0.2 | ||||||||||||
Income tax effect of above items |
(11,013 | ) | (6,734 | ) | 65 | (4.4 | ) | (3.5 | ) | ||||||||
Non-GAAP net income(b) |
$ | 58,825 | $ | 29,740 | 97 | 23.8 | 15.6 | ||||||||||
- (b)
- See discussion of Non-GAAP financial measures on a following page.
39
Revenues. For 2010, revenues increased $56.6 million, or 30%, as compared to 2009. The video and audio content distribution segment increased $58.4 million, partially offset by a $1.8 million decrease in the all other segment. The increase in the video and audio content distribution segment was primarily due to (i) a $42.9 million increase in HD revenue ($102.8 million in 2010 vs. $59.9 million in 2009) (ii) a $6.6 million increase in SD revenue and (iii) a $5.4 million increase in Unicast revenue, all of which were driven by an increase in deliveries, and (iv) the acquisition of Match Point on October 1, 2010 which contributed $4.9 million of revenue to 2010. HD revenue pricing per delivery decreased in 2010 as a result of a higher percentage of electronic deliveries (electronic deliveries are priced lower than physical deliveries) and the competitive environment. The increases in HD and SD revenue include political advertising revenue which increased $6.4 million ($8.5 million in 2010 vs. $2.1 million in 2009) as a result of the 2010 national, state and local elections. The all other segment revenues decreased $1.8 million due to a $2.0 million decline in Springbox revenue ($6.2 million in 2010 vs. $8.2 million in 2009) partially offset by a $0.2 million increase in SourceEcreative revenue. The decline in Springbox's revenue was primarily attributable to a decline in project-based revenues and the loss of two larger customers which have not yet been replaced.
Cost of Revenues. For 2010, cost of revenues increased $6.5 million, or 9%, as compared to 2009. As a percentage of revenues, cost of revenues decreased to 31.6% in 2010 as compared to 37.6% in 2009. A large portion of our cost structure is fixed. Therefore, as revenues increase our gross profit margin tends to increase. Costs of revenues increased due to (i) the inclusion of Match Point in our operating results ($3.1 million), (ii) higher personnel cost ($2.3 million) and (iii) higher video telecommunications charges associated with increased bandwidth capacity ($2.2 million), partially offset by non-cash consideration received in a lawsuit settlement with a vendor ($0.8 million).
Sales and Marketing. For 2010, sales and marketing expense increased $0.9 million, or 7%, as compared to 2009. The increase was principally attributable to (i) increases in advertising, marketing and travel costs ($0.7 million) associated with the increase in revenues and (ii) the inclusion of Match Point in our operating results ($0.1 million). As a percentage of revenues, sales and marketing expenses decreased to 5.5% in 2010 as compared to 6.6% in 2009.
Research and Development. For 2010, research and development costs increased $4.3 million, or 69%, as compared to 2009. The increase relates primarily to (i) a shift in software development initiatives from capitalizable projects to projects which are expensed as incurred ($3.3 million) and (ii) higher personnel costs ($0.7 million) and travel costs ($0.2 million).
General and Administrative. For 2010, general and administrative expense increased $7.3 million, or 28%, as compared to 2009. The increase was primarily attributable to higher (i) legal fees primarily related to settled lawsuits ($4.7 million) and (ii) personnel costs ($4.5 million), partially offset by a reduction in professional services fees ($0.9 million). Legal expense increased due to (i) settling a dispute with a vendor, (ii) costs related to potential business acquisitions (see note 3 to our consolidated financial statements) and (iii) defense costs associated with alleged securities violations (see note 14 to our consolidated financial statements). Personnel costs increased largely due to incentive compensation associated with our improved operating results.
Depreciation and Amortization. For 2010, depreciation and amortization expense increased $3.5 million, or 13%, as compared to 2009. The increase was primarily attributable to (i) increased depreciation associated with capitalized software development projects ($2.2 million), (ii) accelerated depreciation on a software development project that was retired early ($1.3 million) (iii) shortening the estimated useful life of the Pathfire customer relationships intangible asset ($0.3 million) and (iv) amortization associated with the acquired intangible assets of Match Point ($0.5 million), partially offset by lower depreciation as a result of certain capital assets being fully depreciated ($0.8 million).
40
Impairment of Springbox Unit. In 2010, our Springbox unit performed below our expectations primarily due to a decline in project-based revenues and the loss of two larger customers which have not yet been replaced. As a result, we conducted an impairment analysis of its long-lived assets at the end of 2010 and determined these assets were not fully recoverable. Because the long-lived assets were not fully recoverable, we adjusted their carrying value to their estimated fair value (determined using a discounted cash flow model) which resulted in an impairment charge of $5.9 million. We also evaluated the remaining useful life of the Springbox customer relationships asset, Springbox's primary asset, and determined a revised five year remaining life was appropriate, with the change effective as of January 1, 2011. We did not recognize any impairment charges during 2009.
Interest Expense. For 2010, interest expense decreased $4.4 million, or 38%, as compared to 2009. The decrease was due to a reduction in the average amount of debt outstanding during 2010, partially offset by (i) writing off $2.6 million more of deferred loan fees ($2.9 million in 2010 vs. $0.3 million in 2009) and (ii) reclassifying $2.1 million of accumulated losses from accumulated other comprehensive loss to interest expense in connection with retiring all of our debt and terminating our interest rate swaps in April 2010, and subsequently terminating our credit facility.
Interest Income and Other Expense, net. For 2010, interest income and other increased $0.3 million as compared to 2009. The increase was principally the result of larger cash balances available for investment and a decrease in other expenses.
Provision for Income Taxes. For 2010 and 2009, the provision for income taxes was 39.3% and 42.2%, respectively, of income before income taxes. The provisions for both periods differ from the expected federal statutory rate of 35% as a result of state and foreign income taxes and certain non-deductible expenses. During 2010, we eliminated two of our US subsidiaries, which resulted in lowering our effective state income tax rate as compared to 2009. For 2011, we expect our effective tax rate will be approximately 40% of income before income taxes.
Results of Operations
2009 vs. 2008
The following table sets forth certain historical financial data (dollars in thousands).
| |
|
|
|
As a % of Revenue |
||||||||||||||
|---|---|---|---|---|---|---|---|---|---|---|---|---|---|---|---|---|---|---|
| |
Year Ended December 31, |
% Change | Year Ended December 31, |
|||||||||||||||
| |
2009 vs. 2008 |
|||||||||||||||||
| |
2009 | 2008 | 2009 | 2008 | ||||||||||||||
Revenues |
$ | 190,886 | $ | 157,081 | 22 | % | 100.0 | % | 100.0 | % | ||||||||
Costs and expenses: |
||||||||||||||||||
Cost of revenues(a) |
71,702 | 64,443 | 11 | 37.6 | 41.0 | |||||||||||||
Sales and marketing |
12,678 | 8,257 | 54 | 6.6 | 5.3 | |||||||||||||
Research and development |
6,257 | 4,268 | 47 | 3.3 | 2.7 | |||||||||||||
General and administrative |
26,446 | 21,031 | 26 | 13.8 | 13.4 | |||||||||||||
Depreciation and amortization |
26,501 | 21,351 | 24 | 13.9 | 13.6 | |||||||||||||
Total costs and expenses |
143,584 | 119,350 | 20 | 75.2 | 76.0 | |||||||||||||
Income from operations |
47,302 | 37,731 | 25 | 24.8 | 24.0 | |||||||||||||
Other (income) expense: |
||||||||||||||||||
Interest expense |
11,774 | 12,122 | (3 | ) | 6.2 | 7.7 | ||||||||||||
Unrealized loss on warrant |
— | 1,544 | (100 | ) | — | 1.0 | ||||||||||||
Interest (income) and other expense, net |
85 | (586 | ) | (115 | ) | 0.1 | (0.4 | ) | ||||||||||
Income before income taxes |
35,443 | 24,651 | 44 | 18.5 | 15.7 | |||||||||||||
Provision for income taxes |
14,942 | 9,572 | 56 | 7.8 | 6.1 | |||||||||||||
Net income |
$ | 20,501 | $ | 15,079 | 36 | % | 10.7 | % | 9.6 | % | ||||||||
- (a)
- Excludes depreciation and amortization.
41
Reconciliation of Income from Operations to Adjusted EBITDA (Non-GAAP financial measure)
Income from operations |
$ | 47,302 | $ | 37,731 | 25 | % | 24.8 | % | 24.0 | % | |||||||
Depreciation and amortization |
26,501 | 21,351 | 24 | 13.9 | 13.6 | ||||||||||||
Share-based compensation |
3,983 | 1,177 | 238 | 2.1 | 0.8 | ||||||||||||
Adjusted EBITDA(b) |
$ | 77,786 | $ | 60,259 | 29 | 40.8 | 38.4 | ||||||||||
Reconciliation of Net Income to Non-GAAP Net Income (Non-GAAP financial measure)
Net income |
$ | 20,501 | $ | 15,079 | 36 | % | 10.7 | % | 9.6 | % | |||||||
Amortization of intangibles |
11,724 | 8,607 | 36 | 6.1 | 5.5 | ||||||||||||
Share-based compensation |
3,983 | 1,177 | 238 | 2.1 | 0.8 | ||||||||||||
Write-off of deferred loan fees and loss on interest rate swap termination |
266 | 69 | 286 | 0.2 | — | ||||||||||||
Income tax effect of above items |
(6,734 | ) | (3,826 | ) | 76 | (3.5 | ) | (2.5 | ) | ||||||||
Non-GAAP net income(b) |
$ | 29,740 | $ | 21,106 | 41 | 15.6 | 13.4 | ||||||||||
- (b)
- See discussion of Non-GAAP financial measures on a following page.
Revenues. For 2009, revenues increased $33.8 million, or 22%, as compared to the same period in the prior year. The increases were $28.4 million and $5.4 million from the video and audio content distribution and the all other segments, respectively. The increase in the video and audio content distribution segment was primarily due to (i) a $28.2 million increase in HD revenue ($59.9 million in 2009 vs. $31.7 million in 2008) driven by an increase in HD deliveries and (ii) a $10.1 million increase in revenue from the October 2008 acquisition of Unicast, partially offset by (iii) a decrease in the number of standard definition ("SD") deliveries and (iv) a $7.2 million decrease in political advertising in 2009 that had occurred in connection with the 2008 national, state and local elections. The $5.4 million increase in the all other segment relates to the addition of Springbox (acquired with Unicast in October 2008), partially offset by a slight decrease in SourceEcreative's ("SourceE") revenues.
Cost of Revenues. For 2009, cost of revenues increased $7.3 million, or 11%, as compared to the same period in the prior year. As a percentage of revenues, cost of revenues decreased to 37.6% in 2009 as compared to 41.0% in 2008. The decrease, on a percentage basis, was primarily attributable to (i) the elimination of substantially all duplicative infrastructure and personnel costs in the second quarter of 2009 associated with the June 2008 acquisition of Vyvx, (ii) a larger percentage of HD revenue, which has a higher profit margin than SD revenue, and (iii) lower delivery costs as a higher percentage of orders were delivered electronically. Prior to the second quarter of 2009, Vyvx had substantial duplicative infrastructure costs. In March 2009, we successfully completed the transition of all the former Vyvx customers over to our Irving NOC, and eliminated the costs associated with the former Vyvx NOC in Tulsa, Oklahoma.
Sales and Marketing. For 2009, sales and marketing expense increased $4.4 million, or 54%, as compared to the same period in the prior year. Substantially all the increase was attributable to the addition of Unicast. Unicast has been included in our operating results for twelve months in 2009 versus three months in 2008. Further, since acquiring Unicast in October 2008, we have added more resources to their sales and marketing efforts. Sales and marketing efficiencies gained, on a percentage basis, from the acquisition of Vyvx were offset by increases in costs associated with Unicast.
Research and Development. For 2009, research and development costs increased $2.0 million, or 47%, as compared to the same period in the prior year. The increase in research and development
42
costs relates to the addition of Unicast ($2.5 million), partially offset by shifting some employees to software development initiatives that are capitalizable.
General and Administrative. For 2009, general and administrative expense increased $5.4 million, or 26%, as compared to the same period in the prior year. The increase was primarily attributable to (i) higher stock-based compensation ($2.8 million), (ii) including Unicast and Springbox in our results for 12 months in 2009 versus three months in 2008 ($2.3 million), (iii) higher facilities costs ($0.6 million) and (iv) higher salary expense ($0.6 million), partially offset by lower incentive compensation ($0.5 million) and audit and tax expense ($0.4 million).
Depreciation and Amortization. For 2009, depreciation and amortization expense increased $5.2 million, or 24%, as compared to the same period in the prior year. The increase was primarily attributable to (i) a full year of amortization of the Vyvx and Enliven intangible assets acquired during 2008 versus a partial year of amortization in 2008 ($3.2 million), (ii) more amortization associated with the increase in capitalized software ($1.4 million) and (iii) a full year of depreciation associated with fixed assets acquired in the acquisition of Enliven versus a partial year of depreciation in 2008 ($0.7 million).
Interest Expense. For 2009, interest expense decreased $0.3 million, or 3%, as compared to the same period in the prior year. The decrease was due to a lower average interest rate partially offset by an increase in the average amount of debt outstanding during the year. The increase in debt was principally associated with $115 million of borrowings in connection with the purchase of Vyvx in June 2008, a portion of which was repaid in connection with scheduled quarterly principal payments and the proceeds from our June 2009 public equity offering. Excluding the amortization of fees and expenses, the weighted-average annual interest rate on our debt was 5.8% at December 31, 2009 versus 9.0% at December 31, 2008.
Unrealized Loss on Derivative Warrant. For 2008, the fair value of our Enliven warrant decreased by $1.5 million. The warrant met the definition of a derivative instrument which required changes in its fair value to be recorded in the statement of income. In connection with the October 2008 acquisition of Enliven, our Enliven warrant was effectively canceled.
Interest Income and Other Expense, net. For 2009, interest income and other decreased $0.7 million as compared to the same period in the prior year. The decrease was the result of a decrease in the average interest rate on invested cash, lower amounts of cash on hand and an increase in other expense.
Provision for Income Taxes. For 2009 and 2008 the provision for income taxes was 42% and 39%, respectively, of income before income taxes. The provisions for both periods differ from the expected federal statutory rate of 35% as a result of state and foreign income taxes and certain non-deductible expenses. The majority of the increase in the effective rate for 2009 relates to executive compensation which is not expected to be deductible. In 2009, we received a tax benefit for certain foreign losses which are not expected to occur in the future. Accordingly, we expected our effective tax rate would increase to about 44% of income before income taxes.
Non-GAAP Financial Measures
In addition to providing financial measurements based on generally accepted accounting principles in the United States of America ("GAAP"), we have historically provided additional financial measures that are not prepared in accordance with GAAP ("non-GAAP"). Legislative and regulatory changes discourage the use of and emphasis on non-GAAP financial measures and require companies to explain why non-GAAP financial measures are relevant to management and investors. We believe that the inclusion of these non-GAAP financial measures helps investors to gain a meaningful understanding of
43
our past performance and future prospects, consistent with how management measures and forecasts our performance, especially when comparing such results to previous periods or forecasts. Our management uses these non-GAAP measures, in addition to GAAP financial measures, as the basis for measuring our core operating performance and comparing such performance to that of prior periods and to the performance of our competitors. These measures are also used by management in its financial and operational decision-making. There are limitations associated with reliance on these non-GAAP financial measures because they are specific to our operations and financial performance, which makes comparisons with other companies' financial results more challenging. By providing both GAAP and non-GAAP financial measures, we believe that investors are able to compare our GAAP results to those of other companies while also gaining a better understanding of our operating performance as evaluated by management.
We define "Adjusted EBITDA" as net income, before interest, taxes, depreciation and amortization, share-based compensation, restructuring / impairment charges and benefits, and gains and losses on derivative instruments. We consider Adjusted EBITDA to be an important indicator of our operational strength and performance and a good measure of our historical operating trends.
Adjusted EBITDA eliminates items that are either not part of our core operations, such as gains and losses from derivative instruments, and net interest expense, or do not require a cash outlay, such as share-based compensation or impairment charges. Adjusted EBITDA also excludes depreciation and amortization expense, which is based on our estimate of the useful life of tangible and intangible assets. These estimates could vary from actual performance of the asset, are based on historical costs, and may not be indicative of current or future capital expenditures.
We define "non-GAAP net income" as net income before amortization of intangible assets, impairment charges and share-based compensation expense. Non-GAAP net income also excludes the one-time charges related to the early payoff of all outstanding indebtedness, specifically the loss recognized to terminate interest rate swap agreements and write-off of deferred loan fees. All amounts excluded from non-GAAP net income are reported net of the tax benefit these expenses provide.
We consider non-GAAP net income to be another important indicator of our overall performance because it eliminates the effects of events that are non-cash, or are not expected to recur as they are not part of our ongoing operations.
Adjusted EBITDA and non-GAAP net income should be considered in addition to, not as a substitute for, our operating income and net income, as well as other measures of financial performance reported in accordance with GAAP.
Reconciliation of Non-GAAP Financial Measures
In accordance with the requirements of Regulation G issued by the SEC, we are presenting the most directly comparable GAAP financial measures and reconciling the non-GAAP financial measures to the comparable GAAP measures.
44
The following table sets forth certain of our major balance sheet accounts as of December 31, 2010 and 2009 (in thousands):
| |
December 31, | |||||||
|---|---|---|---|---|---|---|---|---|
| |
2010 | 2009 | ||||||
Assets: |
||||||||
Cash and cash equivalents |
$ | 73,409 | $ | 33,870 | ||||
Accounts receivable, net |
64,099 | 51,309 | ||||||
Property and equipment, net |
39,461 | 41,520 | ||||||
Deferred income taxes, net |
14,729 | 28,066 | ||||||
Goodwill and intangible assets, net |
324,353 | 317,188 | ||||||
Liabilities: |
||||||||
Accounts payable and accrued liabilities |
17,685 | 21,878 | ||||||
Debt |
— | 102,462 | ||||||
Stockholders' equity |
496,912 |
347,166 |
||||||
Cash and cash equivalents fluctuate with changes in operating, investing and financing activities. In particular, cash and cash equivalents fluctuate with (i) operating results, (ii) the timing of payments, (iii) capital expenditures, (iv) acquisition and investment activity, (v) borrowings and repayments of debt, and (vi) capital activity. The increase in cash and cash equivalents primarily relates to (i) cash generated from operating activities ($84.4 million) and (ii) cash raised in a public equity offering ($107.9 million) in excess of (iii) cash used to pay off all of our debt ($102.5 million), (iv) cash used to acquire Match Point ($27.5 million) and (v) cash used to repurchase some of our shares ($13.1 million).
Accounts receivable generally fluctuate with the level of revenues. As revenues increase, accounts receivable tend to increase. The number of days of revenue included in accounts receivable was 78 and 82 days at December 31, 2010 and 2009, respectively.
Property and equipment tends to increase when we make significant improvements to our equipment, an expansion of our network or capitalized software development initiatives. It also can increase as a result of acquisition activity. Further, the balance of property and equipment is affected by recording depreciation expense. For 2010 and 2009, purchases of property and equipment were $8.5 million and $7.0 million, respectively. For 2010 and 2009, capitalized costs of developing software were $5.0 million and $7.0 million, respectively.
Goodwill and intangible assets increased during 2010 as a result of our acquisition of Match Point ($25.7 million), partially offset by normal amortization expense ($12.6 million) and recording an impairment charge related to our Springbox unit ($5.9 million).
Accounts payable and accrued liabilities decreased $4.2 million during 2010. The decrease primarily relates to the timing of payments and payments on capital lease obligations.
Debt decreased $102.5 million during 2010 due to using a portion of the proceeds from our April 2010 equity offering to retire all of our outstanding debt.
Stockholders' equity increased $149.7 million during 2010. The increase primarily relates to (i) receiving $107.9 million of net proceeds from our April 2010 equity offering, (ii) reporting net income of $41.6 million, (iii) the exercise of stock options and warrants of $7.8 million, and (iv) recording share-based compensation expense of $4.8 million, partially offset by the purchase of $13.1 million of our common stock.
45
Liquidity and Capital Resources
Cash Flows
The following table sets forth a summary of our statements of cash flows (in thousands):
| |
For the Years Ended December 31, | |||||||||||
|---|---|---|---|---|---|---|---|---|---|---|---|---|
| |
2010 | 2009 | 2008 | |||||||||
Operating activities: |
||||||||||||
Net income |
$ | 41,569 | $ | 20,501 | $ | 15,079 | ||||||
Depreciation and amortization |
29,992 | 26,501 | 21,351 | |||||||||
Impairment of Springbox unit |
5,866 | — | — | |||||||||
Deferred income taxes and other |
15,856 | 16,649 | 11,720 | |||||||||
Changes in operating assets and liabilities, net |
(8,925 | ) | (13,270 | ) | (6,770 | ) | ||||||
Total |
84,358 | 50,381 | 41,380 | |||||||||
Investing activities: |
||||||||||||
Purchases of property and equipment |
(8,498 | ) | (6,966 | ) | (12,384 | ) | ||||||
Capitalized costs of developing software |
(4,961 | ) | (6,950 | ) | (5,661 | ) | ||||||
Other |
81 | — | 7 | |||||||||
Acquisitions, net of cash acquired |
(27,501 | ) | — | (136,692 | ) | |||||||
Total |
(40,879 | ) | (13,916 | ) | (154,730 | ) | ||||||
Financing activities: |
||||||||||||
Proceeds from issuance of common stock, net of costs |
115,863 | 53,203 | 206 | |||||||||
Purchase of treasury stock and other |
(13,656 | ) | — | — | ||||||||
Borrowings (repayments) of debt, net |
(106,183 | ) | (72,911 | ) | 120,218 | |||||||
Total |
(3,976 | ) | (19,708 | ) | 120,424 | |||||||
Effect of exchange rate changes on cash |
36 | (67 | ) | 5 | ||||||||
Net increase in cash and cash equivalents |
39,539 | 16,690 | 7,079 | |||||||||
Cash and cash equivalents at beginning of year |
33,870 | 17,180 | 10,101 | |||||||||
Cash and cash equivalents at end of year |
$ | 73,409 | $ | 33,870 | $ | 17,180 | ||||||
We generate cash from operating activities principally from net income adjusted for certain non-cash expenses such as (i) depreciation and amortization and (ii) deferred income taxes. In 2010, we generated $84.4 million in cash from operating activities as compared to $50.4 million in 2009 and $41.4 million in 2008. The increases are largely driven by our improved operating results.
Historically, we have invested our cash in (i) property and equipment, (ii) the development of software, (iii) strategic investments and (iv) the acquisition of complementary businesses. During the last three fiscal years, we have acquired three businesses, one of which we first made a strategic investment in before acquiring the entire business.
Cash is obtained from financing activities principally as a result of issuing debt and equity instruments. We use cash in financing activities principally in the repayment of debt and purchase of treasury stock.
46
Sources of Liquidity
Our sources of liquidity include:
- •
- cash on hand,
- •
- cash generated from operating activities,
- •
- borrowings from any new credit facility, and
- •
- the issuance of equity securities.
As of December 31, 2010, we had $73.4 million of cash on hand. Historically, we have generated significant amounts of cash from operating activities. We expect this trend will continue.
We have the ability to issue equity instruments. As of December 31, 2010, we had two effective shelf registration statements on file with the SEC for the issuance of (i) up to a total of 1.47 million shares of our common stock and (ii) up to $100 million of preferred stock.
In April 2010, we issued 3.65 million shares of our common stock under a shelf registration statement that resulted in us receiving approximately $108 million of net proceeds. We used a portion of the proceeds to repay all of our outstanding debt. We are also currently seeking a credit facility that may be used in connection with potential acquisitions.
We believe our sources of liquidity, including our cash on hand and cash generated from operating and financing activities, will satisfy our capital needs for the next 12 months.
Cash Requirements
We expect to use cash in connection with:
- •
- the purchase of capital assets,
- •
- the purchase of our common stock,
- •
- the organic growth of our business, and
- •
- the strategic acquisition of media-related companies.
During 2011, we expect we will:
- •
- purchase property and equipment and incur capitalized software development costs ranging from $13 to $15 million.
We expect to use cash to further expand and develop our business. While we presently have no definitive plans, we may seek to acquire or merge with another company that we believe would be in the best interest of our shareholders.
The preparation of financial statements in conformity with generally accepted accounting principles in the United States requires us to make estimates and assumptions in determining the reported amounts of assets and liabilities and disclosure of contingent assets and liabilities at the date of the financial statements and the reported amounts of revenues and expenses during the reporting period. Actual results could differ from our estimates. Our significant accounting policies and methods used in the preparation of our consolidated financial statements are discussed in Note 2 of the notes to consolidated financial statements. Following is a discussion of our critical accounting policies.
47
Business Combinations. We account for business combinations under the acquisition method of accounting. Under the acquisition method, the assets acquired and liabilities assumed are recorded at their estimated fair values at the acquisition date. The excess of consideration transferred over the fair value of assets acquired and liabilities assumed is recorded as goodwill. Determining the nature of identifiable intangible assets and the fair value of assets acquired and liabilities assumed requires management's judgment and often involves the use of significant estimates and assumptions regarding expected future cash flows of the acquired entity. The value assigned to a specific asset or liability, and the period over which an asset is depreciated or amortized can impact future earnings. Some of the more significant estimates made in business combinations relate to the values assigned to identifiable intangible assets, such as customer relationships and trade names, and the period over which these assets are amortized. Further, we sometimes agree to contingent consideration arrangements based on the acquired entity's future operating results. Valuing contingent consideration obligations requires us to make significant estimates about future results.
Goodwill. We have three reporting units; video and audio content distribution ("ADS"), SourceEcreative ("SourceE") and Springbox. These reporting units are also operating segments. Only the ADS and SourceE reporting units have goodwill. On an annual basis, or more frequently upon the occurrence of certain events, we test for goodwill impairment using a two-step process. The first step is to identify a potential impairment by comparing the fair value of a reporting unit with its carrying amount. The fair value of a reporting unit is determined based on a discounted cash flow analysis or other methods of valuation including market capitalization. A discounted cash flow analysis requires us to make various assumptions, including assumptions about future cash flows, growth rates and discount rates. The assumptions about future cash flows and growth rates are based on our long-term projections by reporting unit. The discount rate used reflects our weighted-average cost of capital. If the fair value of a reporting unit exceeds its carrying amount, there is no impairment. If not, the second step of the goodwill impairment test compares the implied fair value of the reporting unit's goodwill with its carrying amount. To the extent the carrying amount of the reporting unit's goodwill exceeds its implied fair value, a write-down of the reporting unit's goodwill would be necessary.
We did not recognize a goodwill impairment loss for 2010, 2009 or 2008. At December 31, 2010, the fair value of the ADS and SourceE reporting units exceeded their carrying value by approximately 75% and 900%, respectively.
Future impairment charges, while not presently anticipated or foreseen, could occur if future net cash flows from these reporting units were to decline significantly. Future net cash flows are impacted by a variety of factors including revenues, operating margins and income taxes.
Impairment of Long-Lived Assets. Long-lived assets principally relate to acquired identifiable intangible assets, such as customer relationships and trade names, and property and equipment including capitalized internally-developed software and network equipment. In determining whether long-lived assets are impaired, the accounting rules do not provide for an annual impairment test. Instead they require that a triggering event occur before testing an asset for impairment. Triggering events include poor operating performance, significant negative trends and significant changes in the use of such assets. Once a triggering event has occurred, an impairment test is employed based on whether the intent is to hold the asset for continued use or hold the asset for sale. If the intent is to hold the asset for continued use, first a comparison of projected undiscounted future cash flows against the carrying value of the asset is performed. If the carrying value exceeds the undiscounted future cash flows, the asset would be written down to its fair value. Fair value is determined using a discounted cash flow model. If the intent is to hold the asset for sale, then to the extent the asset's carrying value is greater than its fair value less selling costs, an impairment loss is recognized for the difference. The most significant assumption relates to the projection of future cash flows. We also evaluate the estimated useful life of long-lived assets reviewed for impairment. In 2010, we recognized an impairment charge of $5.9 million, primarily related to the customer relationships at our Springbox
48
unit. See Note 11 of our consolidated financial statements. For the years ended December 31, 2009 and 2008, we did not recognize any impairment losses related to long-lived assets.
Income Taxes. Deferred taxes arise as a result of temporary differences between amounts recognized in accordance with generally accepted accounting principles and amounts recognized for federal and state income tax purposes. We have both deferred tax assets and deferred tax liabilities, which are shown on a net current and net non-current basis on the accompanying consolidated balance sheets. Deferred tax assets relate primarily to net operating loss ("NOL") carryforwards. Deferred tax liabilities relate primarily to intangible assets, such as customer relationships and trade names, some of which have little or no tax basis.
Valuation allowances are provided against deferred tax assets if a determination is made that their ultimate realization is not likely. Significant judgment is required in making these assessments, which generally relate to whether an acquired operation will generate future taxable income. We did not recognize any write-offs of deferred tax assets for the years ended December 31, 2010, 2009 or 2008, nor do we presently foresee any such write-offs.
Revenue Recognition. We derive revenue from services which consist primarily of (i) the distribution of digital and analog video and audio media content, (ii) media research resources, and (iii) support and other services. We recognize revenue only when all of the following criteria have been met:
- •
- Persuasive evidence of an arrangement exists,
- •
- Delivery has occurred or services have been rendered,
- •
- Our price to the customer is fixed or determinable, and
- •
- Collectability is reasonably assured.
Below are descriptions of our services and other offerings, and generally the triggering point of revenue recognition, provided all other revenue recognition criteria have been met.
Our services revenue from the digital distribution of video and audio advertising content generally is billed based on a rate per transmission, and we recognize revenue for these services upon notification the advertising content was received at the broadcast destination. Revenue for the distribution of analog video and audio content by tape is recognized when delivery has occurred, which is at the time the tapes are delivered to a common carrier. Shipping and handling costs are included in costs of revenue.
We offer an online advertising campaign management and deployment product. This product allows publishers, advertisers, and their agencies to manage the process of deploying online advertising campaigns. We charge our customers on a cost per thousand ("CPM") impressions basis, and recognize revenue when the impressions are served.
Our services revenue includes access rights. For an agreed upon fee, we provide certain of our customers with access to our digital distribution network for a stated period. Using our network, these customers are able to deliver a variety of programming content to their intended destinations. Access rights revenue is recognized ratably over the access period. We also charge fees to monitor our network on behalf of our customers. The monitoring fees are recognized ratably over the monitoring period.
We sell monthly, quarterly, semi-annual and annual subscriptions to access our online creative research database. We recognize revenue ratably over the subscription period.
Media production and duplication includes a variety of ancillary services such as storage of client masters or other physical material. Revenue for these services is recognized ratably over the storage period. Revenue related to our other services is recognized on a per transaction basis after the service
49
has been performed. If the service results in a tape or other deliverable, revenue is recognized when delivery has occurred, which is at the time the tape or other deliverable is delivered to a common carrier.
Customers pay a fixed fee per month for our media asset management and broadcast verification services. Revenue for these services is recognized ratably over the service period.
We have a creative services group that builds content to a format specified by our customers. We charge fees for these services based on the time incurred and materials used to complete the project. Revenue related to retainers is recognized ratably over the retainer term. Certain project revenue is recognized on a completed-contract basis. For projects where we can reasonably estimate the total project costs and the portion of the entire project complete at any point, we use the proportional performance method for recognizing revenue. Under the proportional performance method, revenue is recognized based on the level of effort incurred to date compared to the total estimated level of effort required for the entire project.
Recently Adopted and Recently Issued Accounting Guidance
See Recently Adopted and Recently Issued Accounting Guidance in Note 2 to our consolidated financial statements.
Contractual Payment Obligations
The table below summarizes our contractual obligations at December 31, 2010 (in thousands):
| |
|
Payments Expected by Period | |||||||||||||||
|---|---|---|---|---|---|---|---|---|---|---|---|---|---|---|---|---|---|
Contractual Obligations
|
Total | Less Than 1 Year |
1.00 - 2.99 Years |
3.00 - 4.99 Years |
After 5 Years |
||||||||||||
Operating leases |
$ | 24,080 | $ | 6,222 | $ | 7,563 | $ | 4,958 | $ | 5,337 | |||||||
Employment contracts |
6,001 | 3,165 | 1,961 | 875 | — | ||||||||||||
Unconditional purchase obligations |
13,578 | 6,157 | 7,421 | — | — | ||||||||||||
Total contractual obligations |
$ | 43,659 | $ | 15,544 | $ | 16,945 | $ | 5,833 | $ | 5,337 | |||||||
Off-Balance Sheet Arrangements
We have entered into operating leases for all of our office facilities and certain equipment rentals. Generally these leases are for periods of three to five years and usually contain one or more renewal options. We use leasing arrangements to preserve capital. We expect to continue to lease the majority of our office facilities under arrangements substantially consistent with the past. For the years ended December 31, 2010, 2009 and 2008, rent expense, net of sublease rentals, for all operating leases amounted to $6.2 million, $6.5 million and $5.0 million, respectively.
Other than our operating leases, we are not a party to any off-balance sheet arrangement that we believe is likely to have a material impact on our current or future financial condition, revenues or expenses, results of operations, liquidity, capital expenditures or capital resources.
ITEM 7A. QUANTITATIVE AND QUALITATIVE DISCLOSURES ABOUT MARKET RISK
Market risk is the potential loss arising from adverse changes in market rates and prices, such as interest rates and changes in the market value of financial instruments.
50
Foreign Currency Exchange Risk
We provide limited services to entities located outside the United States and, therefore, believe the risk that changes in exchange rates will have a material adverse impact on our results of operations is remote. Historically, our foreign currency exchange gains and losses have been immaterial.
ITEM 8. FINANCIAL STATEMENTS AND SUPPLEMENTARY DATA
The information required by this Item is set forth in our consolidated financial statements and the notes thereto beginning at Page F-1 of this report.
ITEM 9. CHANGES IN AND DISAGREEMENTS WITH ACCOUNTANTS ON ACCOUNTING AND FINANCIAL DISCLOSURE
None
ITEM 9A. CONTROLS AND PROCEDURES
Disclosure Controls and Procedures
In accordance with Rule 13a-15(b) of the Securities Exchange Act of 1934 (the "Exchange Act"), as of the end of the period covered by this Annual Report on Form 10-K, we have evaluated, with the participation of our principal executive officer and principal financial officer, the effectiveness of the design and operation of our disclosure controls and procedures (as defined in Rule 13a-15(e) under the Exchange Act). Based on their evaluation of these disclosure controls and procedures, our chief executive officer and chief financial officer have concluded that the disclosure controls and procedures were effective as of the date of such evaluation.
Management's Report on Internal Control Over Financial Reporting
We are responsible for establishing and maintaining adequate internal control over financial reporting, as such term is defined in Exchange Act Rule 13a-15(f). Because of its inherent limitations, internal control over financial reporting may not prevent or detect misstatements. Also, projections of any evaluation of effectiveness to future periods are subject to the risk that controls may become inadequate because of changes in conditions, or that the degree of compliance with the policies or procedures may deteriorate.
We are using the framework set forth in the report entitled "Internal Control—Integrated Framework" published by the Committee of Sponsoring Organizations of the Treadway Commission (referred to as "COSO") to evaluate the effectiveness of our internal control over financial reporting. Based on our assessment, we have concluded our internal control over financial reporting was effective as of December 31, 2010.
Our internal control over financial reporting as of December 31, 2010, has been audited by Ernst & Young LLP, an independent registered public accounting firm. Ernst & Young's report on our internal control over financial reporting appears below.
Changes in Internal Controls over Financial Reporting
During the three months ended December 31, 2010, there have been no changes in our internal control over financial reporting that have materially affected, or are reasonably likely to materially affect, our internal control over financial reporting.
51
Report of Independent Registered Public Accounting Firm
The Board of Directors and Shareholders of DG FastChannel, Inc.
We have audited DG FastChannel, Inc. and subsidiaries' (the Company) internal control over financial reporting as of December 31, 2010, based on criteria established in Internal Control—Integrated Framework issued by the Committee of Sponsoring Organizations of the Treadway Commission (the COSO criteria). The Company's management is responsible for maintaining effective internal control over financial reporting and for its assessment of the effectiveness of internal control over financial reporting included in the accompanying "Management's Report on Internal Control Over Financial Reporting." Our responsibility is to express an opinion on the Company's internal control over financial reporting based on our audit.
We conducted our audit in accordance with the standards of the Public Company Accounting Oversight Board (United States). Those standards require that we plan and perform the audit to obtain reasonable assurance about whether effective internal control over financial reporting was maintained in all material respects. Our audit included obtaining an understanding of internal control over financial reporting, assessing the risk that a material weakness exists, testing and evaluating the design and operating effectiveness of internal control based upon the assessed risk, and performing such other procedures as we considered necessary in the circumstances. We believe that our audit provides a reasonable basis for our opinion.
A company's internal control over financial reporting is a process designed to provide reasonable assurance regarding the reliability of financial reporting and the preparation of financial statements for external purposes in accordance with generally accepted accounting principles. A company's internal control over financial reporting includes those policies and procedures that (1) pertain to the maintenance of records that, in reasonable detail, accurately and fairly reflect the transactions and dispositions of the assets of the company; (2) provide reasonable assurance that transactions are recorded as necessary to permit preparation of financial statements in accordance with generally accepted accounting principles, and that receipts and expenditures of the company are being made only in accordance with authorizations of management and directors of the company; and (3) provide reasonable assurance regarding prevention or timely detection of unauthorized acquisition, use, or disposition of the company's assets that could have a material effect on the financial statements.
Because of its inherent limitations, internal control over financial reporting may not prevent or detect misstatements. Also, projections of any evaluation of effectiveness to future periods are subject to the risk that controls may become inadequate because of changes in conditions, or that the degree of compliance with the policies or procedures may deteriorate.
In our opinion, DG FastChannel, Inc. and subsidiaries maintained, in all material respects, effective internal control over financial reporting as of December 31, 2010, based on the COSO criteria.
We also have audited, in accordance with the standards of the Public Company Accounting Oversight Board (United States), the consolidated balance sheets of DG FastChannel, Inc. and subsidiaries as of December 31, 2010 and 2009 and the related consolidated statements of income, stockholders' equity and cash flows for each of the three years in the period ended December 31, 2010 and our report dated March 1, 2011 expressed an unqualified opinion thereon.
/s/ Ernst & Young LLP
Dallas,
Texas
March 1, 2011
52
None.
ITEM 10. Directors, Executive Officers and Corporate Governance.
Information concerning this item is incorporated herein by reference to the information under the headings "Corporate Governance", "Board of Directors and Committees", "Executive Officers" and "Section 16(a) Beneficial Ownership Reporting Compliance" in the Company's Proxy Statement or amendment to this Form 10-K to be filed within 120 days of year end as required.
ITEM 11. Executive Compensation.
The information concerning this item is incorporated by reference to the information under the headings "Management Compensation," "Compensation of Directors," and "Corporate Governance," in the Company's Proxy Statement or amendment to this Form 10-K to be filed within 120 days of year end as required.
ITEM 12. Security Ownership of Certain Beneficial Owners and Management and Related Stockholder Matters.
The information concerning this item is incorporated by reference to the information under the heading "Principal Stockholders and Management Ownership" and "Equity Compensation Plan Information," in the Company's Proxy Statement or amendment to this Form 10-K to be filed within 120 days of year end as required.
ITEM 13. Certain Relationships and Related Transactions, and Director Independence.
The information concerning this item is incorporated by reference to the information under the heading "Certain Transactions," in the Company's Proxy Statement or amendment to this Form 10-K to be filed within 120 days of year end as required.
ITEM 14. Principal Accounting Fees and Services.
The information concerning this item is incorporated by reference to the information under the heading "Independent Registered Public Accounting Firm Fees," in the Company's Proxy Statement or amendment to this Form 10-K to be filed within 120 days of year end as required.
ITEM 15. EXHIBITS, FINANCIAL STATEMENT SCHEDULES
(a)(1) See Index to Financial Statements on page F-1 for a list of financial statements filed herewith.
(a)(2) See Schedule II-Valuation and Qualifying Accounts on page S-1.
(a)(3) See Exhibit Index on page 56 for a list of exhibits filed as part of this Form 10-K.
53
Pursuant to the requirements of Section 13 or 15(d) of the Securities Exchange Act of 1934, the registrant has duly caused this report to be signed on its behalf by the undersigned, thereunto duly authorized.
| DG FASTCHANNEL, INC. | ||||
Date: March 1, 2011 |
By: |
/s/ SCOTT K. GINSBURG Scott K. Ginsburg Chairman of the Board of Directors and Chief Executive Officer |
||
KNOW ALL MEN BY THESE PRESENTS, that each person whose signature appears below constitutes and appoints Scott K. Ginsburg and Omar A. Choucair, and each of them, his true and lawful attorneys-in-fact and agents, with full power of substitution and resubstitution, for him in his name, place and stead, in any and all capacities, to sign any or all amendments to this Form 10-K and to file the same, with all exhibits thereto, and all other documents in connection therewith, with the Securities and Exchange Commission, granting unto said attorneys-in-fact and agents, and each of them, full power and authority to do and perform each and every act and thing requisite and necessary to be done in and about the premises, as fully to all intents and purposes as he might or could do in person, hereby ratifying and confirming all that said attorneys-in-fact and agents, or any of them, or its or his substitute or substitutes, may lawfully do or cause to be done by virtue thereof.
Pursuant to the requirements of the Securities Act of 1934, this report has been signed by the following persons on behalf of the registrant and in the capacities and on the dates indicated.
Name
|
Title
|
Date
|
||
|---|---|---|---|---|
| /s/ SCOTT K. GINSBURG Scott K. Ginsburg |
Chairman of the Board of Directors and Chief Executive Officer | March 1, 2011 | ||
/s/ NEIL H. NGUYEN Neil H. Nguyen |
President, Chief Operating Officer and Director |
March 1, 2011 |
||
/s/ OMAR A. CHOUCAIR Omar A. Choucair |
Chief Financial Officer and Director (Principal Financial and Accounting Officer) |
March 1, 2011 |
||
/s/ WILLIAM DONNER William Donner |
Director |
March 1, 2011 |
||
/s/ DAVID M. KANTOR David M. Kantor |
Director |
March 1, 2011 |
54
Name
|
Title
|
Date
|
||
|---|---|---|---|---|
| /s/ LISA C. GALLAGHER Lisa C. Gallagher |
Director | March 1, 2011 | ||
/s/ KEVIN C. HOWE Kevin C. Howe |
Director |
March 1, 2011 |
||
/s/ ANTHONY J. LEVECCHIO Anthony J. LeVecchio |
Director |
March 1, 2011 |
||
/s/ JOHN R. HARRIS John R. Harris |
Director |
March 1, 2011 |
55
F-1
DG FASTCHANNEL, INC. AND SUBSIDIARIES
Report of Independent Registered Public Accounting Firm
The Board of Directors and Shareholders of DG FastChannel, Inc.
We have audited the accompanying consolidated balance sheets of DG FastChannel, Inc. and subsidiaries (the Company) as of December 31, 2010 and 2009, and the related consolidated statements of income, stockholders' equity and cash flows for each of the three years in the period ended December 31, 2010. Our audits also included the information in the financial statement schedule listed in the Index at Item 15(a)(2). These financial statements and schedule are the responsibility of the Company's management. Our responsibility is to express an opinion on these financial statements and schedule based on our audits.
We conducted our audits in accordance with the standards of the Public Company Accounting Oversight Board (United States). Those standards require that we plan and perform the audit to obtain reasonable assurance about whether the financial statements are free of material misstatement. An audit includes examining, on a test basis, evidence supporting the amounts and disclosures in the financial statements. An audit also includes assessing the accounting principles used and significant estimates made by management, as well as evaluating the overall financial statement presentation. We believe that our audits provide a reasonable basis for our opinion.
In our opinion, the financial statements referred to above present fairly, in all material respects, the consolidated financial position of DG FastChannel, Inc. and subsidiaries at December 31, 2010 and 2009 and the consolidated results of their operations and their cash flows for each of the three years in the period ended December 31, 2010, in conformity with U.S. generally accepted accounting principles. Also, in our opinion, the information included in the related financial statement schedule, when considered in relation to the basic financial statements taken as a whole, presents fairly in all material respects the information set forth therein.
We also have audited, in accordance with the standards of the Public Company Accounting Oversight Board (United States), the Company's internal control over financial reporting as of December 31, 2010, based on criteria established in Internal Control—Integrated Framework issued by the Committee of Sponsoring Organizations of the Treadway Commission and our report dated March 1, 2011 expressed an unqualified opinion thereon.
/s/ Ernst & Young LLP
Dallas,
Texas
March 1, 2011
F-2
DG FASTCHANNEL, INC. AND SUBSIDIARIES
CONSOLIDATED BALANCE SHEETS
(In thousands, except par value amounts)
| |
December 31, 2010 |
December 31, 2009 |
||||||
|---|---|---|---|---|---|---|---|---|
Assets |
||||||||
CURRENT ASSETS: |
||||||||
Cash and cash equivalents |
$ | 73,409 | $ | 33,870 | ||||
Accounts receivable (less allowances of $2,503 in 2010 and $2,116 in 2009) |
64,099 | 51,309 | ||||||
Deferred income taxes |
1,955 | 2,778 | ||||||
Other current assets |
2,626 | 1,749 | ||||||
Total current assets |
142,089 | 89,706 | ||||||
Property and equipment, net |
39,461 | 41,520 | ||||||
Goodwill |
226,257 | 214,777 | ||||||
Deferred income taxes, net of current portion |
12,774 | 25,288 | ||||||
Intangible assets, net |
98,096 | 102,411 | ||||||
Other non-current assets |
1,327 | 4,590 | ||||||
Total assets |
$ | 520,004 | $ | 478,292 | ||||
Liabilities and Stockholders' Equity |
||||||||
CURRENT LIABILITIES: |
||||||||
Accounts payable |
$ | 6,546 | $ | 8,415 | ||||
Accrued liabilities |
11,139 | 13,463 | ||||||
Deferred revenue |
1,450 | 2,178 | ||||||
Current portion of long-term debt |
— | 21,500 | ||||||
Total current liabilities |
19,135 | 45,556 | ||||||
Deferred revenue, net of current portion |
— | 28 | ||||||
Long-term debt, net of current portion |
— | 80,962 | ||||||
Other non-current liabilities |
3,957 | 4,580 | ||||||
Total liabilities |
23,092 | 131,126 | ||||||
Commitments and contingencies (note 14) |
||||||||
STOCKHOLDERS' EQUITY: |
||||||||
Preferred stock, $0.001 par value—Authorized 15,000 shares; issued and outstanding—none |
— | — | ||||||
Common stock, $0.001 par value—Authorized 200,000 shares; 28,579 issued and 27,922 outstanding at December 31, 2010; 24,045 issued and 23,989 outstanding at December 31, 2009 |
29 | 24 | ||||||
Additional capital |
614,705 | 494,783 | ||||||
Accumulated deficit |
(103,796 | ) | (145,365 | ) | ||||
Accumulated other comprehensive loss |
(25 | ) | (1,423 | ) | ||||
Treasury stock, at cost—657 and 56 shares, respectively |
(14,001 | ) | (853 | ) | ||||
Total stockholders' equity |
496,912 | 347,166 | ||||||
Total liabilities and stockholders' equity |
$ | 520,004 | $ | 478,292 | ||||
The accompanying notes are an integral part of these financial statements.
F-3
DG FASTCHANNEL, INC. AND SUBSIDIARIES
CONSOLIDATED STATEMENTS OF INCOME
(In thousands, except per share amounts)
| |
For the Years Ended December 31, | |||||||||||
|---|---|---|---|---|---|---|---|---|---|---|---|---|
| |
2010 | 2009 | 2008 | |||||||||
Revenues: |
||||||||||||
Video and audio content distribution |
$ | 235,751 | $ | 177,306 | $ | 148,891 | ||||||
Other |
11,777 | 13,580 | 8,190 | |||||||||
Total revenues |
247,528 | 190,886 | 157,081 | |||||||||
Cost of revenues (excluding depreciation and amortization): |
||||||||||||
Video and audio content distribution |
72,385 | 65,329 | 61,726 | |||||||||
Other |
5,778 | 6,373 | 2,717 | |||||||||
Total cost of revenues |
78,163 | 71,702 | 64,443 | |||||||||
Operating expenses: |
||||||||||||
Sales and marketing |
13,534 | 12,678 | 8,257 | |||||||||
Research and development |
10,601 | 6,257 | 4,268 | |||||||||
General and administrative |
33,758 | 26,446 | 21,031 | |||||||||
Depreciation and amortization |
29,992 | 26,501 | 21,351 | |||||||||
Impairment of Springbox unit |
5,866 | — | — | |||||||||
Total operating expenses |
93,751 | 71,882 | 54,907 | |||||||||
Income from operations |
75,614 | 47,302 | 37,731 | |||||||||
Other expense: |
||||||||||||
Interest expense |
7,350 | 11,774 | 12,122 | |||||||||
Unrealized loss on derivative warrant investment |
— | — | 1,544 | |||||||||
Interest (income) and other expense, net |
(223 | ) | 85 | (586 | ) | |||||||
Income before income taxes |
68,487 | 35,443 | 24,651 | |||||||||
Provision for income taxes |
26,918 | 14,942 | 9,572 | |||||||||
Net income |
$ | 41,569 | $ | 20,501 | $ | 15,079 | ||||||
Earnings per common share: |
||||||||||||
Basic |
$ | 1.52 | $ | 0.90 | $ | 0.81 | ||||||
Diluted |
$ | 1.50 | $ | 0.88 | $ | 0.79 | ||||||
Weighted average common shares outstanding: |
||||||||||||
Basic |
27,226 | 22,572 | 18,642 | |||||||||
Diluted |
27,570 | 23,091 | 19,073 | |||||||||
The accompanying notes are an integral part of these financial statements.
F-4
DG FASTCHANNEL, INC. AND SUBSIDIARIES
CONSOLIDATED STATEMENTS OF STOCKHOLDERS' EQUITY
(In thousands)
| |
Common Stock |
Treasury Stock |
Additional Capital |
Accumulated Other Comprehensive Income (Loss) |
Accumulated Deficit |
Total Stockholders' Equity |
|||||||||||||||||||||
|---|---|---|---|---|---|---|---|---|---|---|---|---|---|---|---|---|---|---|---|---|---|---|---|---|---|---|---|
Balance at December 31, 2007 |
17,963 | $ | 18 | (56 | ) | $ | (853 | ) | $ | 368,488 | $ | 5,421 | $ | (180,945 | ) | $ | 192,129 | ||||||||||
Common stock issued on exercise of stock options |
11 | — | — | — | 128 | — | — | 128 | |||||||||||||||||||
Common stock issued to acquire Enliven, including stock options, warrants and an estimated earnout, net of costs |
2,951 | 3 | — | — | 68,099 | — | — | 68,102 | |||||||||||||||||||
Common stock issued under employee stock purchase plan |
5 | — | — | — | 87 | — | — | 87 | |||||||||||||||||||
Share-based compensation |
— | — | — | — | 1,177 | — | — | 1,177 | |||||||||||||||||||
Comprehensive income: |
|||||||||||||||||||||||||||
Foreign currency translation adjustment |
— | — | — | — | — | 5 | — | 5 | |||||||||||||||||||
Unrealized loss on interest rate swaps (net of tax benefit of $1,179) |
— | — | — | — | — | (1,769 | ) | — | (1,769 | ) | |||||||||||||||||
Reverse unrealized gain on long-term investment in Enliven upon acquisition (net of tax benefit of $3,409) |
— | — | — | — | — | (5,420 | ) | — | (5,420 | ) | |||||||||||||||||
Net income |
— | — | — | — | — | — | 15,079 | 15,079 | |||||||||||||||||||
Total comprehensive income |
7,895 | ||||||||||||||||||||||||||
Balance at December 31, 2008 |
20,930 | 21 | (56 | ) | (853 | ) | 437,979 | (1,763 | ) | (165,866 | ) | 269,518 | |||||||||||||||
Common stock issued in equity offering, net of costs |
2,875 | 3 | — | — | 52,484 | — | — | 52,487 | |||||||||||||||||||
Common stock issued on exercise of stock options and warrants |
137 | — | — | — | 1,479 | — | — | 1,479 | |||||||||||||||||||
Common stock issued in connection with Enliven earnout |
13 | — | — | — | — | — | — | — | |||||||||||||||||||
Adjustment to Enliven earnout |
— | — | — | — | (382 | ) | — | — | (382 | ) | |||||||||||||||||
Common stock issued under employee stock purchase plan |
9 | — | — | — | 130 | — | — | 130 | |||||||||||||||||||
Common stock issued on vesting of restricted stock |
7 | — | — | — | — | — | — | — | |||||||||||||||||||
Common stock issued pursuant to restricted stock agreement, net of shares tendered to satisfy required tax withholding |
74 | — | — | — | (890 | ) | — | — | (890 | ) | |||||||||||||||||
Share-based compensation |
— | — | — | — | 3,983 | — | — | 3,983 | |||||||||||||||||||
Comprehensive income: |
|||||||||||||||||||||||||||
Foreign currency translation adjustment |
— | — | — | — | — | (67 | ) | — | (67 | ) | |||||||||||||||||
Unrealized gain on interest rate swaps (net of tax expense of $276) |
— | — | — | — | — | 407 | — | 407 | |||||||||||||||||||
Net income |
— | — | — | — | — | — | 20,501 | 20,501 | |||||||||||||||||||
Total comprehensive income |
20,841 | ||||||||||||||||||||||||||
Balance at December 31, 2009 |
24,045 | 24 | (56 | ) | (853 | ) | 494,783 | (1,423 | ) | (145,365 | ) | 347,166 | |||||||||||||||
Common stock issued in equity offering, net of costs |
3,651 | 4 | — | — | 107,913 | — | — | 107,917 | |||||||||||||||||||
Common stock issued on exercise of stock options and warrants |
753 | 1 | — | — | 7,817 | — | — | 7,818 | |||||||||||||||||||
Common stock issued in connection with Enliven earnout |
41 | — | — | — | — | — | — | — | |||||||||||||||||||
Common stock issued under employee stock purchase plan |
5 | — | — | — | 128 | — | — | 128 | |||||||||||||||||||
Common stock issued on vesting of restricted stock |
10 | — | — | — | — | — | — | — | |||||||||||||||||||
Common stock issued pursuant to restricted stock agreement, net of shares tendered to satisfy required tax withholding |
74 | — | — | — | (1,620 | ) | — | — | (1,620 | ) | |||||||||||||||||
Tax benefit from exercise of non-qualified stock options and vesting of restricted stock |
— | — | — | — | 879 | — | — | 879 | |||||||||||||||||||
Purchase of treasury stock |
— | — | (601 | ) | (13,148 | ) | — | — | — | (13,148 | ) | ||||||||||||||||
Share-based compensation |
— | — | — | — | 4,805 | — | — | 4,805 | |||||||||||||||||||
Comprehensive income: |
|||||||||||||||||||||||||||
Foreign currency translation adjustment |
— | — | — | — | — | 36 | — | 36 | |||||||||||||||||||
Reclassification of unrealized loss on interest rate swaps (net of tax benefit of $903) |
— | — | — | — | — | 1,362 | — | 1,362 | |||||||||||||||||||
Net income |
— | — | — | — | — | — | 41,569 | 41,569 | |||||||||||||||||||
Total comprehensive income |
42,967 | ||||||||||||||||||||||||||
Balance at December 31, 2010 |
28,579 | $ | 29 | (657 | ) | $ | (14,001 | ) | $ | 614,705 | $ | (25 | ) | $ | (103,796 | ) | $ | 496,912 | |||||||||
The accompanying notes are an integral part of these financial statements.
F-5
DG FASTCHANNEL, INC. AND SUBSIDIARIES
CONSOLIDATED STATEMENTS OF CASH FLOWS
(In thousands)
| |
For the Years Ended December 31, | ||||||||||||
|---|---|---|---|---|---|---|---|---|---|---|---|---|---|
| |
2010 | 2009 | 2008 | ||||||||||
Cash flows from operating activities: |
|||||||||||||
Net income |
$ | 41,569 | $ | 20,501 | $ | 15,079 | |||||||
Adjustments to reconcile net income to net cash provided by operating activities: |
|||||||||||||
Depreciation of property and equipment |
17,404 | 14,777 | 12,744 | ||||||||||
Amortization of intangibles |
12,588 | 11,724 | 8,607 | ||||||||||
Impairment of Springbox unit |
5,866 | — | — | ||||||||||
Unrealized loss on derivative warrant investment |
— | — | 1,544 | ||||||||||
Deferred income taxes |
12,434 | 12,066 | 8,108 | ||||||||||
Excess tax benefits of share-based compensation |
(1,112 | ) | — | — | |||||||||
Provision for accounts receivable losses |
388 | 549 | 886 | ||||||||||
Share-based compensation |
4,805 | 3,983 | 1,177 | ||||||||||
Loss on disposal of property and equipment |
16 | 51 | 5 | ||||||||||
Other |
(675 | ) | — | — | |||||||||
Changes in operating assets and liabilities, net of acquisitions: |
|||||||||||||
Accounts receivable |
(10,799 | ) | (8,887 | ) | (10,343 | ) | |||||||
Other assets |
3,162 | 2,021 | 4,129 | ||||||||||
Accounts payable and other liabilities |
(532 | ) | (6,126 | ) | 118 | ||||||||
Deferred revenue |
(756 | ) | (278 | ) | (674 | ) | |||||||
Net cash provided by operating activities |
84,358 | 50,381 | 41,380 | ||||||||||
Cash flows from investing activities: |
|||||||||||||
Purchases of property and equipment |
(8,498 | ) | (6,966 | ) | (12,384 | ) | |||||||
Capitalized costs of developing software |
(4,961 | ) | (6,950 | ) | (5,661 | ) | |||||||
Proceeds from sale of property and equipment |
81 | — | 7 | ||||||||||
Acquisitions, net of cash acquired |
(27,501 | ) | — | (136,692 | ) | ||||||||
Net cash used in investing activities |
(40,879 | ) | (13,916 | ) | (154,730 | ) | |||||||
Cash flows from financing activities: |
|||||||||||||
Proceeds from issuance of common stock, net of costs |
115,863 | 53,203 | 206 | ||||||||||
Purchase of treasury stock |
(13,148 | ) | — | — | |||||||||
Payment of tax withholding obligation in exchange for shares tendered |
(1,620 | ) | — | — | |||||||||
Excess tax benefits of share-based compensation |
1,112 | — | — | ||||||||||
Borrowings under long-term debt, net of costs |
— | 57,764 | 177,274 | ||||||||||
Repayment of capital lease obligations |
(3,721 | ) | — | — | |||||||||
Repayments of long-term debt |
(102,462 | ) | (130,675 | ) | (57,056 | ) | |||||||
Net cash provided by (used in) financing activities |
(3,976 | ) | (19,708 | ) | 120,424 | ||||||||
Effect of exchange rate changes on cash and cash equivalents |
36 | (67 | ) | 5 | |||||||||
Net increase in cash and cash equivalents |
39,539 | 16,690 | 7,079 | ||||||||||
Cash and cash equivalents at beginning of year |
33,870 | 17,180 | 10,101 | ||||||||||
Cash and cash equivalents at end of year |
$ | 73,409 | $ | 33,870 | $ | 17,180 | |||||||
Supplemental disclosures of cash flow information: |
|||||||||||||
Cash paid for interest |
$ | 4,958 | $ | 10,098 | $ | 9,295 | |||||||
Cash paid for income taxes |
$ | 13,173 | $ | 1,375 | $ | 837 | |||||||
Non-cash financing and investing activities: |
|||||||||||||
Non-cash component of purchase price to acquire businesses |
$ | 1,602 | $ | — | $ | 68,102 | |||||||
Capital lease obligations incurred to purchase equipment |
$ | 1,162 | $ | 4,451 | $ | — | |||||||
The accompanying notes are an integral part of these financial statements.
F-6
DG FASTCHANNEL, INC. AND SUBSIDIARIES
NOTES TO CONSOLIDATED FINANCIAL STATEMENTS
1. The Company
DG FastChannel, Inc. and subsidiaries (the "Company") is a provider of digital technology services that enable the electronic delivery of advertisements, syndicated programs, and video news releases to traditional broadcasters, online publishers and other media outlets. We operate three nationwide digital networks out of our network operation centers ("NOCs") located in Irving, Texas; Roswell, Georgia and Jersey City, New Jersey, which link more than 5,000 advertisers, advertising agencies and content owners with more than 29,000 television, radio, cable, print and web publishing destinations electronically throughout the United States, Canada, and Europe. We also offer a variety of other ancillary products and services to the advertising industry.
2. Summary of Significant Accounting Policies
Basis of Presentation
The consolidated financial statements have been prepared in accordance with generally accepted accounting principles in the United States ("GAAP") and include the accounts of our subsidiaries. All significant intercompany balances and transactions have been eliminated in consolidation.
Use of Estimates
The preparation of financial statements in conformity with GAAP requires management to make estimates and assumptions that affect the reported amounts of assets and liabilities and disclosure of contingent assets and liabilities at the date of the financial statements and the reported amounts of revenues and expenses during the reporting period. On an ongoing basis, we evaluate our estimates, including those related to the allowance for doubtful accounts and credit memo reserves, intangible assets, office closure exit costs, contingent consideration and income taxes. We base our estimates on historical experience and on other relevant assumptions that are believed to be reasonable under the circumstances, the results of which form the basis for making judgments about the carrying values of assets and liabilities that are not readily apparent from other sources. Actual results could differ from those estimates.
On or about June 1, 2008, we made the decision to upgrade our existing spot boxes with next generation spot boxes, which have greater storage capacity, faster processing speeds, and can accommodate multiple, simultaneous satellite feeds. The replacement was substantially complete as of October 31, 2008. As a result, we shortened the estimated remaining useful life of our then existing spot boxes and recorded additional depreciation expense of $2.3 million from June 1 through October 31, 2008, which reduced net income and diluted earnings per share by $1.4 million and $0.07, respectively.
As discussed below under Property and Equipment, effective October 1, 2008, we changed our assumptions relating to the estimated useful lives of capital assets, but excluding capital assets obtained in the purchase of a business. As a result, we recorded additional depreciation expense of $0.4 million in the fourth quarter of 2008, which reduced net income and diluted earnings per share by $0.2 million and $0.01, respectively.
Effective January 1, 2010, we shortened the estimated remaining useful life of the Pathfire customer relationships intangible asset from about 18 years to 7 years. As a result, we recorded additional amortization expense of $0.3 million during 2010, which reduced net income and diluted earnings per share by $0.2 million and $0.01, respectively.
F-7
DG FASTCHANNEL, INC. AND SUBSIDIARIES
NOTES TO CONSOLIDATED FINANCIAL STATEMENTS (Continued)
2. Summary of Significant Accounting Policies (Continued)
In the second half of 2010, we shortened the estimated remaining useful life of certain internally developed software assets from 13 months to six months. As a result, we recorded additional depreciation expense of $1.3 million during 2010, which reduced net income and diluted earnings per share by $0.7 million and $0.03, respectively.
Cash and Cash Equivalents
Cash and cash equivalents consist of liquid investments with original maturities of three months or less. We maintain substantially all of our cash and cash equivalents with a few major financial institutions in the United States. As of December 31, 2010 and 2009, cash equivalents consisted primarily of U.S. money market funds and overnight investments in U.S. money market funds.
Accounts Receivable and Allowances
Accounts receivable are recorded at the amount invoiced, provided the revenue recognition criteria have been met, less allowances for doubtful accounts and credit memos. We maintain allowances for doubtful accounts and credit memos on an aggregate basis at a level we consider sufficient to cover estimated losses in the collection of our accounts receivable and credit memos expected to be issued. The allowance for doubtful accounts is based primarily upon historical credit loss experience by aging category, with consideration given to current economic conditions and trends, the collectability of specific customer accounts and customer concentrations. We charge off accounts receivable after reasonable collection efforts are made.
Property and Equipment
Property and equipment are stated at cost. Depreciation is computed over the estimated useful lives of the assets using the straight-line method. Leasehold improvements are amortized on a straight-line basis over the shorter of the remaining lease term plus expected renewals or the estimated useful life of the asset. Amortization of capital leases is included in depreciation expense. As a result of our periodic review of our estimates, effective October 1, 2008, we changed our assumptions relating to the estimated useful lives of capital assets, but excluding capital assets obtained in the purchase of a business. The revised estimated useful lives are principally as follows:
Category
|
Useful Life | |
|---|---|---|
| Software | 3 - 4 years | |
| Computer equipment | 4 years | |
| Furniture and fixtures | 5 years | |
| Network equipment | 5 years | |
| Machinery and equipment | 7 years |
Leases
We lease certain properties under operating leases, generally for periods of 3 to 5 years. Certain of our leases contain renewal options and escalating rent provisions. For lease agreements that provide for escalating rent payments or free-rent occupancy periods, we recognize rent expense on a straight-line basis over the non-cancelable lease term plus option renewal periods where failure to exercise an
F-8
DG FASTCHANNEL, INC. AND SUBSIDIARIES
NOTES TO CONSOLIDATED FINANCIAL STATEMENTS (Continued)
2. Summary of Significant Accounting Policies (Continued)
option appears, at the inception of the lease, to be reasonably assured. Deferred rent is included in both accrued liabilities and other non-current liabilities in the consolidated balance sheets.
Software Development Costs
Costs incurred to create software for internal use are expensed during the preliminary project stage and only costs incurred during the application development stage are capitalized. Upon placing the completed project in service, capitalized software development costs are depreciated over the estimated useful life, which is generally three years.
Depreciation of capitalized software development costs for the years ended December 31, 2010, 2009 and 2008 was $7.5 million, $4.1 million and $2.8 million, respectively. The net book value of capitalized software development costs were $10.5 million and $13.0 million as of December 31, 2010 and 2009, respectively.
Derivative Financial Instruments
We sometimes use derivative financial instruments to manage certain business risks. Specifically, we have entered into interest rate swaps to eliminate the variability in interest payment cash flows associated with variable interest rates. The swaps, in effect, convert variable rates of interest into fixed rates of interest. Certain of our swaps were designated and qualified for cash flow hedge accounting. For swaps qualifying for cash flow hedge accounting, at each balance sheet date the fair values of the swaps are recorded on the balance sheet with the offsetting entry recorded in accumulated other comprehensive loss to the extent the hedges are considered highly effective. Any ineffectiveness is recorded in interest expense in the consolidated statements of income. For swaps not designated and qualifying for cash flow hedge accounting, at each balance sheet date the fair values of the swaps are recorded on the balance sheet with the offsetting entry recorded in interest expense. At December 31, 2010, we did not have any interest rate swaps.
Goodwill
Goodwill represents the excess of the purchase price over the fair value of net identifiable assets acquired. We test goodwill for potential impairment on an annual basis, or more frequently if an event occurs or circumstances exist indicating goodwill may not be recoverable. In evaluating goodwill for potential impairment, we perform a two-step process that begins with an estimate of the fair value of each reporting unit that contains goodwill. We use a variety of methods, including discounted cash flow models, to determine fair value. In the event a reporting unit's carrying value exceeds its estimated fair value, evidence of a potential impairment exists. In such a case, the second step of the impairment test is required, which involves allocating the fair value of the reporting unit to its assets and liabilities, with the excess of fair value over allocated net assets representing the implied fair value of its goodwill. An impairment loss is measured as the amount, if any, by which the carrying value of a reporting units' goodwill exceeds its implied fair value.
F-9
DG FASTCHANNEL, INC. AND SUBSIDIARIES
NOTES TO CONSOLIDATED FINANCIAL STATEMENTS (Continued)
2. Summary of Significant Accounting Policies (Continued)
Long-Lived and Identifiable Intangible Assets
We assess our long-lived assets for potential impairment whenever certain triggering events occur. Events that may trigger an impairment review include the following:
- •
- significant underperformance relative to historical or projected future operating results;
- •
- significant changes in the use of our assets or the strategy for our overall business;
- •
- significant negative industry or economic trends;
- •
- significant declines in our stock price for a sustained period; and
- •
- whenever our market capitalization approaches or falls below our net book value.
If we determine the carrying value of long-lived or intangible assets may not be recoverable based upon the existence of one or more of the above indicators of impairment, we assess the recoverability of these assets by determining whether amortization of the asset balance over its remaining life can be recovered through undiscounted future operating cash flows. Any impairment is determined based on a projected discounted cash flow model using a discount rate reflecting our weighted average cost of capital and the risks associated with the projected cash flows. In 2010, we determined that our Springbox unit was impaired. See Note 11.
We determine the useful lives of our identifiable intangible assets after considering the specific facts and circumstances related to each asset. Factors considered when determining useful lives include the contractual term of any agreement, the history of the asset, our long-term strategy for the use of the asset, any laws or other local regulations which could impact the useful life of the asset, and other economic factors, including competition and specific market conditions. Intangible assets that are deemed to have finite lives are generally amortized on a straight-line basis over their useful lives which generally range from five to twelve years. See Note 6.
Deferred Revenue
Deferred revenue represents payments by customers for (i) network access, (ii) maintenance or subscription contracts and (iii) membership fees, in advance of when the service is provided and the related revenue is recognized. Deferred revenue consists of the following (in thousands):
| |
December 31, | |||||||
|---|---|---|---|---|---|---|---|---|
| |
2010 | 2009 | ||||||
Deferred network access and maintenance fees |
$ | 118 | $ | 1,276 | ||||
Deferred subscription and membership fees |
1,279 | 1,191 | ||||||
Progress billings not yet recognized as revenue |
90 | 300 | ||||||
Subtotal |
1,487 | 2,767 | ||||||
Less amounts not yet collected |
(37 | ) | (561 | ) | ||||
Net deferred revenue |
1,450 | 2,206 | ||||||
Less current portion |
(1,450 | ) | (2,178 | ) | ||||
Deferred revenue, net of current portion |
$ | — | $ | 28 | ||||
F-10
DG FASTCHANNEL, INC. AND SUBSIDIARIES
NOTES TO CONSOLIDATED FINANCIAL STATEMENTS (Continued)
2. Summary of Significant Accounting Policies (Continued)
Revenue Recognition
We derive revenue from services which consist primarily of (i) the distribution of digital and analog video and audio media content, (ii) media research resources, and (iii) support and other services. We recognize revenue only when all of the following criteria have been met:
- •
- Persuasive evidence of an arrangement exists,
- •
- Delivery has occurred or services have been rendered,
- •
- Our price to the customer is fixed or determinable, and
- •
- Collectability is reasonably assured.
Below are descriptions of our services and other offerings, and generally the triggering point of revenue recognition, provided all other revenue recognition criteria have been met.
Our services revenue from the digital distribution of video and audio advertising content generally is billed based on a rate per transmission, and we recognize revenue for these services upon notification the advertising content was received at the broadcast destination. Revenue for the distribution of analog video and audio content by tape is recognized when delivery has occurred, which is at the time the tapes are delivered to a common carrier. Shipping and handling costs are included in costs of revenue.
We offer an online advertising campaign management and deployment product. This product allows publishers, advertisers, and their agencies to manage the process of deploying online advertising campaigns. We charge our customers on a cost per thousand ("CPM") impressions basis, and recognize revenue when the impressions are served.
Our services revenue includes access rights. For an agreed upon fee, we provide certain of our customers with access to our digital distribution network for a stated period. Using our network, these customers are able to deliver a variety of programming content to their intended destinations. Access rights revenue is recognized ratably over the access period. We also charge fees to monitor our network on behalf of our customers. The monitoring fees are recognized ratably over the monitoring period.
We sell monthly, quarterly, semi-annual and annual subscriptions to access our online creative research database. We recognize revenue ratably over the subscription period.
Media production and duplication includes a variety of ancillary services such as storage of client masters or other physical material. Revenue for these services is recognized ratably over the storage period. Revenue related to our other services is recognized on a per transaction basis after the service has been performed. If the service results in a tape or other deliverable revenue is recognized when delivery has occurred, which is at the time the tape or other deliverable is delivered to a common carrier.
Customers pay a fixed fee per month for our media asset management and broadcast verification services. Revenue for these services is recognized ratably over the service period.
We have a creative services group that builds content to a format specified by our customers. We charge fees for these services based on the time incurred and materials used to complete the project. Revenue related to retainers is recognized ratably over the retainer term. Certain project revenue is recognized on a completed-contract basis. For projects where we can reasonably estimate the total
F-11
DG FASTCHANNEL, INC. AND SUBSIDIARIES
NOTES TO CONSOLIDATED FINANCIAL STATEMENTS (Continued)
2. Summary of Significant Accounting Policies (Continued)
project costs and the portion of the entire project complete at any point, we use the proportional performance method for recognizing revenue. Under the proportional performance method, revenue is recognized based on the level of effort incurred to date compared to the total estimated level of effort required for the entire project.
Income Taxes
We establish deferred income tax assets and liabilities for temporary differences between the tax and financial accounting bases of our assets and liabilities. The tax effects of such differences are recorded in the balance sheet at the enacted tax rates expected to be in effect when the differences reverse. A valuation allowance is recorded to reduce the carrying amount of deferred tax assets if it is more likely than not that all or a portion of the asset will not be realized. The ultimate realization of our deferred tax assets is primarily dependent upon generating taxable income during the periods in which those temporary differences become deductible. The tax balances and income tax expense recognized by us are based on our interpretation of the tax statutes of multiple jurisdictions and judgment. Differences between the anticipated and actual outcomes of these future tax consequences could have a material impact on our consolidated results of operations or financial position.
We include interest related to tax issues as part of income tax expense in our consolidated financial statements. We record any applicable penalties related to tax issues within the income tax provision.
Share-Based Payments
From time to time the compensation committee of our board of directors authorizes the issuance of restricted stock and stock options to our employees and directors. The committee approves grants only out of shares previously authorized by our stockholders.
We recognize compensation expense based on the estimated fair value of the share-based payments. The fair value of restricted stock is based on the closing price of our common stock the day prior to the date of grant. The fair values of stock options are calculated using the Black-Scholes option pricing model. Share-based awards that do not require future service are expensed immediately. Share-based awards that require future service are amortized over the relevant service period. We recognized $4.8 million, $4.0 million and $1.2 million in share-based compensation expense related to employee stock options and grants of restricted stock in the years ended December 31, 2010, 2009 and 2008, respectively.
Business Combinations
Business combinations are accounted for using the purchase method. The purchase price is allocated to the assets acquired and liabilities assumed based on their estimated fair values. Any excess purchase price over the fair value of the net assets acquired is recorded as goodwill. For all acquisitions, operating results are included in our results of operations from the date of acquisition. See Note 3 for additional information.
F-12
DG FASTCHANNEL, INC. AND SUBSIDIARIES
NOTES TO CONSOLIDATED FINANCIAL STATEMENTS (Continued)
2. Summary of Significant Accounting Policies (Continued)
Financial Instruments and Concentration of Credit Risk
Financial instruments that could subject us to a concentration of credit risk consist primarily of cash and cash equivalents and accounts receivable. Generally, our cash is held at large financial institutions and our cash equivalents consist of highly liquid money market funds. We perform ongoing credit evaluations of our customers, generally do not require collateral and maintain a reserve for potential credit losses. We believe that a concentration of credit risk related to our video and audio content distribution accounts receivable is limited because our customers are geographically dispersed and the end users are diversified across several industries. Our receivables are principally from advertising agencies, direct advertisers, and syndicated programmers. Our receivables and related revenues are not contingent on our customers' sales or collections.
We believe the carrying values of our accounts receivable and accounts payable approximate fair value due to their short maturities. The carrying value of our debt under the senior credit facility was estimated to approximate fair value based on (i) the recentness of entering into, or amending, the facility, (ii) the interest rates charged under the facility varying with market interest rates and (iii) the interest rate spreads charged fluctuating with our creditworthiness as determined by our total leverage ratio. The carrying values of our interest rate swaps were recorded at fair value based on quoted LIBOR interest rates. As of December 31, 2010, we did not have any outstanding debt or interest rate swaps. See Notes 8 and 9.
Recently Adopted and Recently Issued Accounting Guidance
Adopted
We adopted changes issued by the Financial Accounting Standards Board ("FASB") relating to the authoritative hierarchy of GAAP. These changes establish the FASB Accounting Standards Codification ("ASC") as the source of authoritative accounting principles recognized by the FASB to be applied by nongovernmental entities in the preparation of financial statements in conformity with GAAP. Rules and interpretive releases of the Securities and Exchange Commission ("SEC") under the authority of federal securities laws are also sources of authoritative GAAP for SEC registrants. The FASB will no longer issue new standards in the form of Statements of Financial Accounting Standards, FASB Staff Positions, or Emerging Issues Task Force Abstracts; instead the FASB will issue Accounting Standards Updates ("ASU"). ASU will not be authoritative in their own right as they will only serve to update the ASC. These changes and the ASC itself do not change GAAP. Other than the manner in which the new accounting guidance is referenced, the adoption of these changes had no impact on our financial statements.
Issued
In December 2010, the FASB issued ASU 2010-29 which will change the disclosures of supplementary pro forma information for business combinations. The new standard clarifies that if a public entity completes a business combination and presents comparative financial statements, the entity should disclose revenue and earnings of the combined entity as though the business combination(s) that occurred during the current year had occurred as of the beginning of the comparable prior annual reporting period only. The amendments also expand the supplemental pro forma disclosures under ASC topic 805 to include a description of the nature and amount of material, nonrecurring pro forma adjustments directly attributable to the business combination included in the
F-13
DG FASTCHANNEL, INC. AND SUBSIDIARIES
NOTES TO CONSOLIDATED FINANCIAL STATEMENTS (Continued)
2. Summary of Significant Accounting Policies (Continued)
reported pro forma revenue and earnings. ASU 2010-29 is effective for any business combination we complete on or after January 1, 2011. The revised disclosure requirements will not affect our financial position, results of operations or cash flows.
In October 2009, the FASB issued changes to revenue arrangements with multiple deliverables in ASU 2009-13. The new standard is included in the ASC under subtopic 605-25 and modifies the revenue recognition guidance for arrangements that involve the delivery of multiple elements, such as product, software, services or support, to a customer at different times as part of a single revenue generating transaction. The new standard provides principles and application guidance to determine whether multiple deliverables exist, how the individual deliverables should be separated and how to allocate the revenue in the arrangement among those separate deliverables. The standard also expands the disclosure requirements for multiple deliverable revenue arrangements. The new standard will be effective for us beginning January 1, 2011. We do not expect the adoption of ASU 2009-13 will have a material impact on our financial position, results of operations or cash flows.
3. Acquisitions
Over the last three years, we acquired or merged with three businesses in the media services industries. The objective of each transaction was to expand our digital distribution network, customer base and/or product offerings. For each transaction, we were able to eliminate significant operating costs from the acquired business, or the acquisition created opportunities for the acquired entity to sell its services into our existing customer base. Both of these factors resulted in a purchase price that contributed to the recognition of goodwill. The acquisitions are summarized as follows:
Business Acquired
|
Date of Closing |
Net Assets Acquired (in millions) |
Primary Form of Consideration |
||||
|---|---|---|---|---|---|---|---|
Match Point |
October 1, 2010 | $ | 27.7 | Cash | |||
Enliven |
October 2, 2008 | 74.6 | Stock | ||||
Vyvx |
June 5, 2008 | 135.4 | Cash | ||||
Each of the transactions has been included in our results of operations since the date of closing. In each acquisition the excess of the purchase price over the fair value of net identifiable assets acquired has been allocated to goodwill. A brief description of each transaction is as follows:
Match Point
On October 1, 2010, we acquired the assets and operations of privately-held Match Point Media LLC and its divisions, Treehouse Media Services, Inc. and Voltage Video, Inc. (collectively referred to as "Match Point"), a market leader in the customization and distribution of direct response advertising, for $27.7 million in cash, which includes $1.0 million paid into escrow related to a potential earnout obligation. Depending on Match Point's future revenues, we may be required to pay from zero to as much as $3.0 million under the earnout obligation. The earnout has been recorded at its estimated fair value ($2.6 million), less the amount paid into escrow. Match Point provides media advertising services to advertising agencies and advertisers participating in the direct response advertising industry and is part of our video and audio content distribution segment. The purchase price has been preliminarily allocated based on the estimated fair values of the tangible and intangible assets acquired and liabilities assumed at the date of acquisition. Presently, we allocated $8.7 million to
F-14
DG FASTCHANNEL, INC. AND SUBSIDIARIES
NOTES TO CONSOLIDATED FINANCIAL STATEMENTS (Continued)
3. Acquisitions (Continued)
customer relationships and $3.8 million to noncompetition agreements. The intangible assets are being amortized over a weighted average term of 10 years and 5 years, respectively. The goodwill and intangible assets created in the acquisition are deductible for tax purposes. The goodwill created in the acquisition has been allocated to the video and audio content distribution segment. We recognized $4.9 million and $0.7 million of revenue and income before income taxes, respectively, from Match Point in our 2010 consolidated results of operations. The acquired assets included $3.0 million of gross receivables which we recognized at their estimated fair value of $2.4 million. The Match Point purchase price allocation is preliminary pending further review and analysis of intangible asset valuations.
Enliven
On October 2, 2008, we acquired all of the issued and outstanding shares of Enliven Marketing Technologies Corporation's ("Enliven") common stock we did not previously own (see Note 4) in exchange for 2.9 million shares of our common stock. In the aggregate, including shares of Enliven previously held and shares issued, the total purchase price was $74.6 million. Enliven has two principal operating units, Unicast Communications Corp. ("Unicast") and Springbox Ltd. ("Springbox"). Unicast offers an online advertising campaign management product and Springbox is an Internet based marketing firm. The purchase price has been allocated based on the estimated fair values of the tangible and intangible assets acquired and liabilities assumed at the date of acquisition. We allocated $14.5 million to customer relationships, $1.5 million to trade names, and $1.4 million to developed technology. The intangible assets are being amortized over a weighted average term of 15 years, 10 years and 5 years, respectively. The goodwill and intangible assets created in the acquisition are not deductible for tax purposes. The goodwill created in the acquisition has been allocated to the video and audio content distribution segment. See Note 11.
Vyvx
On June 5, 2008, we completed the acquisition of substantially all the assets and certain liabilities of the Vyvx advertising services business ("Vyvx"), including its distribution, post-production and related operations, from Level 3 Communications, Inc. ("Level 3"). Vyvx operated an advertising services and distribution business similar to our video and audio content distribution business. The acquisition was completed pursuant to an asset purchase agreement among us, Level 3 and certain affiliates of Level 3 for a purchase price of approximately $135.4 million in cash. The purchase price has been allocated based on the estimated fair values of the tangible and intangible assets acquired and liabilities assumed at the date of acquisition. We allocated $53.9 million to customer relationships, which is being amortized over 12.5 years. The goodwill and intangible assets created in the acquisition are deductible for tax purposes. The goodwill created in the acquisition has been allocated to the video and audio content distribution segment.
F-15
DG FASTCHANNEL, INC. AND SUBSIDIARIES
NOTES TO CONSOLIDATED FINANCIAL STATEMENTS (Continued)
3. Acquisitions (Continued)
Purchase Price Allocations
The following table summarizes the estimated fair values of the assets acquired and the liabilities assumed at the respective dates of acquisition for the above referenced transactions. The purchase price allocations are as follows (in millions):
Category
|
Match Point | Enliven | Vyvx | ||||||||
|---|---|---|---|---|---|---|---|---|---|---|---|
Current assets |
$ | 2.8 | $ | 6.5 | $ | 2.9 | |||||
Property and equipment |
0.8 | 2.8 | 2.5 | ||||||||
Other non-current assets |
— | 33.1 | 0.3 | ||||||||
Customer relationships |
8.7 | 14.5 | 53.9 | ||||||||
Trade names |
1.7 | 1.5 | — | ||||||||
Noncompetition agreement |
3.8 | — | — | ||||||||
Other intangibles |
— | 1.4 | 0.1 | ||||||||
Goodwill |
11.5 | 32.9 | 79.3 | ||||||||
Total assets acquired |
29.3 | 92.7 | 139.0 | ||||||||
Less liabilities assumed |
(1.6 | ) | (18.1 | ) | (3.6 | ) | |||||
Net assets acquired |
$ | 27.7 | $ | 74.6 | $ | 135.4 | |||||
Exit Costs Related to Acquisitions
In connection with our acquisitions and related purchase price allocations, we recorded exit costs related to discontinuing certain activities and personnel of the acquired operations. Below is a rollforward of exit costs from December 31, 2007 to December 31, 2010 (in millions):
| |
Balance at December 31, 2007 |
New Charges |
Plus Interest Accretion and/or Less Cash Payments |
Balance at December 31, 2008 |
New Charges |
Plus Interest Accretion and/or Less Cash Payments |
Balance at December 31, 2009 |
New Charges |
Plus Interest Accretion and/or Less Cash Payments |
Balance at December 31, 2010 |
||||||||||||||||||||||
|---|---|---|---|---|---|---|---|---|---|---|---|---|---|---|---|---|---|---|---|---|---|---|---|---|---|---|---|---|---|---|---|---|
Point.360: |
||||||||||||||||||||||||||||||||
Office closures |
$ | 0.7 | $ | 0.1 | $ | (0.8 | ) | $ | — | $ | — | $ | — | $ | — | $ | — | $ | — | $ | — | |||||||||||
Vyvx: |
||||||||||||||||||||||||||||||||
Office closures |
— | 3.3 | (0.1 | ) | 3.2 | — | (0.6 | ) | 2.6 | — | (1.0 | ) | 1.6 | |||||||||||||||||||
Employee severance |
— | 0.1 | — | 0.1 | — | (0.1 | ) | — | — | — | — | |||||||||||||||||||||
Enliven: |
||||||||||||||||||||||||||||||||
Employee severance |
— | 1.4 | (1.3 | ) | 0.1 | 0.3 | (0.3 | ) | 0.1 | — | (0.1 | ) | — | |||||||||||||||||||
Unfavorable contract |
— | 0.5 | — | 0.5 | — | — | 0.5 | — | — | 0.5 | ||||||||||||||||||||||
Total |
$ | 0.7 | $ | 5.4 | $ | (2.2 | ) | $ | 3.9 | $ | 0.3 | $ | (1.0 | ) | $ | 3.2 | $ | — | $ | (1.1 | ) | $ | 2.1 | |||||||||
We are attempting to negotiate lease buyouts or enter into sublease arrangements with respect to certain office leases. The 2008 adjustment to the Point.360 office closure accrual of $0.1 million was recorded as an adjustment to the cost of acquiring Point.360. The 2009 adjustment to the Enliven employee severance accrual of $0.3 million was recorded in general and administrative expense in the statement of income.
F-16
DG FASTCHANNEL, INC. AND SUBSIDIARIES
NOTES TO CONSOLIDATED FINANCIAL STATEMENTS (Continued)
3. Acquisitions (Continued)
Pro Forma Information
The following pro forma information presents our results of operations as if the Match Point acquisition had occurred at the beginning of each of the following periods (in thousands, except per share amounts). A table of actual amounts is provided for reference.
| |
As Reported | Unaudited Pro Forma |
||||||||||||
|---|---|---|---|---|---|---|---|---|---|---|---|---|---|---|
| |
Years Ended December 31, |
Years Ended December 31, |
||||||||||||
| |
2010 | 2009 | 2010 | 2009 | ||||||||||
Revenue |
$ | 247,528 | $ | 190,886 | $ | 261,762 | $ | 210,284 | ||||||
Net income |
41,569 | 20,501 | 42,360 | 20,917 | ||||||||||
Earnings per common share: |
||||||||||||||
Basic |
$ | 1.52 | $ | 0.90 | $ | 1.54 | $ | 0.91 | ||||||
Diluted |
$ | 1.50 | $ | 0.88 | $ | 1.52 | $ | 0.89 | ||||||
4. Investments
Enliven
In May 2007, we purchased (i) 10.8 million shares of Enliven common stock (or about 13% of Enliven's then outstanding shares) and (ii) warrants to purchase an additional 2.7 million shares at $0.45 per share, for an aggregate purchase price of $4.5 million including transaction costs. Prior to the purchase of Enliven in October 2008 (see Note 3), we accounted for our Enliven stock as available for sale securities and recorded the change in market value of the Enliven common stock on the balance sheet in long-term investments and in accumulated other comprehensive income. We determined the warrant component of the investment met the definition of a derivative instrument which requires changes in value attributable to the warrant to be recorded in the statement of income. The warrant value was calculated using the Black-Scholes option pricing model.
In October 2008, we acquired all the issued and outstanding shares of Enliven common stock. As a result, Enliven became our wholly-owned subsidiary. Our previously recorded investment in the Enliven common stock and warrants was included as part of the purchase price. The common stock was included in the purchase price at its historical cost, whereas the warrants were included at their estimated fair value on the acquisition date.
F-17
DG FASTCHANNEL, INC. AND SUBSIDIARIES
NOTES TO CONSOLIDATED FINANCIAL STATEMENTS (Continued)
5. Property and Equipment
Property and equipment were as follows (in thousands):
| |
December 31, | ||||||
|---|---|---|---|---|---|---|---|
| |
2010 | 2009 | |||||
Network equipment |
$ | 37,986 | $ | 34,098 | |||
Internally developed software costs |
29,186 | 24,225 | |||||
Machinery and equipment |
14,951 | 13,016 | |||||
Purchased software |
6,694 | 5,688 | |||||
Computer equipment |
4,922 | 4,745 | |||||
Leasehold improvements |
3,398 | 3,315 | |||||
Furniture and fixtures |
1,615 | 1,453 | |||||
|
98,752 | 86,540 | |||||
Less accumulated depreciation and amortization |
(59,291 | ) | (45,020 | ) | |||
|
$ | 39,461 | $ | 41,520 | |||
6. Intangible Assets
Changes in the carrying value of goodwill by reporting unit for the years ended December 31, 2010 and 2009 are as follows (in thousands):
| |
Video and Audio Content Distribution |
SourceEcreative | Total | ||||||||
|---|---|---|---|---|---|---|---|---|---|---|---|
Balance at December 31, 2008 |
$ | 244,736 | $ | 1,998 | $ | 246,734 | |||||
Finalize Vyvx acquisition |
854 | — | 854 | ||||||||
Finalize Enliven acquisition |
(32,811 | ) | — | (32,811 | ) | ||||||
Balance at December 31, 2009 |
212,779 | 1,998 | 214,777 | ||||||||
Goodwill acquired in Match Point acquisition |
11,480 | — | 11,480 | ||||||||
Balance at December 31, 2010 |
$ | 224,259 | $ | 1,998 | $ | 226,257 | |||||
During 2009, we completed an Internal Revenue Code Section 382 study related to the Enliven acquisition. As a result, we recognized $32.8 million of deferred tax assets, primarily net operating loss carryforwards ("NOLs"). See further discussion at Note 10.
F-18
DG FASTCHANNEL, INC. AND SUBSIDIARIES
NOTES TO CONSOLIDATED FINANCIAL STATEMENTS (Continued)
6. Intangible Assets (Continued)
Intangible assets were as follows (dollars in thousands):
| |
Weighted Average Amortization Period (in years) |
Gross Assets |
Accumulated Amortization |
Net Assets |
|||||||||||
|---|---|---|---|---|---|---|---|---|---|---|---|---|---|---|---|
December 31, 2010 |
|||||||||||||||
Customer relationships |
10.6 | $ | 121,843 | $ | (39,395 | ) | $ | 82,448 | |||||||
Trade name |
14.3 | 18,894 | (7,795 | ) | 11,099 | ||||||||||
Developed technology |
5.2 | 1,610 | (756 | ) | 854 | ||||||||||
Noncompetition agreements |
5.0 | 4,130 | (435 | ) | 3,695 | ||||||||||
Total intangible assets |
10.9 | $ | 146,477 | $ | (48,381 | ) | $ | 98,096 | |||||||
December 31, 2009 |
|||||||||||||||
Customer relationships |
12.3 | $ | 113,183 | $ | (22,852 | ) | $ | 90,331 | |||||||
Trade name |
15.1 | 17,194 | (6,454 | ) | 10,740 | ||||||||||
Developed technology |
5.2 | 1,610 | (438 | ) | 1,172 | ||||||||||
Noncompetition agreements |
4.7 | 350 | (182 | ) | 168 | ||||||||||
Total intangible assets |
12.6 | $ | 132,337 | $ | (29,926 | ) | $ | 102,411 | |||||||
Intangible assets are stated at their estimated fair value at the date of acquisition, net of any impairment losses recognized and accumulated amortization. Intangible assets are amortized using the straight-line method. Net intangibles assets decreased during 2010 as a result of normal amortization and a $5.9 million decrease in customer relationships as a result of an impairment of our Springbox unit (see Note 11), partially offset by our purchase of Match Point (see Note 3). Amortization expense related to intangible assets totaled $12.6 million, $11.7 million and $8.6 million during the years ended December 31, 2010, 2009 and 2008, respectively. The estimated future amortization of our intangible assets as of December 31, 2010 is as follows (in thousands):
2011 |
$ | 14,368 | ||
2012 |
13,751 | |||
2013 |
12,662 | |||
2014 |
12,167 | |||
2015 |
11,715 | |||
Thereafter |
33,433 | |||
|
$ | 98,096 | ||
F-19
DG FASTCHANNEL, INC. AND SUBSIDIARIES
NOTES TO CONSOLIDATED FINANCIAL STATEMENTS (Continued)
7. Other Liabilities
Accrued liabilities consist of the following (in thousands):
| |
December 31, | ||||||
|---|---|---|---|---|---|---|---|
| |
2010 | 2009 | |||||
Employee compensation |
$ | 5,542 | $ | 3,875 | |||
Vendor financed equipment purchase |
— | 3,404 | |||||
Taxes payable |
2,675 | 1,869 | |||||
Acquisition exit costs (office closures) |
484 | 1,081 | |||||
Interest payable |
— | 993 | |||||
Other |
2,438 | 2,241 | |||||
|
$ | 11,139 | $ | 13,463 | |||
Other non-current liabilities consist of the following (in thousands):
| |
December 31, | ||||||
|---|---|---|---|---|---|---|---|
| |
2010 | 2009 | |||||
Interest rate swaps |
$ | — | $ | 2,430 | |||
Match Point earnout (Note 9) |
1,602 | — | |||||
Acquisition exit costs (office closures) |
1,164 | 1,559 | |||||
Other |
1,191 | 591 | |||||
|
$ | 3,957 | $ | 4,580 | |||
8. Debt
Our debt is summarized as follows (in thousands):
| |
December 31, | |||||||
|---|---|---|---|---|---|---|---|---|
| |
2010 | 2009 | ||||||
Term loans |
$ | — | $ | 62,170 | ||||
Acquisition loans |
— | 40,292 | ||||||
Revolving credit facility |
— | — | ||||||
Subtotal |
— | 102,462 | ||||||
Less current portion |
— | (21,500 | ) | |||||
Long-term portion |
$ | — | $ | 80,962 | ||||
Senior Credit Facility
In March 2008, we entered into a six-year, $145 million credit facility (the "Senior Credit Facility"). In March 2009, the Senior Credit Facility was amended to permit $40 million of additional term loan borrowings. The Senior Credit Facility, as amended, contained term loans, acquisition loans and a $30 million revolving credit facility. Borrowings under the Senior Credit Facility bore interest at the base rate or LIBOR, plus the applicable margin for each that fluctuated with the total leverage ratio. At December 31, 2009, borrowings under the Senior Credit Facility bore interest at a weighted
F-20
DG FASTCHANNEL, INC. AND SUBSIDIARIES
NOTES TO CONSOLIDATED FINANCIAL STATEMENTS (Continued)
8. Debt (Continued)
average annual interest rate of 5.8%, excluding the amortization of fees and expenses. In August 2010, we terminated the Senior Credit Facility.
Debt Repayment and Termination of Facility and Interest Rate Swaps
In April 2010, we issued 3.7 million shares of our common stock in a public equity offering that raised $108 million in net proceeds and used $97 million of the proceeds to retire all of our outstanding debt. We used another $2.7 million of the proceeds to terminate our interest rate swaps, including accrued interest. As noted above, in August 2010, we terminated the Senior Credit Facility. In connection with our debt repayment and termination of the facility, we wrote off $2.9 million of deferred loan fees to interest expense and reclassified $2.1 million of accumulated interest rate swap losses from accumulated other comprehensive loss (a balance sheet account) to interest expense.
Interest Rate Swaps
During 2009 and 2008, we entered into three interest rate swap agreements ("Swaps") with an aggregate notional amount of $87.5 million with certain of our lenders which were designated and initially qualified as cash flow hedging instruments. During the fourth quarter of 2009, one of our Swaps with a $30 million notional amount failed to satisfy all of the hedging criteria to qualify as a cash flow hedging instrument. The accumulated loss associated with this Swap ($0.2 million) was reclassified from accumulated other comprehensive loss ("AOCL") and recognized as interest expense. In April 2010 we terminated all our Swaps in connection with the repayment of all our outstanding debt. The accumulated loss associated with the other two swaps ($2.1 million) was reclassified from AOCL and recognized as interest expense.
Borrowings under the Senior Credit Facility bore interest at variable rates. Our objective of entering into the Swaps was to reduce the risk associated with these variable rates. The Swaps, in effect, converted variable rates of interest into fixed rates of interest on the $87.5 million of borrowings we previously had outstanding under the Senior Credit Facility. At each balance sheet date, the fair values of the Swaps were recorded on the balance sheet with the offsetting entry recorded in AOCL to the extent the hedges were highly effective. Any ineffectiveness was recorded in the statement of income. It is our policy to offset fair value amounts recognized for derivative instruments executed with the same counterparty under a master netting agreement. At December 31, 2009, no such amounts were offset.
F-21
DG FASTCHANNEL, INC. AND SUBSIDIARIES
NOTES TO CONSOLIDATED FINANCIAL STATEMENTS (Continued)
8. Debt (Continued)
Our Swaps were as follows (dollars in thousands):
| |
December 31, 2010 |
December 31, 2009 |
|||||||
|---|---|---|---|---|---|---|---|---|---|
Notional amounts |
$ | — | $ | 87,500 | |||||
Weighted average pay rates |
— | 6.12 | % | ||||||
Weighted average receive rates |
— | 3.42 | % | ||||||
Weighted average maturity (in years) |
— | 1.55 | |||||||
Fair value of interest rate swaps recorded in other non-current liabilities: |
|||||||||
Designated and qualifying as hedging instruments |
$ | — | $ | 2,265 | |||||
Not designated and qualifying as hedging instruments |
— | 165 | |||||||
Total |
$ | — | $ | 2,430 | |||||
Below is a summary of the amounts of gains and losses related to derivative instruments qualifying as hedging relationships during 2010 and 2009 (in thousands):
| Years Ended December 31, | |||||||||||||||||||||||
|---|---|---|---|---|---|---|---|---|---|---|---|---|---|---|---|---|---|---|---|---|---|---|---|
| |
Amount of Gain Recognized in AOCL on Derivative (Effective Portion) |
|
Amount of Loss Reclassified from AOCL into Income (Effective Portion) |
|
Amount of Gain (Loss) Recognized in Income (Ineffective Portion) |
||||||||||||||||||
| |
Location of Loss Reclassified from AOCL into Income (Effective Portion) |
|
|||||||||||||||||||||
| |
Location of Gain (Loss) Recognized in Income (Ineffective Portion) |
||||||||||||||||||||||
Derivatives in Cash Flow Hedging Relationships |
|||||||||||||||||||||||
| 2010 | 2009 | 2010 | 2009 | 2010 | 2009 | ||||||||||||||||||
Interest rate swaps |
$ | 162 | $ | 683 | Interest expense | $ | (567 | ) | $ | (1,869 | ) | Interest expense | $ | — | $ | — | |||||||
Previous Credit Facility
In June 2008, we entered into a two-year $65 million subordinated unsecured term loan (the "Bridge Loan"). The Bridge Loan initially bore interest at 11.0% per annum, and increased 50 basis points per month beginning in the third month to a maximum annual rate of 15.0%. The Bridge Loan was estimated to have a periodic interest cost of 13.3% per annum based upon the expected term of one-year, excluding the amortization of fees and expenses. In March 2009, we used (i) $40 million of additional term loan borrowings, (ii) $20 million of revolving credit facility borrowings and (iii) $5 million of cash on hand, to retire the Bridge Loan.
9. Fair Value Measurements
ASC 820, Fair Value Measurements and Disclosures, defines fair value as the exchange price that would be received for an asset or paid to transfer a liability (an exit price) in the principal or most advantageous market for the asset or liability in an orderly transaction between market participants at the measurement date.
F-22
DG FASTCHANNEL, INC. AND SUBSIDIARIES
NOTES TO CONSOLIDATED FINANCIAL STATEMENTS (Continued)
9. Fair Value Measurements (Continued)
ASC 820 establishes a three-level fair value hierarchy that prioritizes the inputs used to measure fair value. This hierarchy requires entities to maximize the use of observable inputs and minimize the use of unobservable inputs. The three levels of inputs used to measure fair value are as follows:
- •
- Level 1—Quoted prices in active markets for identical assets or liabilities.
- •
- Level 2—Observable inputs other than quoted prices included in Level 1, such as quoted prices
for similar assets and liabilities in active markets; quoted prices for identical or similar assets and liabilities in markets that are not active; or other inputs that are observable or can be
corroborated by observable market data.
- •
- Level 3—Unobservable inputs that are supported by little or no market activity and that are significant to the fair value of the assets or liabilities. This includes certain pricing models, discounted cash flow methodologies and similar techniques that use significant unobservable inputs.
We have classified our assets and liabilities that are measured at fair value on a recurring basis (at least annually) into the most appropriate level within the fair value hierarchy based on the inputs used to determine the fair value at the measurement date.
The tables below set forth by level, assets and liabilities that were accounted for at fair value as of December 31, 2010 and 2009. The tables do not include cash on hand or assets and liabilities that are measured at historical cost or any basis other than fair value (in thousands):
| |
Fair Value Measurements at December 31, 2010 | ||||||||||||||
|---|---|---|---|---|---|---|---|---|---|---|---|---|---|---|---|
| |
Quoted Prices in Active Markets (Level 1) |
Significant Other Observable Inputs (Level 2) |
Significant Unobservable Inputs (Level 3) |
Total Fair Value Measurements |
|||||||||||
Assets: |
|||||||||||||||
Cash equivalents |
$ | 36,537 | $ | — | $ | — | $ | 36,537 | |||||||
Equity securities—restricted stock |
— | 300 | — | 300 | |||||||||||
Put/call option on equity securities |
— | 200 | — | 200 | |||||||||||
Total |
$ | 36,537 | $ | 500 | $ | — | $ | 37,037 | |||||||
Liabilities: |
|||||||||||||||
Match Point earnout |
$ | — | $ | — | $ | 1,602 | $ | 1,602 | |||||||
| |
Fair Value Measurements at December 31, 2009 | |||||||||||||
|---|---|---|---|---|---|---|---|---|---|---|---|---|---|---|
| |
Quoted Prices in Active Markets (Level 1) |
Significant Other Observable Inputs (Level 2) |
Significant Unobservable Inputs (Level 3) |
Total Fair Value Measurements |
||||||||||
Assets: |
||||||||||||||
Cash equivalents |
$ | 29,750 | $ | — | $ | — | $ | 29,750 | ||||||
Liabilities: |
||||||||||||||
Interest rate swaps |
$ | — | $ | 2,430 | $ | — | $ | 2,430 | ||||||
F-23
DG FASTCHANNEL, INC. AND SUBSIDIARIES
NOTES TO CONSOLIDATED FINANCIAL STATEMENTS (Continued)
9. Fair Value Measurements (Continued)
Our cash equivalents consist of highly liquid money market funds. Fair values of our cash equivalents and equity securities—restricted stock were determined based upon market prices. The value of the put option, net of a call option, is based upon the Black-Scholes pricing model using observable inputs.
The fair values of our interest rate swaps at December 31, 2009 were determined based on quoted prices from our counterparties and corroborated with third party data. The interest rate swap liabilities (see Note 8) are included in other non-current liabilities on the accompanying consolidated balance sheet. The fair value of our long-term debt (see Note 8) at December 31, 2009 was estimated to approximate its carrying value based on (i) the recentness of entering into, or amending, that credit facility, (ii) the variable rate nature of that credit facility and (iii) the interest rate spreads charged on those loans fluctuating with the total leverage ratio, which is a measurement of our creditworthiness.
The earnout was determined based upon our estimate of future Match Point revenues and the corresponding earnout levels achieved, discounted to their present value. The earnout liability is recorded net of a $1.0 million escrow deposit made. The following table provides a reconciliation of changes in the fair values of our level 3 liabilities (in thousands):
| |
Match Point Earnout | |||
|---|---|---|---|---|
Beginning balance, December 31, 2009 |
$ | — | ||
Additions |
1,602 | |||
Change in fair value during the period |
— | |||
Payments |
— | |||
Ending balance, December 31, 2010 |
$ | 1,602 | ||
10. Income Taxes
The components of income before income taxes are as follows (in thousands):
| |
2010 | 2009 | 2008 | ||||||||
|---|---|---|---|---|---|---|---|---|---|---|---|
United States |
$ | 66,908 | $ | 36,170 | $ | 23,699 | |||||
Foreign |
1,579 | (727 | ) | 952 | |||||||
Total |
$ | 68,487 | $ | 35,443 | $ | 24,651 | |||||
F-24
DG FASTCHANNEL, INC. AND SUBSIDIARIES
NOTES TO CONSOLIDATED FINANCIAL STATEMENTS (Continued)
10. Income Taxes (Continued)
Components of deferred tax assets were as follows (in thousands):
| |
December 31, | ||||||||
|---|---|---|---|---|---|---|---|---|---|
| |
2010 | 2009 | |||||||
Deferred tax assets: |
|||||||||
Accounts receivable allowances |
$ | 965 | $ | 789 | |||||
Unearned revenue |
559 | 876 | |||||||
Accrued liabilities not yet deductible |
981 | 1,819 | |||||||
Federal and State net operating loss ("NOL") carryforwards |
42,002 | 52,443 | |||||||
Tax credit carryforwards |
167 | 1,849 | |||||||
Impairment of Verance investment |
— | 1,890 | |||||||
Stock-based compensation |
1,001 | 581 | |||||||
Unrealized loss on interest rate swap |
— | 894 | |||||||
Other |
145 | 339 | |||||||
Total deferred tax assets |
45,820 | 61,480 | |||||||
Less valuation allowance |
(667 | ) | (1,543 | ) | |||||
Deferred tax assets after valuation allowance |
45,153 | 59,937 | |||||||
Deferred tax liabilities: |
|||||||||
Purchased intangibles |
(21,916 | ) | (24,670 | ) | |||||
Property and equipment |
(8,508 | ) | (7,201 | ) | |||||
Total deferred tax liabilities |
(30,424 | ) | (31,871 | ) | |||||
Net deferred tax assets |
14,729 | 28,066 | |||||||
Less net current deferred tax assets |
(1,955 | ) | (2,778 | ) | |||||
Net non-current deferred tax assets |
$ | 12,774 | $ | 25,288 | |||||
The change in the net deferred tax assets between December 31, 2008 and 2010 did not entirely impact deferred income tax expense as shown below (in thousands):
| |
(Charged) or Credited Through | |
|||||||||
|---|---|---|---|---|---|---|---|---|---|---|---|
| |
Continuing Operations |
Accumulated Other Comprehensive Loss |
Total | ||||||||
Net deferred tax assets at December 31, 2008 |
$ | 6,598 | $ | 1,179 | $ | 7,777 | |||||
Recognition of Enliven NOL carrryforwards which reduced goodwill |
32,631 | — | 32,631 | ||||||||
Deferred income tax expense |
(12,066 | ) | (276 | ) | (12,342 | ) | |||||
Other |
9 | (9 | ) | — | |||||||
Net deferred tax assets at December 31, 2009 |
27,172 | 894 | 28,066 | ||||||||
Deferred income tax expense |
(12,434 | ) | (903 | ) | (13,337 | ) | |||||
Other |
(9 | ) | 9 | — | |||||||
Net deferred tax assets at December 31, 2010 |
$ | 14,729 | $ | — | $ | 14,729 | |||||
F-25
DG FASTCHANNEL, INC. AND SUBSIDIARIES
NOTES TO CONSOLIDATED FINANCIAL STATEMENTS (Continued)
10. Income Taxes (Continued)
Components of the provision for income taxes are as follows (in thousands):
| |
2010 | 2009 | 2008 | |||||||||
|---|---|---|---|---|---|---|---|---|---|---|---|---|
Current: |
||||||||||||
U.S. federal |
$ | 11,852 | $ | 869 | $ | 343 | ||||||
State |
2,593 | 1,994 | 1,051 | |||||||||
Foreign |
39 | 13 | 70 | |||||||||
|
14,484 | 2,876 | 1,464 | |||||||||
Deferred: |
||||||||||||
U.S. federal |
13,201 | 11,413 | 7,518 | |||||||||
State |
(767 | ) | 653 | 590 | ||||||||
|
12,434 | 12,066 | 8,108 | |||||||||
Provision for income taxes |
$ | 26,918 | $ | 14,942 | $ | 9,572 | ||||||
Income tax expense differs from the amounts that would result from applying the federal statutory rate to our income before income taxes as follows (dollars in thousands):
| |
2010 | 2009 | 2008 | ||||||||
|---|---|---|---|---|---|---|---|---|---|---|---|
Federal statutory tax rate |
35 | % | 35 | % | 35 | % | |||||
Expected tax expense |
$ | 23,970 | $ | 12,405 | $ | 8,628 | |||||
State and foreign income taxes, net of federal benefit |
1,326 | 1,723 | 1,113 | ||||||||
Non-deductible compensation |
1,977 | 627 | 229 | ||||||||
Change in statutory tax rate |
— | — | (278 | ) | |||||||
Change in valuation allowance |
(876 | ) | — | — | |||||||
Other |
521 | 187 | (120 | ) | |||||||
Provision for income taxes |
$ | 26,918 | $ | 14,942 | $ | 9,572 | |||||
We expect our taxable income (before utilization of federal NOL carryforwards) to remain at levels which will result in an overall 35% federal rate.
On December 31, 2010 we liquidated our two US subsidiaries, Pathfire and Enliven, into the parent company. As a result, we revalued our state deferred tax assets and liabilities and recorded a $0.7 million benefit, which lowered our overall effective tax rate by approximately 1%.
As of December 31, 2010 we had NOL carryforwards with a tax-effected carrying value of approximately $36.2 million for federal purposes and state NOL carryforwards of $5.8 million. Our federal NOLs will expire on various dates ranging from 2011 to 2028. Utilization of these carryforwards will be limited on an annual basis as a result of previous business combinations pursuant to Section 382
F-26
DG FASTCHANNEL, INC. AND SUBSIDIARIES
NOTES TO CONSOLIDATED FINANCIAL STATEMENTS (Continued)
10. Income Taxes (Continued)
of the Internal Revenue Code. Expected future annual limitations are as follows (amounts shown in millions and are not tax affected):
Years
|
Annual Limitation |
|||
|---|---|---|---|---|
2011 |
$ | 19.5 | ||
2012 |
11.7 | |||
2013 |
9.6 | |||
2014 - 2019 |
5.8 | |||
2020 - 2027 |
4.2 | |||
In 2009 and 2008 we completed our assessment of the acquired Enliven and Pathfire NOL carryforwards, respectively, and concluded that the realization of these NOL carryforwards was more likely than not. Therefore, in 2009 and 2008 $32.6 million and $9.6 million, respectively, of the valuation allowances related to these acquired NOL carryforwards were reversed as a reduction to goodwill.
We believe the results of future operations will generate sufficient taxable income to realize the benefits of all of our net deferred tax assets.
We recognize the financial statement benefit of a tax position only after determining that the relevant tax authority would more-likely-than not sustain the position following an audit. For tax positions meeting the more-likely-than not threshold, the amount recognized in the financial statements is the largest benefit that has a greater than 50 percent likelihood of being realized upon ultimate settlement with the relevant tax authority. At December 31, 2010 and 2009, we had not recognized a liability for any uncertain tax positions.
Interest and penalties related to uncertain tax positions are recognized in income tax expense. For the three years ended December 31, 2010, we did not recognize any penalties or interest related to unrecognized tax benefits in our financial statements.
We are subject to U.S. federal income tax, United Kingdom income tax, as well as income taxes of multiple state jurisdictions. Federal income tax returns for 2006 through 2009 remain open to examination, and state, local, and United Kingdom income tax returns for 2005 through 2009 remain open to examination.
11. Impairment of Springbox Unit
Our Springbox unit performed below our expectations in the fourth quarter of 2010 primarily due to customer losses during the year. As a result we conducted an impairment analysis of its long-lived assets and determined they were not fully recoverable. Substantially all of Springbox's long-lived assets consist of intangible assets (customer relationships and trade name). We estimated the fair value of Springbox's assets using a discounted cash flow model (a Level 3 fair value measurement). We then adjusted the carrying value of the long-lived assets to their estimated fair value of $2.7 million, which resulted in an impairment charge of $5.9 million. The impairment charge is reflected in the statement of income as "Impairment of Springbox unit." We also evaluated the remaining useful life of the Springbox customer relationships asset and determined a five year remaining life was appropriate. The shortened useful life became effective on January 1, 2011.
F-27
DG FASTCHANNEL, INC. AND SUBSIDIARIES
NOTES TO CONSOLIDATED FINANCIAL STATEMENTS (Continued)
12. Employee Benefit Plan
We have a 401(k) retirement plan for our employees based in the United States. Employees may contribute a portion of their earnings up to a yearly maximum ($16,500 for 2010). In early 2008, we matched 1% of the gross pay for those employees contributing at least 3% of their gross pay into the plan. Later in 2008, we changed our policy to match 25% of the amount contributed by employees, up to a maximum employee contribution of 6% of gross earnings. In April 2009, we ceased matching a portion of our employee contributions. In March 2010, we reinstated our policy to match 25% of the amount contributed by employees, up to a maximum employee contribution of 6% of gross earnings. During 2010, 2009, and 2008, we made matching contributions of approximately $358,000, $159,000 and $254,000, respectively.
13. Stock Plans
We have several stock incentive plans outstanding, including the 2006 Long-Term Stock Incentive Plan (the "2006 Plan") and plans we assumed from certain acquired companies. While several stock incentive plans remain outstanding, awards may only be granted under the 2006 Plan. Awards can take the form of (i) stock options, (ii) stock appreciation rights, (iii) restricted stock awards and (iv) performance awards, and can be granted to employees, officers, directors and consultants. The 2006 Plan provides that the maximum number of shares of common stock with respect to which awards may be granted shall not exceed 2,200,000 shares. Stock awards are determined by the compensation committee of our board of directors (the "Committee"). Generally, the terms of stock options, including the number of shares of common stock subject to the option and the vesting schedule, are determined by the Committee. On occasion, awards granted to non-executive personnel are made by our Chief Executive Officer. However, the exercise price shall not be less than the fair value of our common stock on the date of grant. Stock option grants typically have terms of ten years, vest over four years, and are recognized on a straight-line basis over the vesting term. At December 31, 2010, there were a total of 767,466 shares of common stock available for future grant under the 2006 Plan.
Stock Options
A summary of our stock option activity for 2010 is presented below:
| |
2010 | |||||||
|---|---|---|---|---|---|---|---|---|
| |
Shares | Weighted-Average Exercise Price |
||||||
Outstanding at beginning of year |
1,049,110 | $ | 17.45 | |||||
Granted |
358,000 | 26.09 | ||||||
Exercised |
(81,378 | ) | 15.12 | |||||
Canceled |
(48,438 | ) | 27.47 | |||||
Outstanding at end of year |
1,277,294 | $ | 19.64 | |||||
Exercisable at end of year (vested) |
576,667 | $ | 17.04 | |||||
F-28
DG FASTCHANNEL, INC. AND SUBSIDIARIES
NOTES TO CONSOLIDATED FINANCIAL STATEMENTS (Continued)
13. Stock Plans (Continued)
The following table summarizes information about stock options outstanding at December 31, 2010:
| |
Options Outstanding | |
|
|||||||||||||
|---|---|---|---|---|---|---|---|---|---|---|---|---|---|---|---|---|
| |
Options Exercisable | |||||||||||||||
| |
|
Weighted-Average Remaining Contractual Life (in years) |
|
|||||||||||||
Range of Exercise Prices
|
Number Outstanding |
Weighted-Average Exercise Price |
Number Exercisable |
Weighted-Average Exercise Price |
||||||||||||
$ 5.00 - $12.49 |
178,162 | 2.81 | $ | 6.11 | 178,162 | $ | 6.11 | |||||||||
$12.50 - $14.99 |
519,105 | 7.74 | 14.10 | 264,897 | 14.06 | |||||||||||
$15.00 - $24.99 |
263,576 | 9.49 | 21.70 | 13,086 | 21.58 | |||||||||||
$25.00 - $34.99 |
139,074 | 8.34 | 27.95 | 45,145 | 28.32 | |||||||||||
$35.00 - $175.00 |
177,377 | 5.94 | 39.89 | 75,377 | 45.81 | |||||||||||
$ 5.00 - $175.00 |
1,277,294 | 7.23 | $ | 19.64 | 576,667 | $ | 17.04 | |||||||||
Options granted had a weighted-average grant-date fair value per share of $14.78, $14.62 and $8.28 for the years ended December 31, 2010, 2009 and 2008, respectively. The weighted-average remaining contractual life of vested stock options at December 31, 2010 was 5.2 years.
Options exercised had an intrinsic value of $1.7, million, $2.1 million and $0.1 million for the years ended December 31, 2010, 2009 and 2008, respectively. Our practice has been to issue new shares (as opposed to treasury shares) upon exercise of stock options.
The intrinsic value of options outstanding at December 31, 2010 was approximately $13.0 million. The intrinsic value of options exercisable at December 31, 2010 was approximately $7.8 million.
Compensation costs related to unvested options and restricted stock was $9.5 million at December 31, 2010. These costs are expected to be recognized over the weighted-average remaining vesting period of 2.7 years.
The fair value of each option was estimated on the date of grant using the Black-Scholes option pricing model with the following assumptions (excludes options issued to replace options assumed in connection with an acquisition):
| |
2010 | 2009 | 2008 | |||||||
|---|---|---|---|---|---|---|---|---|---|---|
Number of options granted |
358,000 | 165,000 | 641,823 | |||||||
Weighted-average exercise price of options granted |
$ | 26.09 | $ | 25.37 | $ | 14.39 | ||||
Volatility(1) |
58 | % | 58 | % | 60 | % | ||||
Risk free interest rate(2) |
2.3 | % | 3.0 | % | 1.8 | % | ||||
Expected term (years)(3) |
6.3 | 6.3 | 6.2 | |||||||
Expected annual dividends |
None | None | None | |||||||
- (1)
- Expected
volatility is based on the historical volatility of our stock over a preceding period commensurate with the expected term of the award.
- (2)
- The risk free rate is based on the U.S. Treasury yield curve at the time of grant for periods consistent with the expected term of the option.
F-29
DG FASTCHANNEL, INC. AND SUBSIDIARIES
NOTES TO CONSOLIDATED FINANCIAL STATEMENTS (Continued)
13. Stock Plans (Continued)
- (3)
- The expected term was calculated as the average between the vesting term and the contractual term, weighted by tranche. We used the simplified method discussed in ASC 718-10-S99-1 as we do not have sufficient historical data in order to calculate a more appropriate estimate.
Restricted Stock
In October 2008, we granted 350,000 shares of common stock to Scott K. Ginsburg, our Chairman and Chief Executive Officer, under a restricted stock agreement. The restricted stock agreement provides for vesting over the following periods: (i) 116,667 shares on August 1, 2009, (ii) 116,667 shares on August 1, 2010, and (iii) 116,666 shares on August 1, 2011. Any remaining forfeiture provisions immediately terminate upon a change in control (as defined in the restricted stock agreement). The fair value of the restricted stock on the date of grant was $5.9 million, of which $2.0 million, $2.3 million and $0.5 million was recognized as compensation expense in 2010, 2009 and 2008, respectively.
In 2010, 2009 and 2008, we granted a total of 12,000, 10,000 and 10,000 shares of our common stock, respectively, to our non-employee directors under restricted stock agreements. The total fair value of each annual restricted stock grant was $0.5 million, $0.2 million and $0.2 million, of which $0.4 million, $0.2 million and $0.1 million was recognized as compensation expense in 2010, 2009 and 2008, respectively. The restricted stock grants made in 2010 provide for vesting over 12 months. Earlier restricted stock grants provide for vesting over 36 months. Stock compensation expense is recognized ratably over the vesting term based on the grant date fair value. During 2010, the restrictions on 10,000 shares of restricted stock had lapsed. The fair value of restricted stock that vested during 2010, 2009, and 2008 was $0.2 million, $0.1 million and $0.1 million, respectively. As of December 31, 2010, none of these shares had been forfeited.
A summary of our restricted stock activity for 2010, 2009 and 2008 is presented below:
| |
2010 | 2009 | 2008 | |||||||||||||||||
|---|---|---|---|---|---|---|---|---|---|---|---|---|---|---|---|---|---|---|---|---|
| |
Shares | Weighted Average Grant-Date Fair Value per Share |
Shares | Weighted Average Grant-Date Fair Value per Share |
Shares | Weighted Average Grant-Date Fair Value per Share |
||||||||||||||
Nonvested shares at beginning of year |
253,333 | $ | 17.00 | 366,667 | $ | 16.92 | 10,000 | $ | 16.63 | |||||||||||
Granted |
12,000 | $ | 39.27 | 10,000 | $ | 19.07 | 360,000 | $ | 16.92 | |||||||||||
Vested |
(126,666 | ) | $ | 16.97 | (123,334 | ) | $ | 16.92 | (3,333 | ) | $ | 16.63 | ||||||||
Nonvested shares at end of year |
138,667 | $ | 18.96 | 253,333 | $ | 17.00 | 366,667 | $ | 16.92 | |||||||||||
The vesting date fair value of shares vesting during the years ended December 31, 2010, 2009 and 2008 was $5.0 million, $2.6 million and $0.1 million, respectively.
F-30
DG FASTCHANNEL, INC. AND SUBSIDIARIES
NOTES TO CONSOLIDATED FINANCIAL STATEMENTS (Continued)
13. Stock Plans (Continued)
Warrants
We issued warrants to purchase common stock in connection with certain mergers and common stock offerings. A summary of our warrant activity for 2010, 2009 and 2008 is presented below:
| |
2010 | 2009 | 2008 | |||||||||||||||||
|---|---|---|---|---|---|---|---|---|---|---|---|---|---|---|---|---|---|---|---|---|
| |
Warrants | Weighted Average Exercise Price |
Warrants | Weighted Average Exercise Price |
Warrants | Weighted Average Exercise Price |
||||||||||||||
Outstanding at beginning of year |
688,170 | $ | 11.68 | 691,099 | $ | 11.69 | 660,492 | $ | 10.00 | |||||||||||
Exercised |
(678,187 | ) | $ | 10.09 | (2,929 | ) | 13.64 | — | — | |||||||||||
Cancelled |
(8,085 | ) | $ | 36.36 | — | — | — | — | ||||||||||||
Issued in Enliven merger |
— | — | — | $ | — | 30,607 | $ | 48.20 | ||||||||||||
Outstanding at end of year |
1,898 | $ | 474.24 | 688,170 | $ | 11.68 | 691,099 | $ | 11.69 | |||||||||||
Stock Repurchase Program
On August 30, 2010, our Board of Directors authorized the purchase of up to $30 million of our common stock in the open market or unsolicited negotiated transactions. The stock repurchase program has no expiration date. Through December 31, 2010 we had made share repurchases totaling $13.1 million leaving $16.9 million available for future share repurchases.
14. Commitments and Contingencies
Litigation
In September 2010, a securities class-action lawsuit captioned Duncan v. Ginsburg, et al, was filed against the Company and certain of its officers and directors in the U.S. District Court for the Southern District of New York (10 Civ. 6523). Subsequently, an identical lawsuit by the same plaintiff, also captioned Duncan v. Ginsburg, et al, was filed in the U.S. District Court for the Northern District of Texas (10 Civ. 1769), and a similar lawsuit, captioned Tours v. DG FastChannel Inc., et al, was filed in the U.S. District Court for the Southern District of New York by a different plaintiff (10 Civ. 6930). The Northern District of Texas lawsuit was voluntarily dismissed by the plaintiff and the other two lawsuits were consolidated before Judge Richard J. Sullivan in the U.S. District Court for the Southern District of New York, captioned In re DG FastChannel, Inc. Securities Litigation (10 Civ. 6523). On November 24, 2010, Judge Sullivan appointed a lead plaintiff and ordered that a consolidated amended complaint be filed. On January 24, 2011, the lead plaintiff filed a consolidated amended complaint on behalf of a purported class of persons who purchased or otherwise acquired DG FastChannel common stock between August 4, 2010 and August 27, 2010, inclusive. The consolidated amended complaint alleges violations of Sections 10(b) and 20(a) of the Exchange Act, and Rule 10b-5 promulgated thereunder. The lawsuit alleges, among other things, that the defendants made false or misleading statements of material fact, or failed to disclose material facts, about the Company's financial condition during the class period. The plaintiffs seek unspecified monetary damages and other relief. While the outcome of such lawsuits cannot be predicted with certainty, the Company intends to defend the action vigorously.
F-31
DG FASTCHANNEL, INC. AND SUBSIDIARIES
NOTES TO CONSOLIDATED FINANCIAL STATEMENTS (Continued)
14. Commitments and Contingencies (Continued)
We expect our defense costs and any loss that may result from this claim will be covered under our insurance policies.
We are involved in a variety of other legal actions arising from the ordinary course of business. We do not believe the ultimate resolution of these matters will have a material effect on our financial statements.
Leases
We lease office and storage facilities under non-cancelable operating leases. Generally, these leases are for periods of three to five years and usually contain one or more renewal options.
The table below summarizes our lease obligations for office and storage facilities, including amounts of escalating operating lease rental payments, at December 31, 2010 (in thousands):
Contractual Obligations
|
Office Leases |
|||
|---|---|---|---|---|
2011 |
$ | 6,222 | ||
2012 |
4,081 | |||
2013 |
3,482 | |||
2014 |
2,494 | |||
2015 |
2,464 | |||
Thereafter |
5,337 | |||
|
$ | 24,080 | ||
Rent expense, net of sublease rentals, totaled $6.2 million, $6.5 million and $5.0 million in 2010, 2009 and 2008, respectively. Sublease rentals were approximately $0.2 million, $0.3 million and $0.4 million in 2010, 2009 and 2008, respectively.
15. Earnings per Share:
In calculating earnings per common share, we allocate our earnings between common shareholders and holders of unvested share-based payment awards (e.g. restricted stock) that contain rights to nonforfeitable dividends. This earnings allocation is referred to as the two-class method.
Under the two-class method undistributed earnings are allocated between common stock and participating securities (restricted stock) as if all of the net earnings for the period had been distributed. Basic earnings per common share excludes dilution and is calculated by dividing net earnings allocable to common shares by the weighted-average number of common shares outstanding during the period. Diluted earnings per common share is calculated by dividing net earnings allocable to common shares by the weighted-average number of common shares outstanding at the balance sheet date, as adjusted for the potential dilutive effect of non-participating share-based awards such as stock
F-32
DG FASTCHANNEL, INC. AND SUBSIDIARIES
NOTES TO CONSOLIDATED FINANCIAL STATEMENTS (Continued)
15. Earnings per Share: (Continued)
options and warrants. The following table reconciles earnings per common share for 2010, 2009 and 2008 (in thousands, except per share data):
| |
2010 | 2009 | 2008 | ||||||||
|---|---|---|---|---|---|---|---|---|---|---|---|
Net income |
$ | 41,569 | $ | 20,501 | $ | 15,079 | |||||
Less net income allocated to participating unvested share awards |
(310 | ) | (287 | ) | (68 | ) | |||||
Net income attributable to common shares |
$ | 41,259 | $ | 20,214 | $ | 15,011 | |||||
Weighted-average common shares outstanding—basic |
27,226 | 22,572 | 18,642 | ||||||||
Dilutive stock options and warrants |
344 | 519 | 431 | ||||||||
Weighted-average common shares outstanding—dilutive |
27,570 | 23,091 | 19,073 | ||||||||
Earnings per common share: |
|||||||||||
Basic |
$ | 1.52 | $ | 0.90 | $ | 0.81 | |||||
Diluted |
$ | 1.50 | $ | 0.88 | $ | 0.79 | |||||
Antidilutive securities not included: |
|||||||||||
Options and warrants |
556 | 819 | 651 | ||||||||
16. Segment Information
Our two segments consist of (i) digital and physical distribution of video and audio content and broadcast business intelligence and (ii) all other. The all other segment includes creative research services (i.e., SourceEcreative) and Internet marketing services (i.e., Springbox). Our reportable segments have been determined based on related products and services. Substantially all of our interest expense is recorded in the video and audio content distribution segment and is not allocated to the all other segment. Our reportable segments were as follows (in thousands):
| |
Year Ended December 31, 2010 | |||||||||
|---|---|---|---|---|---|---|---|---|---|---|
| |
Video and Audio Content Distribution |
All Other | Consolidated | |||||||
Revenues |
$ | 235,750 | $ | 11,778 | $ | 247,528 | ||||
Depreciation and amortization |
29,584 | 408 | 29,992 | |||||||
Income (loss) from operations(a) |
78,955 | (3,341 | ) | 75,614 | ||||||
| |
Year Ended December 31, 2009 | |||||||||
|---|---|---|---|---|---|---|---|---|---|---|
| |
Video and Audio Content Distribution |
All Other | Consolidated | |||||||
Revenues |
$ | 177,306 | $ | 13,580 | $ | 190,886 | ||||
Depreciation and amortization |
26,058 | 443 | 26,501 | |||||||
Income from operations |
43,415 | 3,887 | 47,302 | |||||||
F-33
DG FASTCHANNEL, INC. AND SUBSIDIARIES
NOTES TO CONSOLIDATED FINANCIAL STATEMENTS (Continued)
16. Segment Information (Continued)