Attached files
| file | filename |
|---|---|
| 8-K - KAMAN CORPORATION FORM 8-K DATED MARCH 15, 2013 - KAMAN Corp | form8-k.htm |

1
March 18, 2013
Investor Presentation

2
Forward Looking Statement
This presentation contains "forward-looking statements" within the meaning of the safe harbor provisions of the U.S. Private Securities Litigation Reform Act of 1995.
Forward-looking statements also may be included in other publicly available documents issued by the company and in oral statements made by our officers and
representatives from time to time. These forward-looking statements are intended to provide management's current expectations or plans for our future operating and
financial performance, based on assumptions currently believed to be valid. They can be identified by the use of words such as "anticipate," "intend," "plan," "goal,"
"seek," "believe," "project," "estimate," "expect," "strategy," "future," "likely," "may," "should," "will" and other words of similar meaning in connection with a discussion of
future operating or financial performance. Examples of forward looking statements include, among others, statements relating to future sales, earnings, cash flows,
results of operations, uses of cash and other measures of financial performance.
Because forward-looking statements relate to the future, they are subject to inherent risks, uncertainties and other factors that may cause the company's actual results
and financial condition to differ materially from those expressed or implied in the forward-looking statements. Such risks, uncertainties and other factors include, among
others: (i) changes in domestic and foreign economic and competitive conditions in markets served by the company, particularly the defense, commercial aviation and
industrial production markets; (ii) changes in government and customer priorities and requirements (including cost-cutting initiatives, the potential deferral of awards,
terminations or reductions of expenditures to respond to the priorities of Congress and the Administration, or budgetary cuts resulting from Congressional actions or
automatic sequestration under the Budget Control Act of 2011, as modified by the enactment of the Taxpayer Relief Act of 2012); (iii) changes in geopolitical conditions
in countries where the company does or intends to do business; (iv) the successful conclusion of competitions for government programs and thereafter contract
negotiations with government authorities, both foreign and domestic; (v) the existence of standard government contract provisions permitting renegotiation of terms and
termination for the convenience of the government; (vi) the satisfactory conclusion to government inquiries or investigations regarding government programs, including
the satisfactory resolution of the Wichita subpoena matter; (vii) risks and uncertainties associated with the successful implementation and ramp up of significant new
programs; (viii) potential difficulties associated with variable acceptance test results, given sensitive production materials and extreme test parameters; (ix) the
successful resale of the SH-2G(I) aircraft, equipment and spare parts; (x) the receipt and successful execution of production orders for the JPF U.S. government
contract, including the exercise of all contract options and receipt of orders from allied militaries, as all have been assumed in connection with goodwill impairment
evaluations; (xi) the continued support of the existing K-MAX® helicopter fleet, including sale of existing K-MAX® spare parts inventory; (xii) the accuracy of current cost
estimates associated with environmental remediation activities at the Bloomfield, Moosup and New Hartford, CT facilities and our U.K. facilities; (xiii) the profitable
integration of acquired businesses into the company's operations; (xiv) changes in supplier sales or vendor incentive policies; (xv) the effects of price increases or
decreases; (xvi) the effects of pension regulations, pension plan assumptions, pension plan asset performance and future contributions; (xvii) future levels of
indebtedness and capital expenditures; (xviii) the future availability of credit, the ability of the company to maintain its current credit rating and the impact on the
company's funding costs and competitive position if it is unable to do so; (xix) the continued availability of raw materials and other commodities in adequate supplies and
the effect of increased costs for such items; (xx) the effects of currency exchange rates and foreign competition on future operations; (xxi) changes in laws and
regulations, taxes, interest rates, inflation rates and general business conditions; (xxii) future repurchases and/or issuances of common stock and (xxiii) other risks and
uncertainties set forth in the company's annual, quarterly and current presentations, proxy statements and other filings with the SEC.
Any forward-looking information provided in this presentation should be considered with these factors in mind. We assume no obligation to update any forward-looking
statements contained in this presentation.
statements contained in this presentation.
Contact: Eric Remington
V.P., Investor Relations
(860) 243-6334
Eric.Remington@kaman.com

3
Non-GAAP Figures
Certain measures presented in this presentation are “Non-GAAP”
items. These figures are denoted with an asterisk (*).
items. These figures are denoted with an asterisk (*).
Reconciliations from GAAP measures to the Non-GAAP measures are
presented in Appendix II to this presentation and our earnings release
dated February 25, 2013.
presented in Appendix II to this presentation and our earnings release
dated February 25, 2013.

4
Business Strengths
• Secular trends helping to drive significant long-term growth
opportunities in Aerospace and Distribution
opportunities in Aerospace and Distribution
• High margin Aerospace bearing product lines benefiting from
increasing commercial aircraft build rates
increasing commercial aircraft build rates
• Select defense platforms ramping up - reset - service life extension
programs
programs
• Distribution business growing revenue, gaining scale via
acquisitions, and adding complementary product platforms
acquisitions, and adding complementary product platforms
• Investing in new product development and applications, acquisitions
and technology for long-term growth
and technology for long-term growth
• Strong balance sheet to drive growth and strategic initiatives
• Experienced management team

5
Kaman Corporation Overview
• Two businesses
– Aerospace
• Manufacturer and subcontractor in the global commercial aerospace
and defense market - extremely broad range of capabilities - proven
performance
and defense market - extremely broad range of capabilities - proven
performance
• Diverse and growing customer base of blue chip customers and
government divisions
government divisions
– Distribution
• Third largest distributor in the power transmission/motion
control/fluid power market
control/fluid power market
• Focused on technical differentiation and expansion into higher
margin products
margin products
• Publicly listed on the NYSE with a market capitalization of
approximately $930 million
approximately $930 million
• 2012 sales of $1.6 billion; 5,000 employees

6
Aerospace
40%
23%
37%
Kaman Corporation - 2012 Sales Overview
64%
36%
Distribution
Aerospace
$1.6B Revenues
12%

7
2012 Sales: $581 million
Aerospace
36%

8
Aerospace Business Drivers
• Legacy prime contractor capabilities provide attractive outsourcing
alternatives to OEMs
alternatives to OEMs
• High margin specialty bearing and aerostructure businesses
positioned to benefit from increasing production at Boeing and
Airbus
positioned to benefit from increasing production at Boeing and
Airbus
• Defense platforms provide exposure to key vertical lift and reset
programs
programs
• Continued outsourcing trend by OEMs and Super Tier 1s to
increase flexibility and lower costs
increase flexibility and lower costs

9
Aerospace
OBJECTIVE:
• $1 billion in sales / margins in the “high teens”
STRATEGY:
• DEPTH - Size/financial strength to address larger, integrated
work packages from primes/OEMs and Tier 1s
work packages from primes/OEMs and Tier 1s
• DIVERSITY - Balance portfolio through increased commercial
content
content
• DIFFERENTIATION - Continue to move from build-to-print to
design-and-build for higher margins and more defensible
positions
design-and-build for higher margins and more defensible
positions
• DEVELOPMENT - Increased, focused investments in our people
and infrastructure to increase capabilities and drive improved
performance
and infrastructure to increase capabilities and drive improved
performance

10
Aerospace Sales Mix 2007 vs. 2012
2007
2012
Defense Aerospace
Fuzing Products
Commercial Aerospace
37%
41%
22%
40%
38%
22%

11
Fixed trailing edge
Fuel tank access doors
Top covers
Red denotes bearing products
Nose landing gear
Horizontal
stabilizer
stabilizer
Main landing gear
Flaps
Rudder
Door assemblies
Engine/thrust reverser
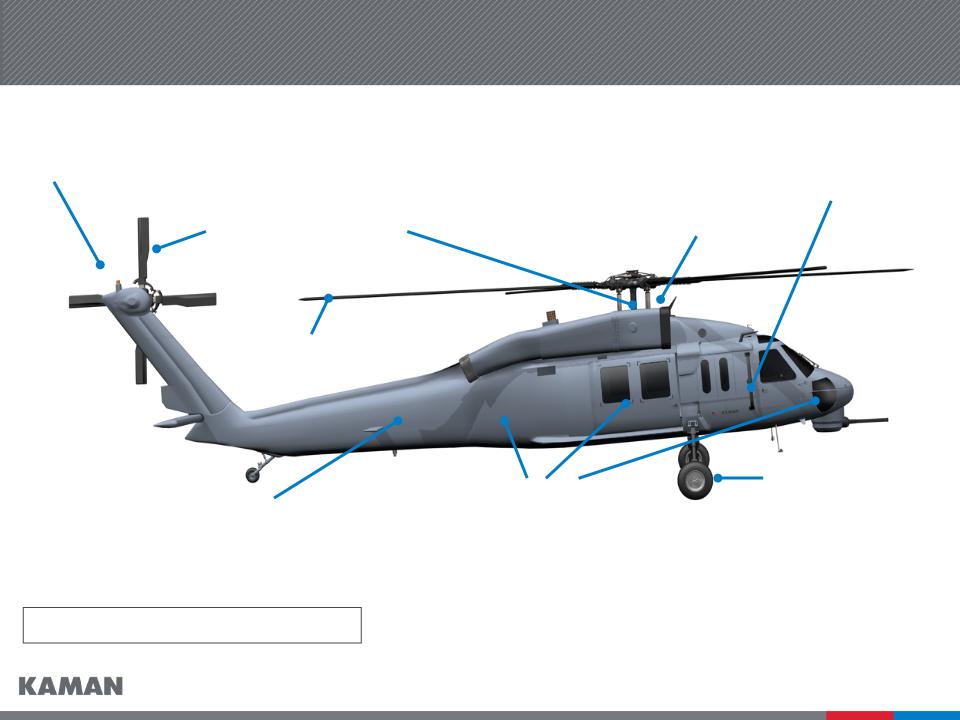
Aircraft Programs/Capabilities
Flight controls
Doors
12
Manufacture of cockpit
Blade erosion coating
Manufacture and assembly
of tail rotor pylon
of tail rotor pylon
Manufacture, sub
assembly and
joining of fuselage
assembly and
joining of fuselage
Blade manufacture,
repair and overhaul
repair and overhaul
Driveline couplings
Bushings
Flight control bearings
Aircraft Programs/Capabilities
Red denotes bearing products

13
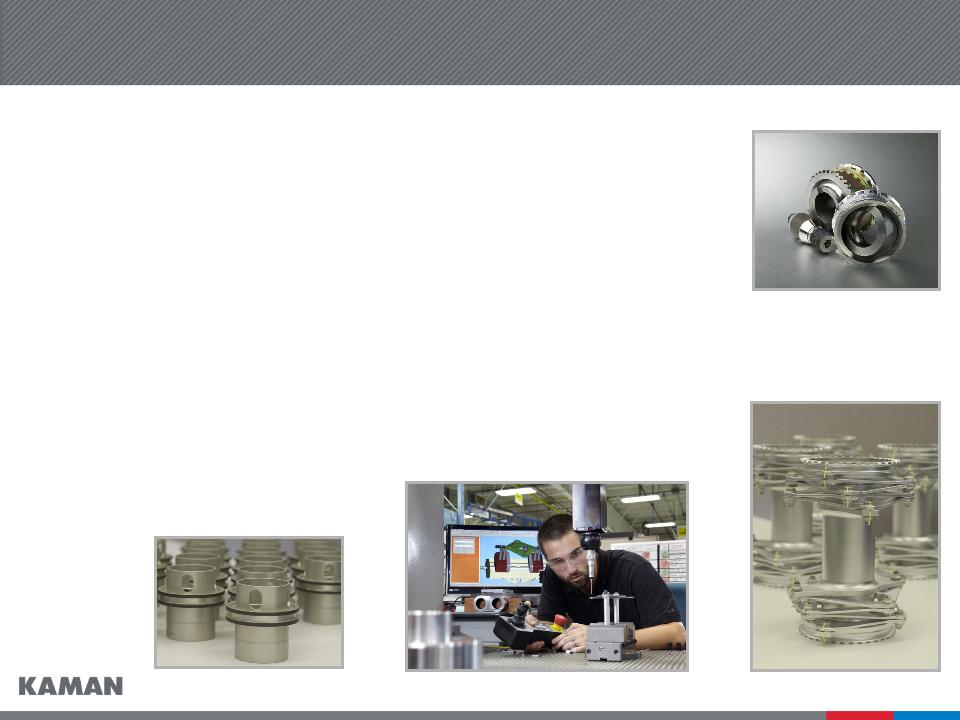
Aerospace Acquisition Program 2008 - 2012
• Acquisitions building capability:
– Brookhouse (U.K.)
– Global Aerosystems
– Vermont Composites
• Annual sales acquired, $115 million
• Average size, in sales of $39 million
• Average purchase price of $47 million, for a total of $140 million
Manufacture &
Mold Tooling
Assembly &
Tooling
Certification
Support
Aftermarket
MRO
Design
Manufacture &
Mold Tooling
Assembly &
Tooling
Certification
Support
Aftermarket
MRO
Life Cycle Management Capability

14
Aerospace Product Platforms
|
Product Platform
|
Specialty Bearings and
Engineered Products |
Fuzing and Precision
Products |
Aerosystems
|
|
Major product lines
|
•Self-lube airframe bearings
•Traditional airframe bearings
•Flexible drive systems
|
•Bomb safe and arm fuzing
devices •Missile safe and arm fuzing
devices •High precision measuring
systems •Memory products
|
•Engineering design and testing
•Tooling design and
manufacture •Complex aerostructure
machining, manufacture and assembly •Helicopter MRO and support
|
|
Customer categories
|
•Aerospace OEMs
•Aerospace subcontractors
•Distributors/aircraft operators
|
•U.S. and allied militaries
•Weapon system OEMs
|
•Aerospace OEMs
•Aerospace subcontractors
•Helicopter operators
|
|
Commercial/defense
exposure |
•Mostly commercial
|
•Virtually all defense
|
•Mix of defense and
commercial, majority defense |
15
Market leading self lube airframe bearing product lines
• Content on virtually every aircraft manufactured today with a
growing installed base
growing installed base
• Approximately 75% of sales are for commercial applications
• Proprietary technology:
– KAron® bearing liner system
– KAflex® and Tufflex® flexible couplings
• 95% of sales are for custom engineered applications
• Operational excellence through lean manufacturing
• World class application engineers and material scientists
developing new applications
developing new applications

16
• USAF bomb fuze of choice
• USAF inventory levels are less than
half desired quantity
half desired quantity
• Recently awarded $35.5 million direct
commercial sale contract
commercial sale contract
• $66 million backlog as of 12/31/2012
• Kaman is sole source, negotiating
four year follow-on contract
four year follow-on contract
• 23 foreign customers
Bomb Compatibility
- JDAM
- Paveway II and III
- GBU-10, 12, 16, 24, 27, 28, 31,
32, 38, 54
32, 38, 54
- BLU-109, 110, 111, 113, 117,
121, 122, 126
121, 122, 126
- MK82/BSU-49, MK83/BSU-85,
MK84/BSU-50
MK84/BSU-50
JPF Program

17
Aerospace - Sequestration Impact on Defense Programs
• We believe defense programs position us to weather potential
budget cuts
budget cuts
– Joint Programmable Fuze - backlog through 2013, foreign
demand, continued sole source
demand, continued sole source
– F-35 (Joint Strike Fighter) - incremental business at any
production level
production level
– A-10 re-wing program for Boeing - reset, new business
– AH-1Z integrated fuselage for Bell/USMC - new business
• Broadly diverse revenue base mitigates risk from large program
cancellations
cancellations
• Risk to revenue from sequestration is believed to be $20 million to
$25 million in 2013, less than 1.5% of expected consolidated
revenue
$25 million in 2013, less than 1.5% of expected consolidated
revenue

18
Positioned to Benefit from Ramp Up in Commercial Production
|
|
Projected Deliveries
|
||||
|
|
2012
|
|
2016
|
|
% Increase
|
|
Boeing 737
|
419
|
|
504
|
|
+ 20%
|
|
Boeing 777
|
84
|
|
100
|
|
+ 19%
|
|
Boeing 787
|
40
|
|
120
|
|
+ 200%
|
|
Airbus A320
|
455
|
|
480
|
|
+ 5%
|
|
Airbus A350
|
0
|
|
25
|
|
+++
|
|
Airbus A380
|
30
|
|
32
|
|
+ 7%
|
Source: J.P. Morgan (Joseph Nadol)

19
Unmanned K-MAX®
• Kaman/Lockheed teamed to provide
an unmanned military version of the
K-MAX helicopter
an unmanned military version of the
K-MAX helicopter
• Two K-MAXs have been performing
unmanned cargo resupply missions
in Afghanistan since December
2011 and have flown more than
1,000 missions and delivered more
than 3.0 million pounds of cargo
unmanned cargo resupply missions
in Afghanistan since December
2011 and have flown more than
1,000 missions and delivered more
than 3.0 million pounds of cargo
• “It’s kind of the rock star of the
Marine Corps unmanned aviation in
the past year,” - Major Dave
Funkhouser, Unmanned Aviation
Capabilities Integration Officer, US
Marine Corps
Marine Corps unmanned aviation in
the past year,” - Major Dave
Funkhouser, Unmanned Aviation
Capabilities Integration Officer, US
Marine Corps
Photograph by Corporal Lisa Tourtelot, United States Marine Corps.

20
Unmanned K-MAX Honors and Recognition
Winner in the Defense Category
Grand Award- “Best of What’s New”
Robot helicopters help out in war zones
The Robert J. Collier Trophy - 2012 Finalist

21
$1 Billion sales
“High Teens” operating margin
50% Design-and-build
50% Defense/50% Commercial
Super Tier II
Integrated, coordinated, synergistic
business
business
Multi-national
Competing on design-and-build
manufacturing capability, and
Intellectual Property
manufacturing capability, and
Intellectual Property
NOW
FUTURE/VISION
$581 Million sales
16.2%* Operating margin
70% Build-to-print
60% Defense
Tier II/III Supplier
Small, independent businesses
Primarily domestic
Competing on cost and
manufacturing capability
manufacturing capability
Aerospace Strategic Transition

22
Distribution
2012 Sales: $1.01 Billion
64%

23
Distribution Overview
• Industrial distribution firm with a $35 billion served market via three platforms
– Bearings and mechanical power transmission
– Fluid power
– Electrical automation and control
• Major product categories
– Bearings
– Mechanical and electrical power transmission
– Fluid Power
– Motion control
– Automation
– Material handling
– Electrical control and power distribution
• 234 locations and 5 distribution centers
• Executing growth strategy to achieve long-term sales and profit objectives

24
Distribution Sales Mix 2007 vs. 2012
Bearings and Mechanical Power Transmission
Fluid Power
Electrical and Automation
2007

25
Distribution
OBJECTIVE:
• $1.5 billion in sales - 7% operating profit margin
STRATEGY:
• SCALE/GROWTH - Broaden product offering organically and
through acquisitions. Expand geographic footprint to enhance
position in the national accounts market
through acquisitions. Expand geographic footprint to enhance
position in the national accounts market
• PRODUCTIVITY - Recognize benefits from organizational
realignment and implement multi-faceted technology
investments
realignment and implement multi-faceted technology
investments
• PROFITABILITY - Recognize sales and cost synergies from the
nine acquisitions completed in 2010, 2011 and 2012. Enhance
margins through new higher margin product lines, a focus on
pricing management and leverage increased purchasing scale
nine acquisitions completed in 2010, 2011 and 2012. Enhance
margins through new higher margin product lines, a focus on
pricing management and leverage increased purchasing scale
26
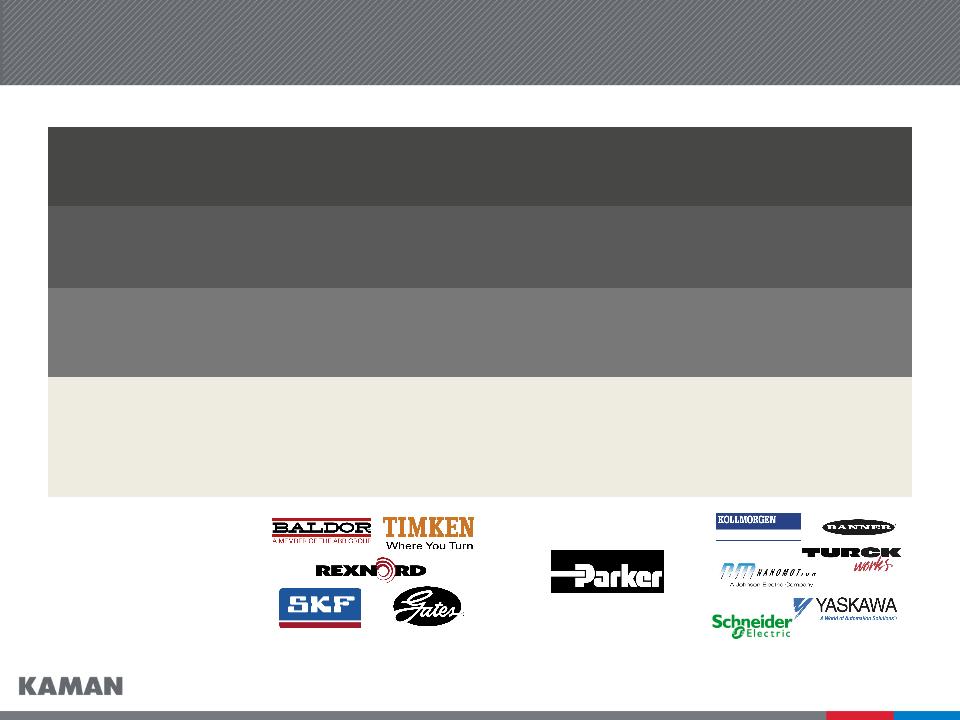
Major Product Platforms
|
Product Platform
|
Bearings & Mechanical Power
Transmission (BPT)
|
Fluid Power
|
Electrical Automation
& Control |
|
% of 2012 Sales
(approximate)
|
61%
|
14%
|
25%
|
|
Market Size
|
$12.5 Billion
|
$7.2 Billion
|
$15.0 Billion
|
|
Acquisitions
since 2008 |
•Industrial Supply Corp.
•Allied Bearings Supply
•Plains Bearing
•Fawick de Mexico
•Florida Bearings
|
•Catching Fluidpower
•INRUMEC
|
•Zeller
•Minarik
•Automation Technology
•Target Electronic
Supply |
|
Major Suppliers
|
|
|
|

27
Executing Strategy and Building Network

28
• Builds scale in Kaman’s automation and control (A&C) market
segment
segment
• Expands Kaman’s A&C served market to $15 billion by adding
electric control capabilities
electric control capabilities
• Adds Schneider as key vendor
• Establishes scale in value-added solutions
• Establishes Kaman as a provider of electrical controls products
• Expected to yield sales synergy opportunities from Kaman’s
national sales force
national sales force
Zeller - Summary of Merits

29
North American Strategic Alliance

30
Sourcepoint Combined Capabilities
• $1.4 billion in revenue
• Over $250 million in inventory
• 300 branches
• 3,000+ employees
• 3,000+ brands represented
• 250 engineers, specialists and technicians
• Over 4 million SKUs

31
$1.0 Billion sales
5.1%* operating margin
Presence in 72 of the top 100
industrial markets
industrial markets
Three product platforms
Narrow fluid power offering from
numerous single-technology
suppliers
numerous single-technology
suppliers
Eight ERP systems
$1.5 Billion sales
7.0% operating margin
Presence in ≈ 90 of the top 100 U.S.
industrial markets
industrial markets
Three major product platforms with
increased market share in
motion/automation and fluid power
increased market share in
motion/automation and fluid power
Broad fluid power offering from multi
-technology supplier
State of the art enterprise wide
business system
-technology supplier
State of the art enterprise wide
business system
FUTURE/VISION
NOW
Distribution Strategic Transition

32
Kaman Investment Merits
• A Leading Market Position in Both Business Segments
• Continued Focus on Profit Optimization, Increasing Cash Flows and
Strengthening Competitive Position
Strengthening Competitive Position
• Strong Liquidity and Conservative Financial Profile
– Investment Grade Rating (BBB-/Stable)
• Disciplined and Focused Acquisition Strategy
• Experienced Management Team

33
Financial Information
34
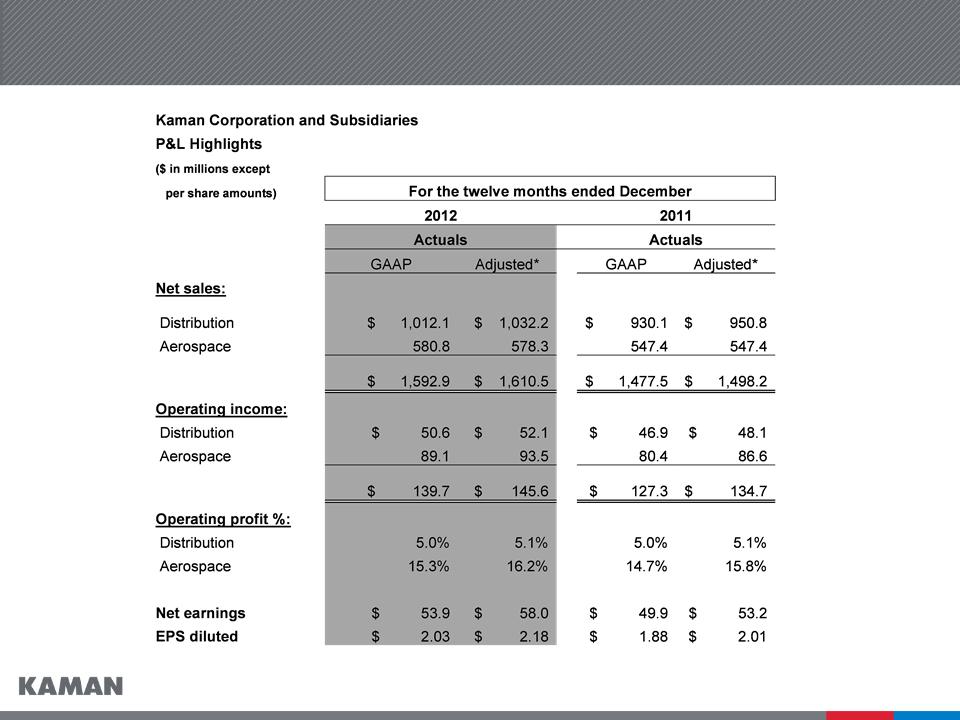
Financial Highlights - Full Year 2012

35
Balance Sheet, Capital Factors, and Cash Flow Items
|
(In Millions)
|
As of 12/31/12
|
As of 12/31/11
|
As of 12/31/10
|
|
Cash and Cash Equivalents
|
$ 16.6
|
$ 15.0
|
$ 32.2
|
|
Notes Payable and Long-term Debt
|
$ 259.6
|
$ 205.2
|
$ 148.4
|
|
Shareholders’ Equity
|
$ 420.2
|
$ 373.1
|
$ 362.7
|
|
Debt as % of Total Capitalization
|
38.2%
|
35.5%
|
29.0%
|
|
Capital Expenditures
|
$ 32.6
|
$ 28.8
|
$ 21.5
|
|
Depreciation & Amortization
|
$ 28.4
|
$ 23.2
|
$ 20.5
|
|
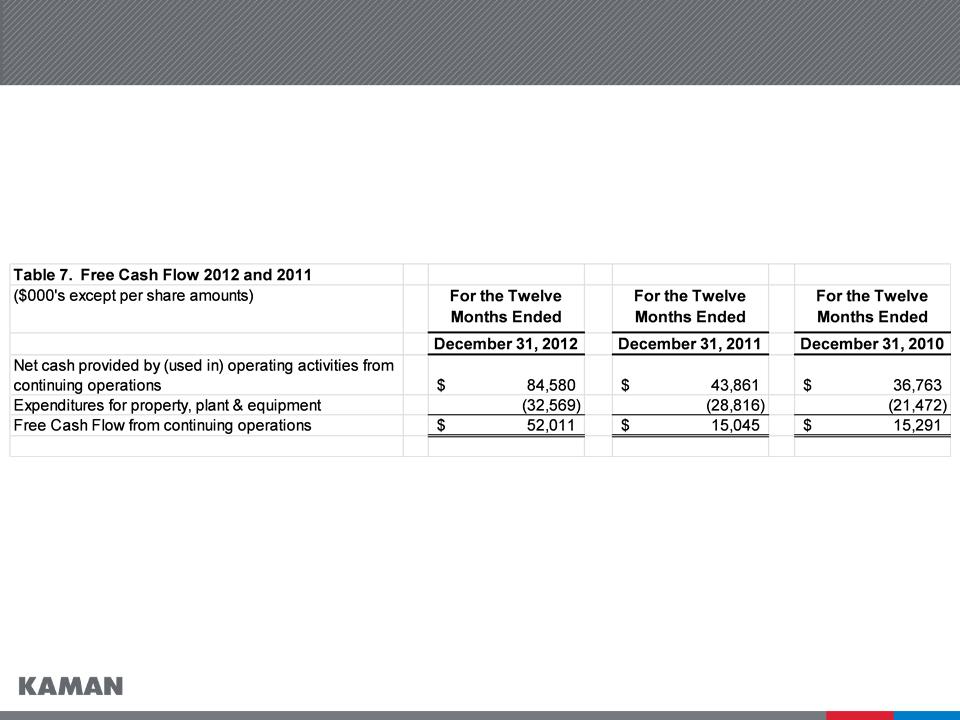
Free Cash Flow
|
$ 52.0
|
$ 15.0
|
$ 15.3
|
*
*

36
Appendix I

37
Why Two Businesses? Diversifies Revenue

38
Appendix II
Non-GAAP Reconciliations
Non-GAAP Reconciliations

39
Reconciliation of Non-GAAP Financial Information
40
Reconciliation of Non-GAAP Financial Information

41
Reconciliation of Non-GAAP Financial Information

42
Reconciliation of Non-GAAP Financial Information

43
Reconciliation of Non-GAAP Financial Information

44
Reconciliation of Non-GAAP Financial Information
45
Reconciliation of Non-GAAP Financial Information

46
Appendix III
Executive Compensation &
Corporate Governance
Executive Compensation &
Corporate Governance

47
Executive Compensation Aligned with Shareholder
Interests
Interests
• Alignment with the market allows Company to attract and retain key
talent
talent
• Company and individual performance drive base salary, annual
cash incentives and long-term incentives
cash incentives and long-term incentives
• Total compensation only reaches the median of market when
Company financial performance also is at the median of similar
sized industrial companies
Company financial performance also is at the median of similar
sized industrial companies
• The direct linkage to company financial performance serves
shareholder interests
shareholder interests
• SERP and Pensions benefit accruals ended in 2010
• Perquisites have essentially been eliminated for executive officers
(MERP, financial counseling, tax planning)
(MERP, financial counseling, tax planning)

48
Compensation Components
• Base Salary
• Long-Term Incentive
• Benefit Plans - Same plans as all other employees
• Car Allowance - Limited to executive officers and business unit heads
• Perquisites - Other executive perquisites eliminated
• Executive Employment Agreements - Limited to five key executives
• All compensation components compared to industrial surveys of similar
sized companies every 2-3 years
sized companies every 2-3 years
• Total compensation is driven by company and individual performance
• 79% of CEO’s compensation in 2012 was performance related
Targeted at the median of
industrial companies of similar size

49
Performance-Driven Annual Cash Incentive
• Annual cash incentive driven by financial performance
– Corporate - compared against the 5-year average of Russell 2000:
• Return on Investment
• EPS growth
• EPS performance against plan
• Individual Performance
– Business Units - compared against targets
• Return on Investment
• Year over year growth in operating income
• Year over year growth in sales
• Controllable cash flow
• Reviewed and approved by the Personnel and Compensation Committee of
the Board of Directors
the Board of Directors

50
Corporate Governance
• Strong and Independent Board of Directors
• Ten members; nine are independent with no relationship to the
Company other than Board service
Company other than Board service
• Independent Lead Director in place since 2002
• Board has majority voting policy for director elections
• Directors have broad senior leadership qualifications:
– Chief executive or chief financial officer roles
– Industry experience includes aerospace, defense, engineering,
distribution and financial services, both domestic and
international
distribution and financial services, both domestic and
international
• Virtually all directors serve on the board of other public companies
(generally not more than three)
(generally not more than three)