Attached files
| file | filename |
|---|---|
| 8-K/A - 8-K/A - SS&C Technologies Holdings Inc | d501770d8ka.htm |
| EX-99.2 - EX-99.2 - SS&C Technologies Holdings Inc | d501770dex992.htm |
| EX-23.1 - EX-23.1 - SS&C Technologies Holdings Inc | d501770dex231.htm |
| EX-99.3 - EX-99.3 - SS&C Technologies Holdings Inc | d501770dex993.htm |
Exhibit 99.1
| GlobeOp Financial Services S.A. Consolidated Financial Statements December 31, 2011, 2010 and 2009 |
GlobeOp Financial Services S.A.
Index
| Page(s) | ||||
| Report of Independent Auditor |
1 | |||
| Consolidated Financial Statements |
||||
| Balance Sheets |
2 | |||
| Income Statements |
3 | |||
| Statements of Comprehensive Income |
4 | |||
| Statements of Changes in Shareholders’ Equity |
5–6 | |||
| Statements of Cash Flows |
7 | |||
| Notes to Financial Statements |
8–50 | |||

Report of Independent Auditor
To the Board of Directors of
GlobeOp Financial Services S.A.:
In our opinion, the accompanying consolidated balance sheets as of December 31, 2011 and 2010 and the related consolidated income statements, consolidated statements of comprehensive income, consolidated statements of changes in shareholders’ equity and consolidated statements of cash flows for each of the three years in the period ended December 31, 2011 present fairly, in all material respects, the financial position of GlobeOp Financial Services S.A. and its subsidiaries at December 31, 2011 and 2010 and the results of their operations and their cash flows for each of the three years in the period ended December 31, 2011 in conformity with International Financial reporting standards (“IFRS”) as adopted by European Union. These consolidated financial statements are the responsibility of the Company’s management. Our responsibility is to express an opinion on these consolidated financial statements based on our audits. We conducted our audits of these consolidated financial statements in accordance with auditing standards generally accepted in the United States of America. Those standards require that we plan and perform the audit to obtain reasonable assurance about whether the consolidated financial statements are free of material misstatement. An audit includes examining, on a test basis, evidence supporting the amounts and disclosures in the consolidated financial statements, assessing the accounting principles used and significant estimates made by management, and evaluating the overall consolidated financial statement presentation. We believe that our audits provide a reasonable basis for our opinion.
IFRS as adopted by European Union vary in certain significant respects from accounting principles generally accepted in the United States of America. Information relating to the nature and effect of such differences is presented in Note 31 to the consolidated financial statements.
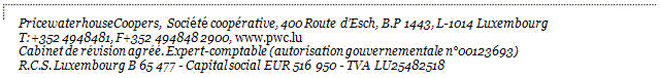
PricewaterhouseCoopers, Société coopérative
Represented by
/s/ Philippe Piérard
Luxembourg, July 16, 2012
GlobeOp Financial Services S.A.
Consolidated Balance Sheets
December 31, 2011 and 2010
| (in thousands) | 2011 | 2010 | ||||||
| Assets |
||||||||
| Noncurrent assets |
||||||||
| Intangible assets, net (Note 15) |
$ | 7,918 | $ | 7,078 | ||||
| Property, plant and equipment, net (Note 16) |
30,117 | 27,583 | ||||||
| Deferred income tax assets (Note 17) |
9,951 | 19,617 | ||||||
| Accounts receivable and other assets (Note 19) |
1,097 | 841 | ||||||
| Restricted cash (Note 18) |
2,110 | 2,133 | ||||||
|
|
|
|
|
|||||
| Total noncurrent assets |
51,193 | 57,252 | ||||||
|
|
|
|
|
|||||
| Current assets |
||||||||
| Accounts receivable and other assets (Note 19) |
27,664 | 21,147 | ||||||
| Corporate tax receivable |
772 | 549 | ||||||
| Cash and cash equivalents (Note 20) |
106,771 | 73,343 | ||||||
|
|
|
|
|
|||||
| Total current assets |
135,207 | 95,039 | ||||||
|
|
|
|
|
|||||
| Total assets |
$ | 186,400 | $ | 152,291 | ||||
|
|
|
|
|
|||||
| Shareholders’ Equity |
||||||||
| Capital and reserves attributable to equity holders of the Company |
||||||||
| Share capital (Note 21) |
$ | 12,678 | $ | 10,996 | ||||
| Share premium |
7,777 | 5,913 | ||||||
| Other reserves (Note 22) |
30,700 | 37,255 | ||||||
| Retained earnings |
93,523 | 61,977 | ||||||
|
|
|
|
|
|||||
| Total shareholders’ equity |
144,678 | 116,141 | ||||||
|
|
|
|
|
|||||
| Liabilities |
||||||||
| Noncurrent liabilities |
||||||||
| Trade and other payables (Note 26) |
1,140 | 1,032 | ||||||
| Provisions for liabilities and charges (Note 24) |
2,938 | 2,828 | ||||||
| Deferred lease obligations (Note 25) |
1,726 | 1,375 | ||||||
|
|
|
|
|
|||||
| Total noncurrent liabilities |
5,804 | 5,235 | ||||||
|
|
|
|
|
|||||
| Current liabilities |
||||||||
| Trade and other payables (Note 26) |
35,741 | 27,502 | ||||||
| Corporate tax liabilities |
177 | 3,404 | ||||||
| Provisions for liabilities and charges (Note 24) |
— | 9 | ||||||
|
|
|
|
|
|||||
| Total current liabilities |
35,918 | 30,915 | ||||||
|
|
|
|
|
|||||
| Total liabilities |
41,722 | 36,150 | ||||||
|
|
|
|
|
|||||
| Total shareholders’ equity and liabilities |
$ | 186,400 | $ | 152,291 | ||||
|
|
|
|
|
|||||
Approved by the Board of Directors and signed on its behalf by:
| H. Hufschmid | M. Veilleux | |||
| Chief Executive | Finance Director | |||
| February 28, 2012 | February 28, 2012 |
The accompanying notes are an integral part of these consolidated financial statements.
2
GlobeOp Financial Services S.A.
Consolidated Income Statements
Years Ended December 31, 2011, 2010 and 2009
| (in thousands, except per share data) | 2011 | 2010 | 2009 | |||||||||
| Revenue (Note 5) |
$ | 221,337 | $ | 189,337 | $ | 156,483 | ||||||
| Operating expenses (Note 6) |
(166,034 | ) | (145,896 | ) | (175,766 | ) | ||||||
|
|
|
|
|
|
|
|||||||
| Operating profit (loss) |
55,303 | 43,441 | (19,283 | ) | ||||||||
|
|
|
|
|
|
|
|||||||
| Finance income (Note 11) |
926 | 422 | 393 | |||||||||
| Finance costs (Note 11) |
(40 | ) | (493 | ) | (281 | ) | ||||||
|
|
|
|
|
|
|
|||||||
| Finance income (costs), net |
886 | (71 | ) | 112 | ||||||||
|
|
|
|
|
|
|
|||||||
| Profit (loss) before tax |
56,189 | 43,370 | (19,171 | ) | ||||||||
| Taxation (Note 12) |
(15,803 | ) | (9,624 | ) | 13,191 | |||||||
|
|
|
|
|
|
|
|||||||
| Profit (loss) for the year |
$ | 40,386 | $ | 33,746 | $ | (5,980 | ) | |||||
|
|
|
|
|
|
|
|||||||
| Earnings (loss) per share |
||||||||||||
| Basic (Note 13) |
$ | 0.39 | $ | 0.33 | $ | (0.06 | ) | |||||
| Diluted (Note 13) |
0.35 | 0.30 | (0.06 | ) | ||||||||
The accompanying notes are an integral part of these consolidated financial statements.
3
GlobeOp Financial Services S.A.
Consolidated Statements of Comprehensive Income
Years Ended December 31, 2011, 2010 and 2009
| (in thousands) | 2011 | 2010 | 2009 | |||||||||
| Net profit (loss) recognized in income statement |
$ | 40,386 | $ | 33,746 | $ | (5,980 | ) | |||||
|
|
|
|
|
|
|
|||||||
| Other comprehensive (loss) income |
||||||||||||
| Cumulative translation adjustment |
(5,072 | ) | (357 | ) | 2,195 | |||||||
|
|
|
|
|
|
|
|||||||
| Other comprehensive (loss) income |
(5,072 | ) | (357 | ) | 2,195 | |||||||
|
|
|
|
|
|
|
|||||||
| Total comprehensive income (loss) |
$ | 35,314 | $ | 33,389 | $ | (3,785 | ) | |||||
|
|
|
|
|
|
|
|||||||
The accompanying notes are an integral part of these consolidated financial statements.
4
GlobeOp Financial Services S.A.
Consolidated Statements of Changes in Shareholders’ Equity
Years Ended December 31, 2011, 2010 and 2009
| Share Capital | ||||||||||||||||
| (in thousands) | Ordinary Shares |
Treasury Shares |
Share Premium |
Retained Earnings |
||||||||||||
| Balances at January 1, 2009 |
$ | 10,960 | $ | (41 | ) | $ | 8,356 | $ | 40,186 | |||||||
| Total comprehensive loss for the year |
— | — | — | (5,980 | ) | |||||||||||
| Exercise of share options (Note 21) |
— | 30 | 385 | — | ||||||||||||
| Shares issued related to restricted stock units vesting (Note 21) |
— | 53 | (53 | ) | — | |||||||||||
| Share buyback (Note 21) |
— | (73 | ) | (539 | ) | — | ||||||||||
| Employee share compensation (Note 10) |
— | — | — | — | ||||||||||||
| Modification of performance share options (Note 10) |
— | — | — | — | ||||||||||||
| Tax on items taken directly to or transferred from equity (Note 17) |
— | — | — | — | ||||||||||||
| Transfer to nondistributable reserve |
— | — | — | 900 | ||||||||||||
| Transfer to legal reserve (Note 22) |
— | — | — | (356 | ) | |||||||||||
| Dividends paid (Note 14) |
— | — | — | (2,885 | ) | |||||||||||
|
|
|
|
|
|
|
|
|
|||||||||
| Balances at December 31, 2009 |
10,960 | (31 | ) | 8,149 | 31,865 | |||||||||||
| Total comprehensive income for the year |
— | — | — | 33,746 | ||||||||||||
| Exercise of share options (Note 21) |
31 | 102 | 1,525 | — | ||||||||||||
| Shares issued related to restricted stock units vesting (Note 21) |
5 | 43 | (48 | ) | — | |||||||||||
| Share buyback (Note 21) |
— | (114 | ) | (3,713 | ) | — | ||||||||||
| Employee share compensation (Note 10) |
— | — | — | — | ||||||||||||
| Tax on items taken directly to or transferred from equity (Note 17) |
— | — | — | — | ||||||||||||
| Transfer to nondistributable reserve |
— | — | — | 285 | ||||||||||||
| Transfer to legal reserve (Note 22) |
— | — | — | (228 | ) | |||||||||||
| Dividends paid (Note 14) |
— | — | — | (3,691 | ) | |||||||||||
|
|
|
|
|
|
|
|
|
|||||||||
| Balances at December 31, 2010 |
10,996 | — | 5,913 | 61,977 | ||||||||||||
| Total comprehensive income for the year (Note 21) |
— | — | — | 40,386 | ||||||||||||
| Exercise of share options (Note 21) |
191 | 36 | 3,857 | — | ||||||||||||
| Shares issued related to restricted stock units vesting (Note 21) |
13 | — | (13 | ) | — | |||||||||||
| Shares to be issued reserve (Note 21) |
13 | — | (13 | ) | — | |||||||||||
| Share buyback (Note 21) |
— | (36 | ) | (1,967 | ) | — | ||||||||||
| Conversion of B Beneficiary Certificates (Note 21) |
1,465 | — | — | — | ||||||||||||
| Employee share compensation (Note 10) |
— | — | — | — | ||||||||||||
| Tax on items taken directly to or transferred from equity (Note 17) |
— | — | — | — | ||||||||||||
| Transfer to legal reserve (Note 22) |
— | — | — | (481 | ) | |||||||||||
| Dividends paid (Note 14) |
— | — | — | (8,359 | ) | |||||||||||
|
|
|
|
|
|
|
|
|
|||||||||
| Balances at December 31, 2011 |
$ | 12,678 | $ | — | $ | 7,777 | $ | 93,523 | ||||||||
|
|
|
|
|
|
|
|
|
|||||||||
5
GlobeOp Financial Services S.A.
Consolidated Statements of Changes in Shareholders’ Equity
Years Ended December 31, 2011, 2010 and 2009
| Other Reserves | ||||||||||||||||||||||||
| (in thousands) | Shares to be Issued |
B Beneficiary Certificates |
Legal Reserves |
Reserve for Treasury Shares |
Cumulative Translation Adjustment |
Total | ||||||||||||||||||
| Balances at January 1, 2009 |
$ | 20,581 | $ | 1,465 | $ | 35 | $ | 1,185 | $ | (5,402 | ) | $ | 77,325 | |||||||||||
| Total comprehensive loss for the year |
— | — | — | — | 2,195 | (3,785 | ) | |||||||||||||||||
| Exercise of share options (Note 21) |
— | — | — | — | — | 415 | ||||||||||||||||||
| Shares issued related to restricted stock units vesting (Note 21) |
— | — | — | — | — | — | ||||||||||||||||||
| Share buyback (Note 21) |
— | — | — | — | — | (612 | ) | |||||||||||||||||
| Employee share compensation (Note 10) |
3,478 | — | — | — | — | 3,478 | ||||||||||||||||||
| Modification of performance share options (Note 10) |
726 | — | — | — | — | 726 | ||||||||||||||||||
| Tax on items taken directly to or transferred from equity (Note 17) |
2,661 | — | — | — | — | 2,661 | ||||||||||||||||||
| Transfer to nondistributable reserve |
— | — | — | (900 | ) | — | — | |||||||||||||||||
| Transfer to legal reserve (Note 22) |
— | — | 356 | — | — | — | ||||||||||||||||||
| Dividends paid (Note 14) |
— | — | — | — | — | (2,885 | ) | |||||||||||||||||
|
|
|
|
|
|
|
|
|
|
|
|
|
|||||||||||||
| Balances at December 31, 2009 |
27,446 | 1,465 | 391 | 285 | (3,207 | ) | 77,323 | |||||||||||||||||
| Total comprehensive income for the year |
— | — | — | — | (357 | ) | 33,389 | |||||||||||||||||
| Exercise of share options (Note 21) |
— | — | — | — | — | 1,658 | ||||||||||||||||||
| Shares issued related to restricted stock units vesting (Note 21) |
— | — | — | — | — | — | ||||||||||||||||||
| Share buyback (Note 21) |
— | — | — | — | — | (3,827 | ) | |||||||||||||||||
| Employee share compensation (Note 10) |
2,960 | — | — | — | — | 2,960 | ||||||||||||||||||
| Tax on items taken directly to or transferred from equity (Note 17) |
8,329 | — | — | — | — | 8,329 | ||||||||||||||||||
| Transfer to nondistributable reserve |
— | — | — | (285 | ) | — | — | |||||||||||||||||
| Transfer to legal reserve (Note 22) |
— | — | 228 | — | — | — | ||||||||||||||||||
| Dividends paid (Note 14) |
— | — | — | — | — | (3,691 | ) | |||||||||||||||||
|
|
|
|
|
|
|
|
|
|
|
|
|
|||||||||||||
| Balances at December 31, 2010 |
38,735 | 1,465 | 619 | — | (3,564 | ) | 116,141 | |||||||||||||||||
| Total comprehensive income for the year (Note 21) |
— | — | — | — | (5,072 | ) | 35,314 | |||||||||||||||||
| Exercise of share options (Note 21) |
— | — | — | — | — | 4,084 | ||||||||||||||||||
| Shares issued related to restricted stock units vesting (Note 21) |
— | — | — | — | — | — | ||||||||||||||||||
| Shares to be issued reserve (Note 21) |
(13 | ) | — | — | 13 | — | — | |||||||||||||||||
| Share buyback (Note 21) |
— | — | — | — | — | (2,003 | ) | |||||||||||||||||
| Conversion of B Beneficiary Certificates (Note 21) |
— | (1,465 | ) | — | — | — | — | |||||||||||||||||
| Employee share compensation (Note 10) |
4,613 | — | — | — | — | 4,613 | ||||||||||||||||||
| Tax on items taken directly to or transferred from equity (Note 17) |
(5,112 | ) | — | — | — | — | (5,112 | ) | ||||||||||||||||
| Transfer to legal reserve (Note 22) |
— | — | 481 | — | — | — | ||||||||||||||||||
| Dividends paid (Note 14) |
— | — | — | — | — | (8,359 | ) | |||||||||||||||||
|
|
|
|
|
|
|
|
|
|
|
|
|
|||||||||||||
| Balances at December 31, 2011 |
$ | 38,223 | $ | — | $ | 1,100 | $ | 13 | $ | (8,636 | ) | $ | 144,678 | |||||||||||
|
|
|
|
|
|
|
|
|
|
|
|
|
|||||||||||||
The accompanying notes are an integral part of these consolidated financial statements.
6
GlobeOp Financial Services S.A.
Consolidated Statements of Cash Flows
Years Ended December 31, 2011, 2010 and 2009
| (in thousands) | 2011 | 2010 | 2009 | |||||||||
| Cash flows from operating activities |
||||||||||||
| Profit (loss) before tax |
$ | 56,189 | $ | 43,370 | $ | (19,171 | ) | |||||
| Adjustments to reconcile profit before tax to net cash provided by operating activities |
||||||||||||
| Depreciation and amortization (Note 6) |
7,424 | 7,355 | 8,693 | |||||||||
| Share-based compensation (Note 8) |
4,613 | 2,960 | 3,883 | |||||||||
| Provision for post-employment obligations (Note 8) |
349 | 271 | 226 | |||||||||
| Movement in provisions (Note 24) |
— | — | 44,953 | |||||||||
| Interest income (Note 11) |
(926 | ) | (422 | ) | (393 | ) | ||||||
| Interest expense (Note 11) |
40 | 493 | 281 | |||||||||
| Bad debt provision (Note 19) |
118 | 154 | (35 | ) | ||||||||
| Change in operating assets and liabilities |
||||||||||||
| Accounts receivable (Note 19) |
(4,574 | ) | (1,291 | ) | 323 | |||||||
| Accrued income (Note 19) |
532 | (2,358 | ) | 2,922 | ||||||||
| Prepaid expenses and other assets (Note 19) |
(3,190 | ) | (1,328 | ) | 4,186 | |||||||
| Provisions for liabilities and charges (Note 24) |
(9 | ) | (17,232 | ) | (32,177 | ) | ||||||
| Trade payables (Note 26) |
955 | (465 | ) | (3,266 | ) | |||||||
| Accruals and other payables (Note 26) |
7,502 | 6,154 | (4,710 | ) | ||||||||
|
|
|
|
|
|
|
|||||||
| Cash provided by operating activities |
69,023 | 37,661 | 5,715 | |||||||||
| Interest received |
940 | 412 | 410 | |||||||||
| Interest paid |
— | — | (12 | ) | ||||||||
| Taxation (paid) received, net |
(15,424 | ) | 4,895 | (5,158 | ) | |||||||
|
|
|
|
|
|
|
|||||||
| Net cash provided by operating activities |
54,539 | 42,968 | 955 | |||||||||
|
|
|
|
|
|
|
|||||||
| Cash flows from investing activities |
||||||||||||
| Additions to intangible assets (Note 15) |
(2,841 | ) | (2,738 | ) | (3,183 | ) | ||||||
| Purchase of property, plant and equipment (Note 16) |
(7,489 | ) | (3,118 | ) | (5,339 | ) | ||||||
|
|
|
|
|
|
|
|||||||
| Net cash used in investing activities |
(10,330 | ) | (5,856 | ) | (8,522 | ) | ||||||
|
|
|
|
|
|
|
|||||||
| Cash flows from financing activities |
||||||||||||
| Dividends paid (Note 14) |
(8,359 | ) | (3,691 | ) | (2,885 | ) | ||||||
| Share repurchase (Note 21) |
(2,003 | ) | (3,827 | ) | (612 | ) | ||||||
| Proceeds from share option exercises (Note 21) |
4,084 | 1,658 | 415 | |||||||||
|
|
|
|
|
|
|
|||||||
| Net cash used in financing activities |
(6,278 | ) | (5,860 | ) | (3,082 | ) | ||||||
|
|
|
|
|
|
|
|||||||
| Increase in cash and cash equivalents |
37,931 | 31,252 | (10,649 | ) | ||||||||
| Cash and cash equivalents |
||||||||||||
| Beginning of year |
73,343 | 42,572 | 51,259 | |||||||||
| Effect of exchange rate changes on cash and cash equivalents |
(4,503 | ) | (481 | ) | 1,962 | |||||||
|
|
|
|
|
|
|
|||||||
| End of year |
$ | 106,771 | $ | 73,343 | $ | 42,572 | ||||||
|
|
|
|
|
|
|
|||||||
The accompanying notes are an integral part of these consolidated financial statements.
7
GlobeOp Financial Services S.A.
Notes to Consolidated Financial Statements
December 31, 2011, 2010 and 2009
| 1. | Organization |
GlobeOp Financial Services S.A. (the “Company”) is a Luxembourg holding company incorporated on January 22, 2000 as a “Société Anonyme” and subject to the laws of the Grand Duchy of Luxembourg.
The registered address of the Company is 5, rue Guillaume Kroll, L-1882, Luxembourg.
The Company has its primary listing on the London Stock Exchange.
The Company and its subsidiaries (the “Group”) provides administration, middle and back office services and integrated risk-reporting to hedge funds, asset management firms and other sectors of the financial industry; including family wealth offices, banks, insurance companies, pension funds and corporate treasuries. The Group has offices in the United Kingdom, the United States of America, India, the Cayman Islands and the Republic of Ireland. The Group provides its services primarily from these locations.
These Group consolidated financial statements were authorized for issue by the Board of Directors on February 28, 2012.
| 2. | Accounting Policies |
The principal accounting policies applied in the preparation of these consolidated financial statements are set out below. These policies have been consistently applied to all years presented, unless otherwise stated.
Statement of Compliance
The consolidated financial statements of the Company have been prepared in accordance with International Financial Reporting Standards as adopted by the European Union (“EU”) (“IFRS as adopted by the EU”) and IFRIC interpretations, applicable to companies reporting under IFRS.
Basis of Preparation
The consolidated financial statements have been prepared under the historical cost convention.
Significant Accounting Estimates and Judgments
The preparation of consolidated financial statements and related disclosures in conformity with IFRS requires the use of certain critical accounting estimates. It also requires management to exercise its judgment in the process of applying the Group’s accounting policies. The estimates and associated assumptions are based on historical experience and various other factors that are believed to be reasonable under the circumstances, the results of which form the basis of making the judgments about carrying values of assets and liabilities that are not readily available from other sources. Actual results may differ from these estimates.
The areas involving a higher degree of judgment or complexity, or areas where assumptions and estimates are significant to the consolidated financial statements, are disclosed in Note 4.
8
GlobeOp Financial Services S.A.
Notes to Consolidated Financial Statements
December 31, 2011, 2010 and 2009
Standards, Amendments and Interpretations Effective in 2011
The Group has implemented the following revisions and amendments to existing standards and interpretations as of January 1, 2011, which have no impact on the Group’s overall results and financial position.
| IFRS 1 (Amendment) | First-time Adoption of International Financial Reporting Standards | |
| IFRS 7 (Amendment) | Financial Instruments: Disclosures | |
| IAS 1 (Amendment) | Presentation of Financial Statements | |
| IAS 24 (Revision) | Related Party Disclosures | |
| IAS 32 (Amendment) | Classification of Rights Issues | |
| IAS 34 (Amendment) | Interim Financial Reporting | |
| IFRIC 19 | Extinguishing Financial Liabilities with Equity Instruments | |
| IFRIC 14 (Amendment) | Prepayments of a Minimum Funding Requirement |
Adoption of New and Revised Standards
Standards, interpretations and amendments to existing standards that are not yet effective and have not been early adopted by the Group:
| IFRS 9 | Financial Instruments | January 1, 2013 | ||
| IFRS 10 | Consolidated Financial Statements | January1, 2013 | ||
| IFRS 11 | Joint Arrangements | January1, 2013 | ||
| IFRS 12 | Disclosure of Interests in Other Entities | January1, 2013 | ||
| IFRS 13 | Fair Value Measurement | January1, 2013 | ||
| IAS 1 | Presentation of Financial Statements | July1, 2012 | ||
| IAS 12 | Income Taxes | January1, 2012 | ||
| IAS 19 | Employee Benefits | January1, 2013 | ||
| IAS 27 | Consolidated and Separate Financial Statements | January1, 2013 | ||
| IAS 28 | Investments in Associates | January1, 2013 |
The Group is currently assessing the impact of these new and revised standards, amendments and interpretations but does not expect at this stage that they would have a significant impact on the Group’s consolidated financial position.
Consolidation
Subsidiaries are all entities over which the Group has the power to govern the financial and operating policies generally accompanying a shareholding of more than one-half of the voting rights. The existence and effect of potential voting rights that are currently exercisable or convertible are considered when assessing whether the Group controls another entity. Subsidiaries are fully consolidated from the date on which control is transferred to the Group. They are de-consolidated from the date that control ceases to exist.
All inter-company transactions, balances and unrealized gains on transactions between Group companies are eliminated. Unrealized losses are also eliminated but considered an impairment indicator of the asset transferred. Accounting policies of subsidiaries have been changed where necessary to ensure consistency with the policies of the Group.
9
GlobeOp Financial Services S.A.
Notes to Consolidated Financial Statements
December 31, 2011, 2010 and 2009
Foreign Currency Transactions
Functional and Presentation Currency
Items included in the consolidated financial statements of each of the Group’s entities are measured using the currency of the primary economic environment in which the entity operates (the “functional currency”). The Group’s presentation currency is United States dollars (“USD”) ($).
Transactions and Balances
Foreign currency transactions are translated into the functional currency using the exchange rates prevailing at the dates of the transactions. Foreign exchange gains and losses resulting from the settlement of such transactions and from the translation at period end exchange rates of monetary assets and liabilities denominated in foreign currencies are recognized in the consolidated income statement.
Group Companies
The results and financial position of all the Group entities (none of which has the currency of a hyperinflationary economy) which have a functional currency different from the presentation currency are translated into the presentation currency as follows:
| i. | Assets and liabilities for each balance sheet presented are translated at the closing rate at the date of the balance sheet; |
| ii. | Income and expenses for each income statement are translated at average exchange rates (unless this average is not a reasonable approximation of the cumulative effect of the rates prevailing on the transaction dates, in which case income and expenses are translated at the rate on the dates of the transactions); and |
| iii. | All resulting exchange differences are recognized as a separate component of equity. |
On consolidation, exchange differences arising from the translation of the net investment in foreign operations, and of borrowings and other currency instruments designated as hedges of such investments, are taken to equity. When a foreign operation is partially disposed of or sold, exchange differences that were recorded in equity are recognized in the consolidated income statement as part of the gain or loss on sale.
Goodwill and fair value adjustments arising on acquisition of a foreign entity are treated as assets and liabilities of the foreign entity and translated at the closing rate.
Intangible Assets
Internally Generated Software
Research expenditures and maintenance costs associated with internally generated software are expensed as incurred. Costs incurred on software development (relating to design, programming, and testing of new or enhanced software) are capitalized as intangible assets from the point at which it is determined that the software is technologically feasible, there is the intention to complete the development, the resources are available to complete development, the Group has the ability to use or sell the intangible asset, development costs can be measured reliably and the asset will generate probable future economic benefit. The expenditures capitalized represent employee compensation costs. Other development expenditures are recognized as an expense as incurred. Internally generated software costs previously recognized as an expense are not recognized as an asset in a subsequent period. Where the carrying value of an asset is greater than its estimated recoverable amount the asset is written down immediately to its recoverable amount.
10
GlobeOp Financial Services S.A.
Notes to Consolidated Financial Statements
December 31, 2011, 2010 and 2009
Internally generated software costs are recorded at cost and are amortized over their estimated useful life of three years on a straight-line basis commencing when the asset is placed in service.
Software Licenses
Acquired computer software licenses are capitalized on the basis of the costs incurred to acquire and bring to use the specific software. These costs are amortized on a straight-line basis over the assets useful life which ranges from one to three years. Where the carrying value of an asset is greater than its estimated recoverable amount the asset is written down immediately to its recoverable amount. Gains and losses on disposals are determined by comparing proceeds with carrying amounts and are recognized in the consolidated income statement.
Goodwill
Goodwill represents the excess of the cost of an acquisition over the fair value of the Group’s share of the net identifiable assets of the acquired subsidiary at the date of acquisition and is included in intangible assets. Goodwill is tested for impairment on an annual basis or when there is an indication that the carrying amount is not recoverable. The goodwill currently recognized on the consolidated balance sheet is solely associated with an acquired subsidiary that is considered to be a cash-generating unit and is expected to benefit from the business combination in which the goodwill arose. The Group determines the valuation of the cash-generating unit based on reports prepared annually by an independent third-party valuation firm.
The fair value of the cash-generating unit is estimated through the use of discounted cash flows. These discounted cash flows use eight-year projections that are based on financial budgets approved by the Group. Cash flow projections take into account past experience and represent the Group’s best estimate about future developments. Key assumptions on which management has based its determination of fair value include estimated cash flows, weighted average cost of capital and tax rates.
Property, Plant and Equipment
Land and buildings are comprised of two office buildings in the United States of America owned by the Group. All property, plant and equipment are stated at historic cost less any depreciation. Historic cost includes expenditures that are directly attributable to the acquisition of the items. Cost may also include transfers from equity of any gains (losses) on qualifying cash flow hedges of foreign currency purchases of property, plant and equipment.
Subsequent costs are included in the asset’s carrying amount or recognized as a separate asset, as appropriate, only when it is probable that future economic benefits associated with the item will flow to the Group and the cost of the item can be measured reliably. The carrying amount of a replaced part is derecognized. All repairs and maintenance are charged to the consolidated income statement during the financial period in which they are incurred.
Land is not depreciated. Depreciation on all other assets is calculated using the straight-line method to allocate their cost over their estimated useful lives, as follows:
| Asset Type | Depreciation Period | |
| Buildings | Forty years | |
| Leasehold improvements | The lesser of the term of the lease or useful life | |
| Telephones, furniture and fittings | Five years | |
| Computer and office equipment | Three years |
11
GlobeOp Financial Services S.A.
Notes to Consolidated Financial Statements
December 31, 2011, 2010 and 2009
These assets are reviewed at each reporting period for indications of impairment. If an indication of impairment exists, the recoverable amount of the asset is estimated based on its fair value. An asset’s carrying amount is written down immediately to its recoverable amount if the asset’s carrying amount is greater than its estimated recoverable amount. In addition, the useful lives of these assets are also reviewed and adjusted, if appropriate, at each reporting period.
Gains and losses on disposals are determined by comparing the proceeds with carrying amounts and are recognized in the consolidated income statement.
Capital Work in Progress
Capital work in progress represents expenditures on property, plant and equipment in the course of construction. Transfers are made to property, plant and equipment when the assets are available for use.
Financial Assets
Financial assets can be classified in the following categories: at fair value through the profit or loss, loans and receivables, and available-for-sale. The classification of financial assets depends on the purpose for which the financial assets were acquired. Management determines the classification of its financial assets at initial recognition. The Group’s only financial assets are receivables. Receivables are nonderivative financial assets with fixed or determinable payments that are not quoted in an active market. They are included in current assets.
The Group assesses at each consolidated balance sheet date whether there is objective evidence that a financial asset or a group of financial assets is impaired. Impairment losses are recognized in the consolidated income statement. Impairment of accounts receivable is described in “Accounts Receivable and Other Assets” in Note 2.
Cash and Cash Equivalents
Cash and cash equivalents comprise cash at bank.
Restricted Cash
Restricted cash includes medium-term fixed deposits and monies held by a bank as security for a letter of credit issued due to lease requirements for an office space. Monies held by the bank as security earn interest and are classified as a noncurrent asset because they cannot be used by the Group until the end of the lease term.
Medium-term fixed deposits relate to monies held by a bank for a term greater than three months but less than one year. These are considered a noncurrent asset as the monies will be continuously re-invested in order to comply with regulatory requirements.
Accounts Receivable and Other Assets
Accounts receivable are initially recognized at fair value and subsequently measured at amortized cost, less any provision for impairment. A provision for impairment of accounts receivable is established when there is objective evidence that the Group will not be able to collect all amounts due according to the original terms of the receivables.
The amount of the provision is the difference between the asset’s carrying amount and the present value of estimated future cash flows. The carrying amount of the asset is reduced through the use of an allowance account, and the amount of the loss is recognized in the consolidated income statement. When an account receivable is uncollectible, it is written off against the allowance account for accounts receivable. Subsequent recoveries of amounts previously written off are credited within the consolidated income statement.
12
GlobeOp Financial Services S.A.
Notes to Consolidated Financial Statements
December 31, 2011, 2010 and 2009
Accrued income is revenue that has been recognized in the period, but not invoiced as of the consolidated balance sheet date.
Current and Deferred Income Tax
The tax charge for the year comprises current and deferred tax. Tax is recognized in the consolidated income statement, except to the extent that it relates to items recognized directly in equity. The current income tax charge is calculated on the basis of the tax laws enacted or substantively enacted at the consolidated balance sheet date in the countries where the Company’s subsidiaries operate and generate taxable income. Management periodically evaluates positions taken in tax returns with respect to situations in which applicable tax regulation is subject to interpretation and establishes provisions where appropriate on the basis of amounts expected to be paid to the tax authorities.
Deferred income tax is provided in full, using the liability method, on temporary differences arising between the tax bases of assets and liabilities and their carrying amounts in the consolidated financial statements.
Deferred income tax is determined using tax rates (and laws) that have been enacted or substantively enacted by the consolidated balance sheet date and are expected to apply when the related deferred income tax asset is realized or the deferred tax liability is settled. The principal temporary differences arise from share-based compensation, legal claims, depreciation and amortization of the Group’s intangible and tangible fixed assets and various accruals.
Deferred income tax assets are recognized to the extent that it is probable that future profit will be available against which temporary differences can be utilized.
Deferred income tax is provided on temporary differences arising on investments in subsidiaries, except where the timing of the reversal of the temporary timing difference is controlled by the Group and it is probable that the temporary timing difference will not reverse in the foreseeable future.
Deferred income tax assets and liabilities are offset when there is a legally enforceable right to offset current tax assets against current tax liabilities and when the deferred income tax assets and liabilities relate to income taxes levied by the same taxation authority on either the same taxable entity or different taxable entities where there is an intention to settle the balance on a net basis.
Share Capital
Ordinary shares are classified as equity. Incremental costs directly attributable to the issue of new shares are shown in equity as a deduction, net of tax, from the proceeds.
Employee Benefits
Share-Based Compensation
The Group operates a number of equity-settled, share-based compensation plans. Share options and restricted stock are granted to selected members of the Board of Directors, management and key employees.
The fair value of the employee service received in exchange for the grant of the options and restricted stock is recognized as an expense.
13
GlobeOp Financial Services S.A.
Notes to Consolidated Financial Statements
December 31, 2011, 2010 and 2009
The total amount to be expensed over the vesting period is determined by reference to the fair value of the options granted, excluding the impact of any nonmarket vesting conditions (for example, profitability and sales growth targets). Nonmarket vesting conditions are included in assumptions about the number of options that are expected to vest. At each consolidated balance sheet date, the entity revises its estimates of the number of options that are expected to vest. It recognizes the impact of the revision to the original estimates, if any, in the consolidated income statement, with a corresponding adjustment to equity.
The cash proceeds received, net of any directly attributable transaction costs, are credited to share capital (nominal value) and share premium when the options are exercised.
Pension Obligations
The Group operates various pension schemes that consist of defined-contribution plans.
For defined-contribution plans, the Group pays contributions to privately administered pension insurance plans on a mandatory, contractual or voluntary basis. The Group has no further payment obligations once the contributions have been paid. The contributions are recognized as employee benefit expense when they are due.
Other Post-Employment Benefits
One of the Group’s subsidiaries provides post-employment benefits to its employees. The entitlement to these benefits is usually conditional upon the employee completing a minimum service period. The benefit is in the form of a gratuity. The expected costs of this gratuity are accrued over the period of employment using the same methodology as used for a defined-benefit pension plan.
Actuarial gains and losses arising from experience adjustments, and changes in actuarial assumptions of the greater of 10% of the value of plan assets or 10% of the defined-benefit obligation, are charged or credited to income over the expected average remaining working lives of the related employees. This benefit is valued annually by independent qualified actuaries.
Bonus Plan
The Group recognizes a liability and an expense for bonuses. The Group recognizes a provision where contractually obliged or where there is a past practice that has created a constructive obligation.
Trade Payables
Trade payables are initially recognized at fair value and subsequently measured at amortized cost.
Provisions for Liabilities and Charges
Provisions are recognized when the Group has a present legal or constructive obligation as a result of past events, it is probable that an outflow of resources will be required to settle the obligation, and a reliable estimate of the amount can be made. If the effect is material, the provision is determined by discounting the expected future cash flows. Provisions are not recognized for future operating losses.
Provisions are measured at the present value of the expenditures expected to be required to settle the obligation using a pre-tax rate that reflects current market assessments of the time value of money and the risks specific to the obligation. The increase in the provision due to the passage of time is recognized as interest expense.
14
GlobeOp Financial Services S.A.
Notes to Consolidated Financial Statements
December 31, 2011, 2010 and 2009
Revenue Recognition
Revenue comprises the value for the sale of services in the ordinary course of the Group’s activities. Revenue is shown net of value-added tax, various US state sales taxes, discounts, and after eliminating sales within the Group.
The Group recognizes revenue when the amount of revenue can be reliably measured, it is probable that future economic benefits will flow to the entity and the stage of completion of the transaction at the consolidated balance sheet date can be measured reliably. The amount of revenue is not considered to be reliably measured until all significant contingencies relating to the sale have been resolved. The Group bases its estimates on historic results, taking into consideration the type of customer, the type of transaction and the specifics of each arrangement.
Revenue is generated from contractual service agreements with the Group’s clients. Such service agreements are primarily based upon a fee percentage of the assets under management of the Group’s clients. A portion of revenue is based upon a fee per transaction carried out by the client.
Revenue includes interest income related to interest earned on short-term deposits held in connection with the Group’s servicing activities. Interest income is recognized as earned.
Operating Leases
Leases where the Group acts as a lessee and where a significant proportion of the risks and rewards of ownership are retained by the lessors are classified as operating leases. Rental expense under such leases (net of any incentives received from the lessors) is recognized in the consolidated income statement on a straight-line basis over the term of the lease.
Dividend Policy
Dividend distribution to the Group’s Shareholders is recognized as a liability in the Group’s consolidated financial statements in the period in which the dividends are approved by the Group’s Shareholders.
Segment Reporting
Operating segments are reported in a manner consistent with the internal reporting provided to the chief operating decision-maker (“CODM”). The CODM, who is responsible for allocating resources and assessing performance of the operating segments, has been identified as the Management Committee that makes strategic decisions.
| 3. | Financial Risk Management |
The Group’s activities expose it to a variety of financial risks: market risk, industry risk, credit risk, concentration risk and liquidity risk. The Group’s overall risk management program focuses on the unpredictability of financial markets and seeks to minimize potential adverse effects on the Group’s consolidated financial performance.
Market Risk
Foreign Exchange Risk
The Group operates internationally and is exposed to foreign currency risk arising from various currency exposures, primarily with respect to the USD, Pound Sterling, Euro, Swiss Franc, and Indian Rupee. Foreign exchange risk arises on transactions denominated in a currency other than the functional currency and on the translation of the balance sheet and income statement into USD. The Group has the USD as its functional currency for its operations in the United States of America, Luxembourg, Cayman Islands and Republic of Mauritius. The Group’s operations in the United Kingdom, Republic of Ireland, Switzerland, and India have functional currencies of Pound Sterling, Euro, Swiss Franc and the Indian Rupee, respectively.
15
GlobeOp Financial Services S.A.
Notes to Consolidated Financial Statements
December 31, 2011, 2010 and 2009
The principal currency translation risk arises from the fact that the financial records of the subsidiaries in the United Kingdom, Republic of Ireland and India are maintained in Pound Sterling, Euro and Indian Rupee, respectively. Upon preparing consolidated financial statements, the USD-denominated consolidated reported financial results could be affected by changes in the relative value of the Pound Sterling, Euro and Indian Rupee against the USD. Moreover, fluctuations in currency values distort period-to-period comparisons of financial performance. Given the volatility of currency exchange rates, such distortions could be significant. The Group does not currently engage in currency hedging activities, and presently has no plans to enter into any forward exchange or derivative agreements in the future. Over the longer term, permanent changes in foreign exchange would have an impact on consolidated earnings. It is estimated that a general increase of one percentage point in the value of the USD against the other currencies (Pound Sterling, Rupee, Euro) would not have a significant impact on the profit before tax of the Group.
Interest Rate Risk
The Group earns interest on its cash and cash equivalents. A change in interest rates of one percentage point would not have a significant impact on the carrying value of these assets. In addition, the Group earns fee income related to interest earned on the flow of subscriptions prior to investment in funds. The Group’s income and operating cash flows could be impacted by changes in market interest rates.
Hedge Fund Services Industry Risk
The Group’s revenues are primarily generated from products and services provided to hedge funds and funds of hedge funds. The change in revenues is primarily related to the change in assets under administration. Assets under administration is defined as the aggregate amount of clients’ assets under management that is used as the basis for invoicing for services provided by the Group. A significant drop in clients’ assets under management, either through unsuccessful investing and trading strategies, or through an outflow of investors’ funds, would have a material effect on the Group’s business.
Credit Risk
Financial instruments that potentially expose the Group to credit risk consist primarily of cash equivalents and accounts receivable.
Cash and cash equivalents are held with seven institutions that are approved by the CODM and the Board of Directors. Excess cash on hand is held in interest bearing savings and checking accounts. As of December 31, 2011, two of these individual institutions held 49% and 26% of the Group’s total cash and cash equivalents, respectively, (2010: two institutions held 48% and 37% , respectively). The Group has policies in place to ensure that sales of services are made to clients with an appropriate credit history. The amount of accounts receivable that appears in the consolidated balance sheet is net of any provision for impairment. The maximum exposure to credit risk is represented by the carrying amount of each financial asset.
Concentration Risk
The Group’s clients primarily operate in the hedge fund industry. Accordingly, the Group is potentially exposed to events that would impact that industry.
For the years ended December 31, 2011, 2010 and 2009 one of the Group’s clients individually comprised 12%, 12% and 11% of the Group’s revenue, respectively. For the year ended December 31, 2011, the top ten balances within accounts receivable accounted for 49% of the total accounts receivable balance (2010: 38%).
16
GlobeOp Financial Services S.A.
Notes to Consolidated Financial Statements
December 31, 2011, 2010 and 2009
Liquidity Risk
Prudent liquidity risk management implies maintaining sufficient cash and the availability of funding through an adequate amount of committed credit facilities.
Management monitors rolling forecasts of the Group’s cash and cash equivalents on the basis of expected cash flow. This is generally carried out at the local level in the operating companies of the Group in accordance with the practice and limits set by the Group.
The table on this page sets forth the Group’s financial liabilities in relevant maturity groupings based on the remaining period from the consolidated balance sheet to the contractual maturity date, in accordance with supplier payment terms. The amounts disclosed in the table are the contractual undiscounted cash flows. Balances due within 12 months equal their carrying balances.
| Less Than | More Than | |||||||
| (in thousands) | 1 Year | 1 Year | ||||||
| Balances at December 31, 2010 |
||||||||
| Trade and other payables (Note 26) |
$ | 27,502 | $ | 1,032 | ||||
|
|
|
|
|
|||||
| Balances at December 31, 2011 |
||||||||
| Trade and other payables (Note 26) |
$ | 35,741 | $ | 1,140 | ||||
|
|
|
|
|
|||||
Capital Risk Management
The Group’s objectives when managing capital are to safeguard the Group’s ability to continue as a going concern in order to provide returns for Shareholders and benefits for other stakeholders and to maintain an optimal capital structure to reduce the cost of capital.
In order to maintain or adjust the capital structure, the Group may adjust the amount of dividends paid to Shareholders, return capital to Shareholders, issue new shares or sell assets to reduce debt.
| 4. | Critical Accounting Estimates and Judgments |
The estimates and associated assumptions are continually evaluated and are based on historical experience and various other factors that are believed to be reasonable under the circumstances, the results for which form the basis of making judgments about carrying values of assets and liabilities that are not readily available from other sources.
The Group makes estimates and assumptions concerning the future. The resulting accounting estimates will, by definition, seldom equal the related actual results. The estimates, assumptions and judgments that have a significant risk of causing a material adjustment to the carrying amounts of assets and liabilities within the next financial year are discussed below.
17
GlobeOp Financial Services S.A.
Notes to Consolidated Financial Statements
December 31, 2011, 2010 and 2009
Income Taxes
The Group is subject to income taxes in numerous jurisdictions. Significant judgment is required in determining the worldwide provision for income taxes, as well as the liabilities, if any, for the unremitted earnings of subsidiaries, should the Company decide in the future to distribute such earnings. There are many transactions and calculations for which the ultimate tax determination is uncertain during the ordinary course of business. The Group recognizes liabilities for anticipated tax audit issues based on estimates of whether it is probable that additional taxes will be due. Where the final tax outcome of these matters is different from the amounts that were initially recorded, such differences will impact the income tax provisions in the period in which such determination is made.
Accrued Income
Accrued income represents amounts earned for services that have been provided but for which clients have not yet been invoiced as of the consolidated balance sheet date. Management calculates accrued income based upon the best estimate of each client’s assets under administration. Assets under administration is a major component in calculating revenue.
Share-Based Compensation
The calculation of the fair value of share-based compensation requires several assumptions and estimates; their details are disclosed in Note 10.
Provisions for Liabilities and Charges
Provisions are made against potential settlements, claims or threatened litigation where management has concluded that a legal or constructive obligation exists, the settlement of these obligations is expected to result in an outflow of cash from the Group and the amount can be reasonably estimated. The amount of any future resolution is uncertain and management have applied their judgment when making these provisions. Insurance reimbursement receivables are recorded at the consolidated balance sheet date when it is virtually certain that the amounts will be received.
| 5. | Operating Segments |
The Group has one operating segment which corresponds to the information reported to its chief operating decision-maker, the Management Committee.
| Years Ended December 31, | ||||||||||||
| (in thousands) | 2011 | 2010 | 2009 | |||||||||
| Revenue from external customers |
||||||||||||
| MBA revenues |
$ | 202,887 | $ | 173,517 | $ | 145,884 | ||||||
| Risk Reporting revenues |
8,714 | 7,967 | 6,770 | |||||||||
| Transaction Solutions revenues |
9,736 | 7,853 | 3,829 | |||||||||
|
|
|
|
|
|
|
|||||||
| $ | 221,337 | $ | 189,337 | $ | 156,483 | |||||||
|
|
|
|
|
|
|
|||||||
18
GlobeOp Financial Services S.A.
Notes to Consolidated Financial Statements
December 31, 2011, 2010 and 2009
| Years Ended December 31, | ||||||||||||
| (in thousands) | 2011 | 2010 | 2009 | |||||||||
| Adjusted operating profit |
$ | 68,631 | $ | 56,087 | $ | 36,793 | ||||||
| Depreciation and amortization expense (Note 6) |
(7,424 | ) | (7,355 | ) | (8,693 | ) | ||||||
| Employee costs related to share-based compensation (Note 8) |
(4,613 | ) | (2,960 | ) | (3,883 | ) | ||||||
| Integration and redundancy costs (Note 6) |
(1,291 | ) | (2,331 | ) | — | |||||||
| Legal claims (Note 6) |
— | — | (43,500 | ) | ||||||||
|
|
|
|
|
|
|
|||||||
| $ | 55,303 | $ | 43,441 | $ | (19,283 | ) | ||||||
|
|
|
|
|
|
|
|||||||
Adjusted operating profit is calculated by the Group and reported to the Management Committee. It is not a measure of financial performance under IFRS.
The Group’s business operates in eight main geographical areas, even though they are managed on a worldwide basis.
The Group’s revenue from its customers is derived from subsidiaries located in the United States of America, United Kingdom, Cayman Islands and the Republic of Ireland.
| Years Ended December 31, | ||||||||||||
| (in thousands) | 2011 | 2010 | 2009 | |||||||||
| United States of America |
$ | 96,667 | $ | 82,469 | $ | 68,237 | ||||||
| United Kingdom |
70,027 | 59,599 | 49,348 | |||||||||
| Cayman Islands |
51,525 | 46,693 | 38,892 | |||||||||
| Republic of Ireland |
3,118 | 576 | — | |||||||||
| India |
— | — | 6 | |||||||||
| Luxembourg |
— | — | — | |||||||||
| Switzerland |
— | — | — | |||||||||
| Mauritius |
— | — | — | |||||||||
|
|
|
|
|
|
|
|||||||
| $ | 221,337 | $ | 189,337 | $ | 156,483 | |||||||
|
|
|
|
|
|
|
|||||||
19
GlobeOp Financial Services S.A.
Notes to Consolidated Financial Statements
December 31, 2011, 2010 and 2009
Noncurrent assets are allocated based on the country where the assets are located.
| December 31, 2011 | ||||||||||||||||
| (in thousands) | Intangible Assets, Net |
Property, Plant and Equipment, Net |
Accounts Receivable and Other Assets |
Restricted Cash |
||||||||||||
| United States of America |
$ | 1,722 | $ | 25,573 | $ | 40 | $ | 1,312 | ||||||||
| United Kingdom |
5,556 | 273 | 77 | — | ||||||||||||
| Cayman Islands |
— | 188 | 11 | — | ||||||||||||
| India |
640 | 3,895 | 969 | 22 | ||||||||||||
| Republic of Ireland |
— | 188 | — | 776 | ||||||||||||
| Luxembourg |
— | — | — | — | ||||||||||||
| Switzerland |
— | — | — | — | ||||||||||||
| Mauritius |
— | — | — | — | ||||||||||||
|
|
|
|
|
|
|
|
|
|||||||||
| $ | 7,918 | $ | 30,117 | $ | 1,097 | $ | 2,110 | |||||||||
|
|
|
|
|
|
|
|
|
|||||||||
| December 31, 2010 | ||||||||||||||||
| (in thousands) | Intangible Assets, Net |
Property, Plant and Equipment, Net |
Accounts Receivable and Other Assets |
Restricted Cash |
||||||||||||
| United States of America |
$ | 2,341 | $ | 25,266 | $ | 40 | $ | 1,311 | ||||||||
| United Kingdom |
4,018 | 197 | 95 | — | ||||||||||||
| Cayman Islands |
— | 332 | 11 | — | ||||||||||||
| India |
719 | 1,788 | 650 | 25 | ||||||||||||
| Republic of Ireland |
— | — | 45 | 797 | ||||||||||||
| Luxembourg |
— | — | — | — | ||||||||||||
| Switzerland |
— | — | — | — | ||||||||||||
|
|
|
|
|
|
|
|
|
|||||||||
| $ | 7,078 | $ | 27,583 | $ | 841 | $ | 2,133 | |||||||||
|
|
|
|
|
|
|
|
|
|||||||||
| 6. | Operating Expenses |
| Years Ended December 31, | ||||||||||||
| (in thousands) | 2011 | 2010 | 2009 | |||||||||
| Employee costs (Note 8) |
$ | 108,697 | $ | 92,727 | $ | 78,569 | ||||||
| Technology |
22,513 | 20,350 | 22,978 | |||||||||
| Depreciation and amortization (Notes 15 and 16) |
7,424 | 7,355 | 8,693 | |||||||||
| Occupancy |
11,734 | 10,829 | 10,617 | |||||||||
| Legal claims (Note 25) |
— | — | 43,500 | |||||||||
| Integration and redundancy costs |
1,291 | 2,331 | — | |||||||||
| Other |
14,375 | 12,304 | 11,409 | |||||||||
|
|
|
|
|
|
|
|||||||
| $ | 166,034 | $ | 145,896 | $ | 175,766 | |||||||
|
|
|
|
|
|
|
|||||||
20
GlobeOp Financial Services S.A.
Notes to Consolidated Financial Statements
December 31, 2011, 2010 and 2009
Included within occupancy expenses are rental expenses under operating lease agreements of $5,579,000 (2010: $4,919,000; 2009: $5,103,000). Included within other operating expenses are foreign exchange gains of $226,000 (2010: losses of $675,000; 2009: gains of $863,000).
Integration costs were incurred in relation to a lift-out mandate for a new client that launched in July 2010, including employee costs, technology, and other operating expenses. Redundancy costs relate to severance costs for employees terminated in the first half of 2011.
| 7. | Auditor Remuneration |
During the year, the Group obtained the following services from its auditor, PricewaterhouseCoopers, at costs detailed below:
| Years Ended December 31, | ||||||||||||
| (in thousands) | 2011 | 2010 | 2009 | |||||||||
| Audit fees for the Company’s annual financial statements |
$ | 918 | $ | 1,102 | $ | 1,097 | ||||||
| Tax compliance and consulting |
676 | 342 | 242 | |||||||||
| Other |
454 | 476 | 495 | |||||||||
|
|
|
|
|
|
|
|||||||
| $ | 2,048 | $ | 1,920 | $ | 1,834 | |||||||
|
|
|
|
|
|
|
|||||||
Included within other are fees relating to audits of the statutory financial statements of the subsidiaries, audits of the pension schemes and other services.
| 8. | Employee Costs |
The costs incurred in respect of employees were:
| Years Ended December 31, | ||||||||||||
| (in thousands) | 2011 | 2010 | 2009 | |||||||||
| Wages and salaries |
$ | 74,042 | $ | 64,460 | $ | 57,347 | ||||||
| Bonus and commissions |
17,149 | 14,791 | 8,329 | |||||||||
| Social security costs |
5,129 | 4,617 | 3,926 | |||||||||
| Short-term benefit costs |
4,120 | 3,410 | 3,072 | |||||||||
| Share-based compensation (Note 10) |
4,613 | 2,960 | 3,883 | |||||||||
| Pension costs–defined contribution plans |
1,536 | 1,074 | 585 | |||||||||
| Post-employment benefits |
349 | 271 | 226 | |||||||||
| Other staff costs |
1,759 | 1,144 | 1,201 | |||||||||
|
|
|
|
|
|
|
|||||||
| $ | 108,697 | $ | 92,727 | $ | 78,569 | |||||||
|
|
|
|
|
|
|
|||||||
Included within employee costs are costs attributable to research that have not been capitalized as part of internally generated software. During 2011, these costs amounted to $9,633,000 (2010: $8,566,000; 2009: $6,949,000). The employee costs that were capitalized as part of internally generated software during 2011 was $1,431,000 (2010: $808,000; 2009: $723,000) (Note 15).
21
GlobeOp Financial Services S.A.
Notes to Consolidated Financial Statements
December 31, 2011, 2010 and 2009
| 9. | Employee Numbers |
The average number of people employed, including part-time and temporary employees, by the Group during the year was as follows:
| Years Ended December 31, | ||||||||||||
| 2011 | 2010 | 2009 | ||||||||||
| United States of America |
394 | 397 | 394 | |||||||||
| United Kingdom |
140 | 130 | 120 | |||||||||
| Cayman Islands |
6 | 4 | 4 | |||||||||
| India |
1,461 | 1,144 | 1,071 | |||||||||
| Republic of Ireland |
20 | 12 | 7 | |||||||||
|
|
|
|
|
|
|
|||||||
| 2,021 | 1,687 | 1,596 | ||||||||||
|
|
|
|
|
|
|
|||||||
| 10. | Share Compensation |
Share Options
The Company grants nonqualified share options on ordinary shares to eligible employees and selected members of the Board of Directors. The exercise price is generally equal to the fair value of the shares at the time the options are issued. Share options are generally granted depending on level of service, but may be based on length of service. Outstanding share options have vesting periods of three to five years and generally vest based on length of service. For certain grants made to senior level employees vesting is based on meeting certain performance conditions related to adjusted operating profit targets. Share options are exercisable to the extent vested and are generally not exercisable later than ten years after the grant date. The Group has no obligation or intention to repurchase or settle the options in cash.
Movement in the number of share options outstanding and their related weighted average exercise prices are as follows:
| 2011 | 2010 | 2009 | ||||||||||||||||||||||
| (in thousands, except per share data) | Weighted Average Exercise Price Per Share |
Number of Options |
Weighted Average Exercise Price Per Share |
Number of Options |
Weighted Average Exercise Price Per Share |
Number of Options |
||||||||||||||||||
| Outstanding at January 1, |
$ | 2.47 | 19,078 | $ | 2.38 | 20,115 | $ | 2.66 | 17,549 | |||||||||||||||
| Granted |
7.18 | 632 | 3.72 | 655 | 1.76 | 4,937 | ||||||||||||||||||
| Forfeited |
3.60 | (381 | ) | 2.23 | (389 | ) | 2.15 | (151 | ) | |||||||||||||||
| Exercised |
2.16 | (1,894 | ) | 1.49 | (1,112 | ) | 1.66 | (250 | ) | |||||||||||||||
| Expired |
3.72 | (144 | ) | 3.30 | (191 | ) | 3.42 | (1,970 | ) | |||||||||||||||
|
|
|
|
|
|
|
|
|
|
|
|
|
|||||||||||||
| Outstanding at December 31, |
$ | 2.64 | 17,291 | $ | 2.47 | 19,078 | $ | 2.38 | 20,115 | |||||||||||||||
|
|
|
|
|
|
|
|
|
|
|
|
|
|||||||||||||
At December 31, 2011, 13,175,000 (2010: 13,000,000; 2009: 12,657,000) options were exercisable. In 2011, 1,894,062 (2010: 1,112,075; 2009: 250,000) options were exercised. The related weighted average fair value share price at the time of exercise was $6.62 (2010: $4.14; 2009: $3.16) per share. The related transaction costs were nil.
22
GlobeOp Financial Services S.A.
Notes to Consolidated Financial Statements
December 31, 2011, 2010 and 2009
Share options outstanding at the end of each year presented had the following expiry dates and exercise prices:
(in thousands, except exercise price)
| Expiry Date | Number of Options Outstanding | |||||||||||||||
| During | Share Class | Exercise Price | 2011 | 2010 | 2009 | |||||||||||
| 2014 | Ordinary | 1.01 | 157 | 157 | 888 | |||||||||||
| 2014 | Ordinary | 1.66 | 2,916 | 3,051 | 3,236 | |||||||||||
| 2014 | Ordinary | 2.00 | 475 | 500 | 500 | |||||||||||
| 2014 | Ordinary | 2.40 | 162 | 285 | 328 | |||||||||||
| 2015 | Ordinary | 2.40 | 300 | 300 | 300 | |||||||||||
| 2015 | Ordinary | 2.80 | 163 | 168 | 214 | |||||||||||
| 2015 | Ordinary | 3.60 | 1,234 | 1,436 | 1,558 | |||||||||||
| 2016 | Ordinary | 3.60 | 3,109 | 3,290 | 3,356 | |||||||||||
| 2017 | Ordinary | 1.06 | 910 | 1,733 | 1,733 | |||||||||||
| 2017 | Ordinary | 3.60 | 890 | 1,144 | 1,250 | |||||||||||
| 2017 | Ordinary | 4.21-4.38 | 95 | 105 | 108 | |||||||||||
| 2017 | Ordinary | 5.11 | 22 | 87 | 87 | |||||||||||
| 2018 | Ordinary | 0.65-0.88 | 1,583 | 1,722 | 1,830 | |||||||||||
| 2018 | Ordinary | 2.26 | 250 | 250 | 250 | |||||||||||
| 2018 | Ordinary | 3.48-3.80 | 378 | 477 | 534 | |||||||||||
| 2018 | Ordinary | 4.05 | 750 | 750 | 750 | |||||||||||
| 2019 | Ordinary | 1.13-1.55 | 36 | 48 | 62 | |||||||||||
| 2019 | Ordinary | 2.07 | 2,664 | 2,792 | 2,956 | |||||||||||
| 2019 | Ordinary | 3.38 | 142 | 162 | 175 | |||||||||||
| 2020 | Ordinary | 3.32 | 351 | 386 | — | |||||||||||
| 2020 | Ordinary | 4.41 | 161 | 235 | — | |||||||||||
| 2021 | Ordinary | 7.18 | 543 | — | — | |||||||||||
|
|
|
|
|
|
|
|||||||||||
| 17,291 | 19,078 | 20,115 | ||||||||||||||
|
|
|
|
|
|
|
|||||||||||
The weighted average fair value of options granted during the year ended December 31, 2011, was determined using the Black-Scholes valuation model. The significant inputs into the model were:
| 2011 | 2010 | 2009 | ||||||||||
| Fair value of the options |
$ | 3.39 | $ | 1.70 | $ | 0.80 | ||||||
| Share price at grant date |
$ | 7.18 | $ | 3.72 | $ | 1.76 | ||||||
| Exercise price |
$ | 7.18 | $ | 3.72 | $ | 1.76 | ||||||
| Expected volatility |
60 | % | 53 | % | 48 | % | ||||||
| Expected life |
5 years | 6 years | 6 years | |||||||||
| Expected dividend yield |
1.5 | % | 1.5 | % | 1.2 | % | ||||||
| Risk-free rate of return |
2.3 | % | 2.8 | % | 2.8 | % | ||||||
The expected volatility is based on the weighted average of the Company’s historic volatility and its peer group historic volatility adjusted for any expected changes to future volatility. The peer group includes companies that are in the same or similar industries.
23
GlobeOp Financial Services S.A.
Notes to Consolidated Financial Statements
December 31, 2011, 2010 and 2009
The share-based compensation expense for stock options during 2011 was $2,447,000 (2010: $1,797,000; 2009: $2,253,000). The fair value of all options is recognized as an employee expense with a corresponding increase in equity.
Restricted Stock Units (“RSUs”)
The Company grants RSUs to certain Directors, management and employees. RSUs are generally granted depending on level of service, but may be based on length of service. The RSUs, which are nontradable, represent the right to receive ordinary shares and vest over three to four years and generally vest based on length of service. For certain grants made to senior level employees vesting is based on meeting certain performance conditions related to adjusted operating profit targets. The weighted average fair value of the awards are calculated using the fair value at the time the RSUs are granted. The Group has no obligation or intention to repurchase or settle the RSUs in cash.
Movement in the number of RSUs outstanding and their related fair values are as follows:
| 2011 | 2010 | 2009 | ||||||||||||||||||||||
| Weighted | Weighted | Weighted | ||||||||||||||||||||||
| Average | Average | Average | ||||||||||||||||||||||
| Fair Value | Number of | Fair Value | Number of | Fair Value | Number of | |||||||||||||||||||
| (in thousands, except per share data) | Per Share | RSUs | Per Share | RSUs | Per Share | RSUs | ||||||||||||||||||
| Outstanding at January 1, |
$ | 3.98 | 1,418 | $ | 3.60 | 444 | $ | 3.60 | 925 | |||||||||||||||
| Granted |
6.32 | 694 | 3.99 | 1,403 | — | — | ||||||||||||||||||
| Forfeited |
3.83 | (153 | ) | 4.01 | (23 | ) | 3.60 | (38 | ) | |||||||||||||||
| Vested |
3.84 | (104 | ) | 3.60 | (406 | ) | 3.60 | (443 | ) | |||||||||||||||
|
|
|
|
|
|
|
|
|
|
|
|
|
|||||||||||||
| Outstanding at December 31, |
$ | 4.88 | 1,855 | $ | 3.98 | 1,418 | $ | 3.60 | 444 | |||||||||||||||
|
|
|
|
|
|
|
|
|
|
|
|
|
|||||||||||||
The share-based compensation expense for RSUs during 2011 was $2,166,000 (2010: $1,163,000; 2009: $1,225,000). The fair value of all RSUs is recognized as an employee expense with a corresponding increase in equity.
| 11. | Finance Income (Costs), Net |
| Years Ended December 31, | ||||||||||||
| (in thousands) | 2011 | 2010 | 2009 | |||||||||
| Interest expense |
||||||||||||
| Provisions (Note 24) |
$ | (40 | ) | $ | (493 | ) | $ | (269 | ) | |||
| Other |
— | — | (12 | ) | ||||||||
|
|
|
|
|
|
|
|||||||
| (40 | ) | (493 | ) | (281 | ) | |||||||
| Interest income |
926 | 422 | 393 | |||||||||
|
|
|
|
|
|
|
|||||||
| Net total |
$ | 886 | $ | (71 | ) | $ | 112 | |||||
|
|
|
|
|
|
|
|||||||
24
GlobeOp Financial Services S.A.
Notes to Consolidated Financial Statements
December 31, 2011, 2010 and 2009
| 12. | Taxation |
Taxation for the year comprises current and deferred tax. Tax is recognized in the consolidated income statement except to the extent that it relates to items recognized directly in equity.
Current tax is the expected tax payable on the taxable income for the year using tax rates enacted or substantively enacted at the consolidated balance sheet date, and any adjustment to tax payable in respect of previous years.
| Years Ended December 31, | ||||||||||||
| (in thousands) | 2011 | 2010 | 2009 | |||||||||
| Corporation tax |
||||||||||||
| Charge (benefit) for the year |
$ | 13,347 | $ | 6,749 | $ | (3,316 | ) | |||||
| Adjustments for prior year |
(768 | ) | (474 | ) | (1,354 | ) | ||||||
|
|
|
|
|
|
|
|||||||
| Tax charge (benefit) |
12,579 | 6,275 | (4,670 | ) | ||||||||
|
|
|
|
|
|
|
|||||||
| Deferred tax |
||||||||||||
| Charge (benefit) for the year |
3,139 | 1,553 | (8,853 | ) | ||||||||
| Adjustments for prior year |
85 | 1,796 | 332 | |||||||||
|
|
|
|
|
|
|
|||||||
| Tax charge (benefit) (Note 17) |
3,224 | 3,349 | (8,521 | ) | ||||||||
|
|
|
|
|
|
|
|||||||
| $ | 15,803 | $ | 9,624 | $ | (13,191 | ) | ||||||
|
|
|
|
|
|
|
|||||||
| Years Ended December 31, | ||||||||||||
| (in thousands) | 2011 | 2010 | 2009 | |||||||||
| Reconciliation of tax charge (benefit) |
||||||||||||
| Profit (loss) before tax |
$ | 56,189 | $ | 43,370 | $ | (19,171 | ) | |||||
|
|
|
|
|
|
|
|||||||
| Tax calculated at statutory rate |
$ | 16,067 | $ | 12,414 | $ | (5,481 | ) | |||||
| Share-based compensation |
3,370 | (3,600 | ) | (1,661 | ) | |||||||
| State taxes, net of US federal benefit |
1,481 | 530 | (693 | ) | ||||||||
| Tax losses for which no deferred tax asset was recognized |
161 | 97 | 116 | |||||||||
| Decrease in tax reserves |
(524 | ) | (230 | ) | (191 | ) | ||||||
| Foreign taxes at rates different than statutory rates |
(3,832 | ) | (1,093 | ) | (4,120 | ) | ||||||
| Adjustments for prior year |
(683 | ) | 1,322 | (1,022 | ) | |||||||
| Other |
(237 | ) | 184 | (139 | ) | |||||||
|
|
|
|
|
|
|
|||||||
| $ | 15,803 | $ | 9,624 | $ | (13,191 | ) | ||||||
|
|
|
|
|
|
|
|||||||
In 2009, the adjustment for prior year primarily relates to a change in the method of apportioning revenues to tax authorities located in the United States of America. This method was adopted in 2009.
In 2010, the adjustment for prior year primarily relates to an error in deferred taxes, totalling $1,200,000, associated with income tax accounting for stock options.
As at December 31, 2011, 2010 and 2009 the statutory rate in Luxembourg was 28.6%.
As at December 31, 2011, 2010 and 2009 the United States federal and state blended tax rates enacted were 38%.
25
GlobeOp Financial Services S.A.
Notes to Consolidated Financial Statements
December 31, 2011, 2010 and 2009
All of the operations of GlobeOp Financial Services (India) Private Limited qualified as a 100% Export Oriented Software Technology Park Unit, under the Software Technology Parks program of the Ministry of Communication and Information Technology for development of software- and IT-enabled services in India. Therefore, the income of the Company was exempt from income tax for the year ended December 31, 2010 and through the tax period ended March 31, 2011. After this date some of the operations will still qualify for this tax exemption and some will be subject to an income tax rate of 32.5%. Beginning April 1, 2007, this subsidiary began paying a Minimum Alternate Tax (“MAT”). These payments were used in the year ended December 31, 2011 to partially offset tax liabilities. The amount of the remaining credit has been recorded as a deferred tax asset. In addition, deferred tax assets have been established for other expected future tax deductions.
| 13. | Earnings Per Share |
Basic
The B Beneficiary Certificates (Note 21) had all the same rights as the shares, except there were no voting rights attached to these Certificates. On March 7, 2011, these were converted into 12,202,825 ordinary shares. For purposes of both the basic and diluted earnings per share calculations, the weighted average number of Certificates is included in the weighted average number of shares in the tables below.
Basic earnings per share is calculated by dividing the profit attributable to equity holders of the Company by the weighted average number of shares in issue during the period.
| Years Ended December 31, | ||||||||||||
| (in thousands, except per share data) | 2011 | 2010 | 2009 | |||||||||
| Profit (loss) attributable to equity holders of the Company |
$ | 40,386 | $ | 33,746 | $ | (5,980 | ) | |||||
| Weighted average number of shares |
104,743 | 103,473 | 102,950 | |||||||||
| Basic earnings (loss) per share |
$ | 0.39 | $ | 0.33 | $ | (0.06 | ) | |||||
Diluted
Diluted earnings per share is calculated by adjusting the weighted average number of shares outstanding to assume conversion of all dilutive potential ordinary shares. The Company had two categories of dilutive potential ordinary shares: share options and restricted stock units.
For the share options and restricted stock units, a calculation is made in order to determine the number of shares that could have been acquired at fair value (determined as the average annual market share price of the shares) based on the monetary value of the subscription rights attached to the outstanding share options and restricted stock. The number of shares calculated as above is compared with the number of shares that would have been issued assuming the exercise of the share options and issuance of restricted stock.
| Years Ended December 31, | ||||||||||||
| (in thousands, except per share data) | 2011 | 2010 | 2009 | |||||||||
| Profit (loss) attributable to equity holders of the Company |
$ | 40,386 | $ | 33,746 | $ | (5,980 | ) | |||||
|
|
|
|
|
|
|
|||||||
| Weighted average number of shares |
104,743 | 103,473 | 102,950 | |||||||||
| Adjustments for Share options |
9,738 | 7,282 | — | |||||||||
| Restricted stock units |
877 | 321 | — | |||||||||
|
|
|
|
|
|
|
|||||||
| Weighted average number of shares for diluted earnings per share |
115,358 | 111,076 | 102,950 | |||||||||
|
|
|
|
|
|
|
|||||||
| Diluted earnings (loss) per share |
$ | 0.35 | $ | 0.30 | $ | (0.06 | ) | |||||
26
GlobeOp Financial Services S.A.
Notes to Consolidated Financial Statements
December 31, 2011, 2010 and 2009
| 14. | Dividends Per Share |
In 2011 the Company paid out dividends totaling $8,359,000 ($0.08 per share). In 2010 dividends paid were $3,691,000 ($0.04 per share). In 2009 dividends paid were $2,885,000 ($0.03 per share).
| 15. | Intangible Assets |
| Internally | ||||||||||||||||
| Software | Generated | |||||||||||||||
| (in thousands) | Goodwill | Licenses | Software | Total | ||||||||||||
| Cost |
||||||||||||||||
| Balances at January 1, 2011 |
$ | 3,182 | $ | 12,692 | $ | 6,240 | $ | 22,114 | ||||||||
| Exchange rate differences |
— | (162 | ) | (243 | ) | (405 | ) | |||||||||
| Disposals during the year |
— | (1,141 | ) | — | (1,141 | ) | ||||||||||
| Additions during the year |
— | 2,400 | 1,431 | 3,831 | ||||||||||||
|
|
|
|
|
|
|
|
|
|||||||||
| Balances as December 31, 2011 |
3,182 | 13,789 | 7,428 | 24,399 | ||||||||||||
|
|
|
|
|
|
|
|
|
|||||||||
| Accumulated amortization |
||||||||||||||||
| Balances at January 1, 2011 |
— | 9,955 | 5,081 | 15,036 | ||||||||||||
| Exchange rate differences |
— | (165 | ) | (216 | ) | (381 | ) | |||||||||
| Disposals during the year |
— | (1,141 | ) | — | (1,141 | ) | ||||||||||
| Charge for the year |
— | 2,063 | 904 | 2,967 | ||||||||||||
|
|
|
|
|
|
|
|
|
|||||||||
| Balances as December 31, 2011 |
— | 10,712 | 5,769 | 16,481 | ||||||||||||
|
|
|
|
|
|
|
|
|
|||||||||
| Net book value at December 31, 2011 |
$ | 3,182 | $ | 3,077 | $ | 1,659 | $ | 7,918 | ||||||||
|
|
|
|
|
|
|
|
|
|||||||||
| Internally | ||||||||||||||||
| Software | Generated | |||||||||||||||
| (in thousands) | Goodwill | Licenses | Software | Total | ||||||||||||
| Cost |
||||||||||||||||
| Balances at January 1, 2010 |
$ | 3,321 | $ | 13,115 | $ | 5,484 | $ | 21,920 | ||||||||
| Exchange rate differences |
(139 | ) | (252 | ) | (52 | ) | (443 | ) | ||||||||
| Disposals during the year |
— | (2,508 | ) | — | (2,508 | ) | ||||||||||
| Additions during the year |
— | 2,337 | 808 | 3,145 | ||||||||||||
|
|
|
|
|
|
|
|
|
|||||||||
| Balances as December 31, 2010 |
3,182 | 12,692 | 6,240 | 22,114 | ||||||||||||
|
|
|
|
|
|
|
|
|
|||||||||
| Accumulated amortization |
||||||||||||||||
| Balances at January 1, 2010 |
— | 10,506 | 4,365 | 14,871 | ||||||||||||
| Exchange rate differences |
— | (320 | ) | (49 | ) | (369 | ) | |||||||||
| Disposals during the year |
— | (2,508 | ) | — | (2,508 | ) | ||||||||||
| Charge for the year |
— | 2,277 | 765 | 3,042 | ||||||||||||
|
|
|
|
|
|
|
|
|
|||||||||
| Balances as December 31, 2010 |
— | 9,955 | 5,081 | 15,036 | ||||||||||||
|
|
|
|
|
|
|
|
|
|||||||||
| Net book value at December 31, 2010 |
$ | 3,182 | $ | 2,737 | $ | 1,159 | $ | 7,078 | ||||||||
|
|
|
|
|
|
|
|
|
|||||||||
27
GlobeOp Financial Services S.A.
Notes to Consolidated Financial Statements
December 31, 2011, 2010 and 2009
| Internally | ||||||||||||||||
| Software | Generated | |||||||||||||||
| (in thousands) | Goodwill | Licenses | Software | Total | ||||||||||||
| Cost |
||||||||||||||||
| Balances at January 1, 2009 |
$ | 2,986 | $ | 12,471 | $ | 4,599 | $ | 20,056 | ||||||||
| Exchange rate differences |
335 | 736 | 263 | 1,334 | ||||||||||||
| Disposals during the year |
— | (2,035 | ) | (101 | ) | (2,136 | ) | |||||||||
| Additions during the year |
— | 1,943 | 723 | 2,666 | ||||||||||||
|
|
|
|
|
|
|
|
|
|||||||||
| Balances as December 31, 2009 |
3,321 | 13,115 | 5,484 | 21,920 | ||||||||||||
|
|
|
|
|
|
|
|
|
|||||||||
| Accumulated amortization |
||||||||||||||||
| Balances at January 1, 2009 |
— | 9,643 | 3,472 | 13,115 | ||||||||||||
| Exchange rate differences |
— | 394 | 231 | 625 | ||||||||||||
| Disposals during the year |
— | (2,035 | ) | (101 | ) | (2,136 | ) | |||||||||
| Charge for the year |
— | 2,504 | 763 | 3,267 | ||||||||||||
|
|
|
|
|
|
|
|
|
|||||||||
| Balances as December 31, 2009 |
— | 10,506 | 4,365 | 14,871 | ||||||||||||
|
|
|
|
|
|
|
|
|
|||||||||
| Net book value at December 31, 2009 |
$ | 3,321 | $ | 2,609 | $ | 1,119 | $ | 7,049 | ||||||||
|
|
|
|
|
|
|
|
|
|||||||||
| 16. | Property, Plant and Equipment |
| Fixtures, | ||||||||||||||||||||
| Land and | Leasehold | Fittings, and | Capital Work | |||||||||||||||||
| (in thousands) | Buildings | Improvements | Equipment | in Progress | Total | |||||||||||||||
| Cost |
||||||||||||||||||||
| Balances at January 1, 2011 |
$ | 8,519 | $ | 21,177 | $ | 31,162 | $ | 1,496 | $ | 62,354 | ||||||||||
| Exchange rate differences |
— | (343 | ) | (749 | ) | — | (1,092 | ) | ||||||||||||
| Transfers during the year |
— | 1,324 | 157 | (1,481 | ) | — | ||||||||||||||
| Disposals during the year |
— | — | (668 | ) | — | (668 | ) | |||||||||||||
| Additions during the year |
— | 493 | 4,633 | 2,065 | 7,191 | |||||||||||||||
|
|
|
|
|
|
|
|
|
|
|
|||||||||||
| Balances at December 31, 2011 |
8,519 | 22,651 | 34,535 | 2,080 | 67,785 | |||||||||||||||
|
|
|
|
|
|
|
|
|
|
|
|||||||||||
| Accumulated depreciation |
||||||||||||||||||||
| Balances at January 1, 2011 |
661 | 6,628 | 27,482 | — | 34,771 | |||||||||||||||
| Exchange rate differences |
— | (195 | ) | (697 | ) | — | (892 | ) | ||||||||||||
| Disposals during the year |
— | — | (668 | ) | — | (668 | ) | |||||||||||||
| Charge for the year |
147 | 1,580 | 2,730 | — | 4,457 | |||||||||||||||
|
|
|
|
|
|
|
|
|
|
|
|||||||||||
| Balances at December 31, 2011 |
808 | 8,013 | 28,847 | — | 37,668 | |||||||||||||||
|
|
|
|
|
|
|
|
|
|
|
|||||||||||
| Net book value at December 31, 2011 |
$ | 7,711 | $ | 14,638 | $ | 5,688 | $ | 2,080 | $ | 30,117 | ||||||||||
|
|
|
|
|
|
|
|
|
|
|
|||||||||||
28
GlobeOp Financial Services S.A.
Notes to Consolidated Financial Statements
December 31, 2011, 2010 and 2009
| (in thousands) | Land and Buildings |
Leasehold Improvements |
Fixtures, Equipment |
Capital Work in Progress |
Total | |||||||||||||||
| Cost |
||||||||||||||||||||
| Balances at January 1, 2010 |
$ | 8,519 | $ | 21,019 | $ | 30,888 | $ | — | $ | 60,426 | ||||||||||
| Exchange rate differences |
— | 87 | 117 | — | 204 | |||||||||||||||
| Disposals during the year |
— | — | (1,823 | ) | — | (1,823 | ) | |||||||||||||
| Additions during the year |
— | 71 | 1,980 | 1,496 | 3,547 | |||||||||||||||
|
|
|
|
|
|
|
|
|
|
|
|||||||||||
| Balances at December 31, 2010 |
8,519 | 21,177 | 31,162 | 1,496 | 62,354 | |||||||||||||||
|
|
|
|
|
|
|
|
|
|
|
|||||||||||
| Accumulated depreciation |
||||||||||||||||||||
| Balances at January 1, 2010 |
514 | 5,239 | 26,391 | — | 32,144 | |||||||||||||||
| Exchange rate differences |
— | 37 | 100 | — | 137 | |||||||||||||||
| Disposals during the year |
— | — | (1,823 | ) | — | (1,823 | ) | |||||||||||||
| Charge for the year |
147 | 1,352 | 2,814 | — | 4,313 | |||||||||||||||
|
|
|
|
|
|
|
|
|
|
|
|||||||||||
| Balances at December 31, 2010 |
661 | 6,628 | 27,482 | — | 34,771 | |||||||||||||||
|
|
|
|
|
|
|
|
|
|
|
|||||||||||
| Net book value at December 31, 2010 |
$ | 7,858 | $ | 14,549 | $ | 3,680 | $ | 1,496 | $ | 27,583 | ||||||||||
|
|
|
|
|
|
|
|
|
|
|
|||||||||||
| (in thousands) | Land and Buildings |
Leasehold Improvements |
Fixtures, Equipment |
Capital Work in Progress |
Total | |||||||||||||||
| Cost |
||||||||||||||||||||
| Balances at January 1, 2009 |
$ | 8,519 | $ | 15,750 | $ | 29,131 | $ | 3,272 | $ | 56,672 | ||||||||||
| Exchange rate differences |
— | 65 | 286 | — | 351 | |||||||||||||||
| Transfers during the year |
— | 3,247 | 25 | (3,272 | ) | — | ||||||||||||||
| Disposals during the year |
— | (185 | ) | (133 | ) | — | (318 | ) | ||||||||||||
| Additions during the year |
— | 2,142 | 1,579 | — | 3,721 | |||||||||||||||
|
|
|
|
|
|
|
|
|
|
|
|||||||||||
| Balances at December 31, 2009 |
8,519 | 21,019 | 30,888 | — | 60,426 | |||||||||||||||
|
|
|
|
|
|
|
|
|
|
|
|||||||||||
| Accumulated depreciation |
||||||||||||||||||||
| Balances at January 1, 2009 |
398 | 4,170 | 22,173 | — | 26,741 | |||||||||||||||
| Exchange rate differences |
— | 36 | 259 | — | 295 | |||||||||||||||
| Disposals during the year |
— | (185 | ) | (133 | ) | — | (318 | ) | ||||||||||||
| Charge for the year |
116 | 1,218 | 4,092 | — | 5,426 | |||||||||||||||
|
|
|
|
|
|
|
|
|
|
|
|||||||||||
| Balances at December 31, 2009 |
514 | 5,239 | 26,391 | — | 32,144 | |||||||||||||||
|
|
|
|
|
|
|
|
|
|
|
|||||||||||
| Net book value at December 31, 2009 |
$ | 8,005 | $ | 15,780 | $ | 4,497 | $ | — | $ | 28,282 | ||||||||||
|
|
|
|
|
|
|
|
|
|
|
|||||||||||
During 2011, the Company began build-out of the new leased facility in Mumbai that was placed into use in early 2012. Capital work in progress represents the capital expenditure incurred as at December 31, 2011 for this project.
During 2010 the Company began refurbishing and enhancing the leased office space in New York City. The project completed during the first quarter of 2011. As a result, items classified as capital work in progress in 2010 were transferred to leasehold improvements and fixtures, fittings and equipment as appropriate.
29
GlobeOp Financial Services S.A.
Notes to Consolidated Financial Statements
December 31, 2011, 2010 and 2009
| 17. | Deferred Income Tax Assets (Liabilities) |
| December 31, | ||||||||
| (in thousands) | 2011 | 2010 | ||||||
| Share-based compensation |
$ | 7,435 | $ | 16,099 | ||||
| Minimum alternate tax |
1,889 | 2,373 | ||||||
| Capitalized assets |
(1,189 | ) | (122 | ) | ||||
| Rent expenses |
543 | 520 | ||||||
| Bad debt allowance |
407 | 199 | ||||||
| Other timing differences |
866 | 548 | ||||||
|
|
|
|
|
|||||
| $ | 9,951 | $ | 19,617 | |||||
|
|
|
|
|
|||||
The movement in deferred tax during each of the years presented is as follows:
| (in thousands) | January 1, 2011 |
Translation/ Equity Adjustment |
Recognized in Income |
December 31, 2011 |
||||||||||||
| Share-based compensation |
$ | 16,099 | $ | (5,968 | ) | $ | (2,696 | ) | $ | 7,435 | ||||||
| Minimum alternate tax |
2,373 | (299 | ) | (185 | ) | 1,889 | ||||||||||
| Capitalized assets |
(122 | ) | (65 | ) | (1,002 | ) | (1,189 | ) | ||||||||
| Rent expenses |
520 | (29 | ) | 52 | 543 | |||||||||||
| Bad debt allowance |
199 | — | 208 | 407 | ||||||||||||
| Other timing differences |
548 | (81 | ) | 399 | 866 | |||||||||||
|
|
|
|
|
|
|
|
|
|||||||||
| $ | 19,617 | $ | (6,442 | ) | $ | (3,224 | ) | $ | 9,951 | |||||||
|
|
|
|
|
|
|
|
|
|||||||||
| (in thousands) | January 1, 2010 |
Translation/ Equity Adjustment |
Recognized in Income |
December 31, 2010 |
||||||||||||
| Share-based compensation |
$ | 5,472 | $ | 7,501 | $ | 3,126 | $ | 16,099 | ||||||||
| Legal claim |
5,839 | — | (5,839 | ) | — | |||||||||||
| Minimum alternate tax |
1,503 | 76 | 794 | 2,373 | ||||||||||||
| Capitalized assets |
1,377 | (28 | ) | (1,471 | ) | (122 | ) | |||||||||
| Rent expenses |
519 | — | 1 | 520 | ||||||||||||
| Bad debt allowance |
159 | — | 40 | 199 | ||||||||||||
| Other timing differences |
548 | — | — | 548 | ||||||||||||
|
|
|
|
|
|
|
|
|
|||||||||
| $ | 15,417 | $ | 7,549 | $ | (3,349 | ) | $ | 19,617 | ||||||||
|
|
|
|
|
|
|
|
|
|||||||||
30
GlobeOp Financial Services S.A.
Notes to Consolidated Financial Statements
December 31, 2011, 2010 and 2009
| (in thousands) | January 1, 2009 |
Translation/ Equity Adjustment |
Recognized in Income |
December 31, 2009 |
||||||||||||
| Share-based compensation |
$ | 279 | $ | 2,661 | $ | 2,532 | $ | 5,472 | ||||||||
| Legal claim |
— | — | 5,839 | 5,839 | ||||||||||||
| Minimum alternate tax |
943 | 77 | 483 | 1,503 | ||||||||||||
| Capitalized assets |
1,798 | 58 | (479 | ) | 1,377 | |||||||||||
| Rent expenses |
484 | 6 | 29 | 519 | ||||||||||||
| Bad debt allowance |
144 | — | 15 | 159 | ||||||||||||
| Other timing differences |
436 | 10 | 102 | 548 | ||||||||||||
|
|
|
|
|
|
|
|
|
|||||||||
| $ | 4,084 | $ | 2,812 | $ | 8,521 | $ | 15,417 | |||||||||
|
|
|
|
|
|
|
|
|
|||||||||
In relation to share-based compensation, a deferred tax asset is recognized only when the share options have current intrinsic value that is deductible for tax purposes to the extent it is probable that taxable profit will be available against which these deductible temporary timing differences will be utilized. When the expected tax benefits from equity awards exceed the recorded cumulative recognized expense multiplied by the tax rate, the tax benefit up to the amount of the tax effect of the cumulative book compensation expense is recorded in the consolidated income statement; the excess is recorded in equity.
Deferred income tax assets are recognized for tax loss carry-forwards to the extent that the realization of the related tax benefit through future taxable profits is probable.
GlobeOp Financial Services S.A. had accumulated tax losses of $12,826,000 at December 31, 2011 (2010: $8,966,000; 2009: $6,949,000). These losses can be carried forward indefinitely. A deferred tax asset has not been recognized for these losses, as it is not probable that the entity will have future taxable profits to be used to offset this asset.
GlobeOp Financial Services (Ireland) Limited has accumulated tax losses of $1,143,000 at December 31, 2011 (2010: $2,105,000; 2009: $2,255,000). These losses can be carried forward indefinitely. A deferred tax asset has not been recognized for these losses, as it is not probable that the entity will have future taxable profits to be used to offset this asset.
No liability has been recognized in respect of temporary differences associated with investments in subsidiaries, where the Group is in a position to control the timing of the reversal of the temporary differences and it is probable that such differences will not reverse in the foreseeable future. With the exception of the subsidiaries located in the United Kingdom, at this time, the Company intends to re-invest all resources into its current local country operations and, therefore, has not recorded any deferred tax liabilities for such temporary differences. The aggregate amount of temporary differences associated with investments in subsidiaries for which a deferred tax liability has not been recognized during the year ended December 31, 2011 is $124,701,000 (2010: $91,449,000; 2009: $58,056,000). As a result, deferred tax liabilities up to $5,245,000 (2010: $8,833,000; 2009: $3,796,000) have not been recognized. The subsidiaries in the United Kingdom have remitted dividends to the Company. Under treaties between members of the EU, companies may remit dividends to their parent company and are not required to withhold any dividend-related tax. Consequently, no liability is required for the United Kingdom subsidiaries’ earnings.
31
GlobeOp Financial Services S.A.
Notes to Consolidated Financial Statements
December 31, 2011, 2010 and 2009
| 18. | Restricted Cash |
| December 31, | ||||||||
| (in thousands) | 2011 | 2010 | ||||||
| Monies held by the bank as security |
$ | 1,334 | $ | 1,338 | ||||
| Medium-term fixed deposits |
776 | 795 | ||||||
|
|
|
|
|
|||||
| $ | 2,110 | $ | 2,133 | |||||
|
|
|
|
|
|||||
Monies held by the bank as security relates to monies held by a bank as collateral for letters of credit issued due to lease requirements for office spaces.
Medium-term fixed deposits relates to monies held by a bank for a term greater than three months but less than one year.
| 19. | Accounts Receivable and Other Assets |
| December 31, | ||||||||
| (in thousands) | 2011 | 2010 | ||||||
| Noncurrent |
||||||||
| Deposits |
$ | 1,097 | $ | 841 | ||||
|
|
|
|
|
|||||
| $ | 1,097 | $ | 841 | |||||
|
|
|
|
|
|||||
| Current |
||||||||
| Accounts receivable |
$ | 12,185 | $ | 7,611 | ||||
| Less: Provision for impairment of receivables |
(323 | ) | (282 | ) | ||||
|
|
|
|
|
|||||
| Accounts receivable, net |
11,862 | 7,329 | ||||||
|
|
|
|
|
|||||
| Accrued income |
8,453 | 9,000 | ||||||
| Deposits |
91 | 75 | ||||||
| Prepaid expenses |
4,773 | 3,962 | ||||||
| Other receivables |
2,485 | 781 | ||||||
|
|
|
|
|
|||||
| 15,802 | 13,818 | |||||||
|
|
|
|
|
|||||
| $ | 27,664 | $ | 21,147 | |||||
|
|
|
|
|
|||||
The fair value of the accounts receivable and other assets is as recorded above. All noncurrent assets are due within ten years of the consolidated balance sheet date.
Accounts receivable that are outstanding less than one month are not considered past due. As at December 31, 2011 and 2010, accounts receivable of $1,057,000 and $1,059,000 were past due, of which the impairment provision was $323,000 and $282,000, respectively.
32
GlobeOp Financial Services S.A.
Notes to Consolidated Financial Statements
December 31, 2011, 2010 and 2009
The aging analysis of these past due accounts receivable is as follows:
| December 31, | ||||||||
| (in thousands) | 2011 | 2010 | ||||||
| Over one month but less than two months |
$ | 770 | $ | 576 | ||||
| Over two months |
287 | 483 | ||||||
|
|
|
|
|
|||||
| $ | 1,057 | $ | 1,059 | |||||
|
|
|
|
|
|||||
The carrying amounts of the Group’s accounts receivable, net, are denominated in the following currencies:
| December 31, | ||||||||
| (in thousands) | 2011 | 2010 | ||||||
| US Dollar |
$ | 10,635 | $ | 5,873 | ||||
| Pound Sterling |
884 | 253 | ||||||
| Euro |
343 | 1,203 | ||||||
|
|
|
|
|
|||||
| $ | 11,862 | $ | 7,329 | |||||
|
|
|
|
|
|||||
Movements in the provision for impairment of accounts receivable are as follows:
| December 31, | ||||||||||||
| (in thousands) | 2011 | 2010 | 2009 | |||||||||
| Balances at January 1 |
$ | 282 | $ | 280 | $ | 977 | ||||||
| Unused amounts reversed |
(54 | ) | (68 | ) | (137 | ) | ||||||
| Utilized during the period |
(77 | ) | (152 | ) | (662 | ) | ||||||
| Provision for impairment of receivables |
172 | 222 | 102 | |||||||||
|
|
|
|
|
|
|
|||||||
| Balances at December 31 |
$ | 323 | $ | 282 | $ | 280 | ||||||
|
|
|
|
|
|
|
|||||||
The movement of the provision for impaired receivables has been included within operating expenses in the consolidated income statement.
The unused amounts reversed relate to amounts that have been received after being provided for in a prior year.
The other classes within accounts receivable and other assets do not contain impaired assets. The maximum exposure to credit risk at the reporting date is the carrying value of each class of receivable mentioned above. The Group does not hold any collateral.
The rental deposits relate to amounts held in escrow as security deposits against the future rentals payable in relation to the leases of the office premises used by the Group. The deposits are interest-bearing at the holding banks’ standard rates on interest-bearing deposit accounts. The deposits are repayable to the Group at the end of the lease terms.
33
GlobeOp Financial Services S.A.
Notes to Consolidated Financial Statements
December 31, 2011, 2010 and 2009
| 20. | Cash and Cash Equivalents |
| December 31, | ||||||||
| (in thousands) | 2011 | 2010 | ||||||
| Cash at bank |
$ | 106,771 | $ | 73,343 | ||||
|
|
|
|
|
|||||
| $ | 106,771 | $ | 73,343 | |||||
|
|
|
|
|
|||||
| 21. | Share Capital and Treasury Shares |
Share Capital
| December 31, | ||||||||
| (in thousands) | 2011 | 2010 | ||||||
| Authorized |
||||||||
| 200,000,000 Ordinary shares – par value of $0.12 each |
$ | 24,000 | $ | 24,000 | ||||
|
|
|
|
|
|||||
| $ | 24,000 | $ | 24,000 | |||||
|
|
|
|
|
|||||
| Allotted, issued and fully paid |
||||||||
| 105,647,905 (2010 – 91,638,154; 2009 – 91,334,410) Ordinary shares – par value of $0.12 each |
$ | 12,678 | $ | 10,996 | ||||
|
|
|
|
|
|||||
| $ | 12,678 | $ | 10,996 | |||||
|
|
|
|
|
|||||
All shares rank equally for voting rights in general meeting and dividend rights.
B Beneficiary Certificates
On June 6, 2007, the Group’s Shareholders approved an exchange for, and issue to certain institutional Shareholders of, 12,202,825 nonvoting beneficiary certificates (parts bénéficiaires), namely B Beneficiary Certificates, with a par value of $0.12 each, against 12,202,825 ordinary shares which was a noncash transaction.
On March 7, 2011, upon the request from certain shareholders, the Company converted 12,202,825 B Beneficiary Certificates into ordinary shares.
Share Repurchase Plans
On April 5, 2010, the Board of Directors approved a share repurchase plan to make market purchases of up to 250,000 shares, up to a maximum expenditure of £725,000, during the period up to April 26, 2010. The purchases were made in the normal course of business in the open market and the ordinary shares were not cancelled but were held in treasury for delivery in connection with the Company’s equity incentive and option plan schemes. During this period, the Group had repurchased 250,000 ordinary shares for $1,097,000 (£714,000).
34
GlobeOp Financial Services S.A.
Notes to Consolidated Financial Statements
December 31, 2011, 2010 and 2009
On April 27, 2010, the Board of Directors approved a share repurchase plan. This plan authorizes the Group to make market purchases of up to an aggregate cost of £3,500,000 of its ordinary shares up until the annual general meeting of Shareholders in 2011. The purchases were made in the normal course of business in the open market and the ordinary shares were not cancelled but were held in treasury for delivery in connection with the Company’s equity incentive and option plan schemes. During 2010, the Group had repurchased 701,500 ordinary shares under this plan for a total of $2,730,000 (£1,822,000). During the period from January 1, 2011 to March 16, 2011, the Group had repurchased 300,500 ordinary shares under this plan for a total of $2,003,000 (£1,248,000).
As noted below, 300,500 of these repurchased shares were utilized during 2011 (2010: 1,214,581; 2009: 693,750) in connection with the Company’s equity incentive and option plan schemes. As at December 31, 2011 and 2010, the Company held nil shares in treasury (2009: 263,081).
On April 27, 2011, the Board of Directors approved a share repurchase plan. This plan authorized the Group to make market purchases of up to an aggregate cost of £3,000,000 of its ordinary shares up until the Annual General Meeting of Shareholders in 2012. No purchases have been made to date under this plan.
Shares to be Issued Reserve
The shares to be issued reserve represents shares to be issued under various share option plans operated by the Group. The Company issued 600,000 new ordinary shares to fund the programs of which 490,886 of these issued shares were utilized during 2011. At December 31, 2011, the Company held 109,114 shares to be issued under various share option plans.
Share Option Exercises and Restricted Stock Vesting
During 2011, a total of 1,894,062 share options were exercised resulting in a total subscription price of $4,084,000 of which $191,000 was allocated to share capital, $36,000 was allocated to treasury shares and the remaining $3,857,000 was allocated to the share premium account. The Company met its obligation by assigning 300,500 ordinary shares from treasury and by increasing the Company’s share capital by issuing 1,593,562 new ordinary shares. 424,136 of these new ordinary shares were issued from the share premium.
During 2010, a total of 1,112,075 options were exercised resulting in a total subscription price of $1,658,000 of which $1,525,000 was allocated to share premium, $31,000 was allocated to share capital, and the remainder of $102,000 was allocated to treasury shares. The Company met its obligation by assigning 850,833 ordinary shares from treasury and by increasing the Company’s share capital by issuing 261,242 new ordinary shares.
In 2011, a total of 104,250 restricted stock units vested under the 2006 Equity Incentive Plan. The Company met their obligation by increasing the Company’s share capital by issuing 104,250 new ordinary shares. 66,750 of these new ordinary shares were issued from the share premium.
In 2010, a total of 406,250 restricted stock units vested under the 2006 Equity Incentive Plan. The Company met their obligation by assigning 363,747 ordinary shares from treasury and by increasing the Company’s share capital by issuing 42,503 new ordinary shares.
35
GlobeOp Financial Services S.A.
Notes to Consolidated Financial Statements
December 31, 2011, 2010 and 2009
| 22. | Other Reserves |
Other reserves consist of shares to be issued, a reserve for treasury shares, a legal reserve, and the cumulative translation adjustment. In 2010, other reserves also included B Beneficiary Certificates. None of these reserves are distributable.
Under Luxembourg law, the Company is required, in the following year subject to the approval of the Shareholders, to transfer to a legal reserve a minimum of 5% of its net profits, as defined, each year. This requirement ceases to be necessary once the balance on the legal reserve reaches 10% of the issued share capital.
In 2012, upon approval of the Shareholders, $168,000 (2011: $481,000) will be allocated to the legal reserve as the Company had net profits during 2011.
Under Luxembourg law, the Company is required to set up a reserve for treasury shares equal to the amount of the treasury shares purchased.
The shares to be issued reserve contains the cumulative employee share options and restricted stock compensation expense related to the share–based compensation (Note 10).
| 23. | Borrowings |
The Company had a $30,000,000 revolving credit facility, a letter of credit line of $2,000,000 and a working capital facility of £1,075,000 with the Bank of Scotland. The term of the letter of credit line ran parallel with that of the revolving credit facility that expired on March 7, 2011. The Company did not renew these facilities.
The annual rate of interest was 1.5% above USD LIBOR for the drawdown period, payable at the end of each drawdown period. A nonutilization fee of 0.5% was due quarterly by the Company. The nonutilization fee amounted to $25,000 and is recorded in the consolidated income statement within operating expenses (2010: $150,000; 2009: $150,000).
As at December 31, 2011 and 2010, the Company had no amounts outstanding with Bank of Scotland and no borrowing costs have been capitalized during the years ended December 31, 2011, 2010 and 2009.
| 24. | Provisions for Liabilities and Charges |
| December 31, | ||||||||
| (in thousands) | 2011 | 2010 | ||||||
| Noncurrent |
$ | 2,938 | $ | 2,828 | ||||
| Current |
— | 9 | ||||||
|
|
|
|
|
|||||
| $ | 2,938 | $ | 2,837 | |||||
|
|
|
|
|
|||||
36
GlobeOp Financial Services S.A.
Notes to Consolidated Financial Statements
December 31, 2011, 2010 and 2009
| (in thousands) | Dilapidations | Claims | Tax Matters |
Other | Total | |||||||||||||||
| Balances at January 1, 2009 |
$ | 2,103 | $ | 3,600 | $ | 616 | $ | — | $ | 6,319 | ||||||||||
| Additional provisions |
— | 43,500 | — | 1,550 | 45,050 | |||||||||||||||
| Reduction in provisions |
||||||||||||||||||||
| Credited to income statement |
(13 | ) | — | (77 | ) | (7 | ) | (97 | ) | |||||||||||
| Utilized during the period |
— | (30,600 | ) | (34 | ) | (1,543 | ) | (32,177 | ) | |||||||||||
| Unwinding of discount |
(8 | ) | — | — | — | (8 | ) | |||||||||||||
| Interest expense |
123 | 249 | — | — | 372 | |||||||||||||||
| Exchange differences |
193 | — | — | — | 193 | |||||||||||||||
|
|
|
|
|
|
|
|
|
|
|
|||||||||||
| Balances at December 31, 2009 |
2,398 | 16,749 | 505 | — | 19,652 | |||||||||||||||
| Reduction in provisions |
||||||||||||||||||||
| Utilized during the period |
— | (17,232 | ) | — | — | (17,232 | ) | |||||||||||||
| Unwinding of discount |
113 | — | — | — | 113 | |||||||||||||||
| Interest expense |
108 | 492 | (220 | ) | — | 380 | ||||||||||||||
| Exchange differences |
(76 | ) | — | — | — | (76 | ) | |||||||||||||
|
|
|
|
|
|
|
|
|
|
|
|||||||||||
| Balances at December 31, 2010 |
2,543 | 9 | 285 | — | 2,837 | |||||||||||||||
| Additional provisions |
94 | — | — | — | 94 | |||||||||||||||
| Reduction in provisions |
||||||||||||||||||||
| Utilized during the period |
— | (9 | ) | — | — | (9 | ) | |||||||||||||
| Unwinding of discount |
109 | — | — | — | 109 | |||||||||||||||
| Interest expense |
112 | — | (181 | ) | — | (69 | ) | |||||||||||||
| Exchange differences |
(24 | ) | — | — | — | (24 | ) | |||||||||||||
|
|
|
|
|
|
|
|
|
|
|
|||||||||||
| Balances at December 31, 2011 |
$ | 2,834 | $ | — | $ | 104 | $ | — | $ | 2,938 | ||||||||||
|
|
|
|
|
|
|
|
|
|
|
|||||||||||
The provision for dilapidations relates to dilapidation obligations under various leases for office space in London, Dublin, Mumbai, New York City and Hartford, Connecticut. The balances are expected to be utilized when the current leases expire between 2013 and 2021.
The Group recognizes provisions for potential claims where it has a present legal or constructive obligation, it is probable that an outflow of resources will be required to settle the obligation and the amount can be reasonably estimated.
| 25. | Deferred Lease Obligations |
Lease payments under an operating lease are recognized as an expense on a straight-line basis over the term of the lease. The Group leases various office premises under operating leases. Included within several lease agreements are several favorable terms provided by the landlord to the Group as an incentive to enter into the agreement. These include rent-free periods and reimbursements from the landlord towards the costs incurred by the Group for building improvements to leased office space. All incentives within an operating lease are recognized as part of the net consideration of the lease and are expensed over the term of the lease.
When the rental expense is greater than the cash paid, the Group recognizes a liability for the differential. When the cash paid becomes greater than the expense, the liability previously recognized is reduced. Reductions to the liability that are due within one year of the consolidated balance sheet date are recognized as current liabilities and are included in accrued payables within trade and other payables. Reductions that are due after one year are included in deferred lease obligations with noncurrent liabilities.
37
GlobeOp Financial Services S.A.
Notes to Consolidated Financial Statements
December 31, 2011, 2010 and 2009
| 26. | Trade and Other Payables |
| December 31, | ||||||||
| (in thousands) | 2011 | 2010 | ||||||
| Noncurrent |
||||||||
| Other employee benefits |
$ | 1,140 | $ | 1,032 | ||||
|
|
|
|
|
|||||
| $ | 1,140 | $ | 1,032 | |||||
|
|
|
|
|
|||||
| Current |
||||||||
| Trade payables |
$ | 3,667 | $ | 3,081 | ||||
| Bonuses and other employee benefits |
16,777 | 13,404 | ||||||
| Accrued payables |
8,835 | 6,289 | ||||||
| Social security payable and other taxes |
4,919 | 3,467 | ||||||
| Deferred revenue |
1,543 | 1,261 | ||||||
|
|
|
|
|
|||||
| $ | 35,741 | $ | 27,502 | |||||
|
|
|
|
|
|||||
| 27. | Contingent Liabilities |
The Group faces substantial litigation risk from and through its clients and otherwise in the ordinary course of its business. As a service provider, the Group is subject to actual and potential claims from its clients, some of whom pursue relatively high-risk investment strategies, and all of whom are subject to substantial market risk. The losses of some of its clients due to insolvency or fraud on the part of the funds or others could expose, and have already exposed, the Group to litigation. For example, funds, their managers or their investors might attempt to seek compensation from the Group and or its clients. The Group may also be subject to claims for losses or other damages from its clients’ investors, as well as claims such as those from regulators, revenue authorities or other governmental authorities. Even if the Group is not ultimately found to be liable, defending such claims or lawsuits could be expensive and time-consuming, divert management resources and harm the Group’s reputation.
The Group takes steps to minimize the risks from litigation in managing its business but there can be no assurance that these steps will be adequate or that liability will not result notwithstanding those actions.
The Group was named as a defendant in an action (the “Anwar Action”) pending in the United States District Court for the Southern District of New York as a putative class action against multiple defendants, relating to Greenwich Sentry L.P. and Greenwich Sentry Partners L.P. (the “FG Funds”) and the FG Funds’ losses as a result of their investments managed by Bernard Madoff. The complaint alleges breach of fiduciary duties by the Group and negligence in the performance of its duties. Motions to dismiss were filed by all parties to the action, including on behalf of the Company. The judge dismissed one allegation regarding gross negligence against the Company but denied the remainder of the motion to dismiss. The group has filed a motion to deny class certification and the ruling on that motion has not yet been rendered. Merits discovery among the plaintiffs, the Company and the co-defendants is ongoing. The Group believes it has complied with the terms of its service agreements with the FG Funds and that it does not have any fiduciary obligations relating to the FG Funds or its investors, and therefore intends to defend this matter vigorously.
38
GlobeOp Financial Services S.A.
Notes to Consolidated Financial Statements
December 31, 2011, 2010 and 2009
The Group was named as a defendant in two actions (the “Pierce and Ferber Actions”) filed in New York State Supreme Court brought by investors in the FG Funds as derivative actions relating to the same losses alleged in the Anwar Action. On November 9, 2009, the Court in the Pierce and Ferber Actions granted the Group’s motion to compel arbitration based on the dispute resolution clause contained in the services agreements with the FG Funds. The plaintiffs had filed a notice of intent to appeal the ruling but allowed the deadline to perfect the appeal to pass without further action. Neither mediation nor arbitration proceedings have been commenced. The FG Funds had filed for bankruptcy and plans of reorganization were approved by the Bankruptcy Court in December 2011. In connection with the plans, a litigation trustee was appointed to pursue causes of action that previously belonged to the FG Funds. As a part of the approval of the bankruptcy plan of the Funds, a litigation trustee was appointed by the bankruptcy court. The litigation trustee has since amended the complaints to replace Pierce and Ferber as the plaintiff in the derivative actions. The Group maintains that the prior arbitration orders entered in the Pierce and Ferber Actions continue to apply to the litigation trustee. The litigation trustee has neither sought a ruling on the arbitration issue nor commenced a mediation or arbitration. The Group believes it has complied with the terms of its service agreements with the FG Funds and that it does not have any fiduciary obligations relating to the FG Funds or its investors. If a mediation or arbitration is commenced, the Group intends to defend these matters vigorously.
The Group served as administrator for the Greenwich Sentry Fund from October 2003 through August 2006 and for the Greenwich Sentry Partners Fund from May 2006 through August 2006, during which time the net asset value of the Greenwich Sentry Fund was $135 million and the Greenwich Sentry Partners Fund was $6 million. The Group’s insurance policy for that time period is not available to cover these matters. However, during 2011 the Company secured up to $10 million in insurance coverage for these matters pursuant to an interim drop down agreement, which can be terminated by either party upon 30 days’ notice. As a result, the Company was reimbursed $1.2 million for litigation expenses incurred in 2011. While the Group believes it will prevail, it is not possible to predict the timing or the ultimate outcome of any litigation.
In addition, several actions (the “Millennium Actions”) have been filed in various jurisdictions or threatened naming the Group as a defendant in respect of claims arising out of valuation agent services performed by the Group related to the Millennium Global Emerging Credit Fund L.P. and Millennium Global Emerging Fund Ltd. (the “Millennium Funds”), including an arbitration proceeding in the United Kingdom on behalf of the Millennium Funds’ investment manager with a yet-to-be-determined claimed amount, a threatened arbitration proceeding in the United Kingdom involving the liquidator on behalf of the Millennium Funds in an amount yet-to-be-determined, and a putative class action in U.S. District Court for the Southern District of New York on behalf of investors in the Millennium Funds asserting claims of $844 million, which is alleged to be the full amount of assets under management by the Millennium Funds at the funds’ peak valuation. These actions arise out of the same set of facts and circumstances described in the criminal and civil complaints filed by the U.S. Department of Justice and U.S. Securities and Exchange Commission, respectively, against the portfolio manager of the Millennium Funds’ investment manager. The Group has concluded that any obligation in these matters is remote.
We believe that the Group has strong defenses to the Fairfield Greenwich Actions and the Millennium Actions, and we are vigorously contesting these matters.
39
GlobeOp Financial Services S.A.
Notes to Consolidated Financial Statements
December 31, 2011, 2010 and 2009
The Group has not recorded a provision in relation to the litigation described above or other outstanding claims, based on advice from outside legal counsel and the Company’s own assessment of the likelihood that there will not be a material outflow of resources for the Group. There can be no assurance that any such provisions will not be recorded in the future nor that any such provisions will be adequate to satisfy any liability which the Group may ultimately incur. Should developments in any such matters cause a change in the Group’s assessment of a matter and result in the need to recognize a provision or disclose a matter in accordance with IFRS standards, or should any such matters result in a final judgment or be settled, they could have an adverse effect on the results of operations, cash flows and financial position in the period or periods in which such change in assessment, judgment or settlement occurs. If the Group does incur liability in relation to any claims or lawsuits, such liability may not be covered by insurance or could exceed the Group’s insurance coverage. In addition, the Group’s service agreements with its clients generally provide for resolving disputes through mediation and arbitration. Such alternative dispute resolution procedures may result in less predictable and or less favorable outcomes than court litigation.
On occasion, in the normal course of business, disputes occur between the Group and its vendors. Currently there is a claim against the Group by a former vendor for approximately $700,000. The Group believes it has adequately provided for this item.
| 28. | Operating Lease Commitments |
The Group’s leased premises, located in the United Kingdom, the United States of America, India, the Cayman Islands, and the Republic of Ireland are leased under noncancelable operating lease agreements. The leases have varying terms, escalation clauses and renewal rights.
The future aggregate minimum lease payments under noncancelable operating leases are as follows:
| December 31, | ||||||||
| (in thousands) | 2011 | 2010 | ||||||
| Minimum annual rentals |
||||||||
| Not later than one year |
$ | 5,401 | $ | 5,139 | ||||
| Later than one year and not later than five years |
21,430 | 18,074 | ||||||
| Later than five years |
6,407 | 5,907 | ||||||
|
|
|
|
|
|||||
| $ | 33,238 | $ | 29,120 | |||||
|
|
|
|
|
|||||
As at December 31, 2011, the Group had $4,454,000 (2010: $2,804,000) of commitments under computer software and support contracts of which $3,629,000 (2010: $2,804,000) is due within one year. The balance at December 31, 2011 of $825,000 is due in more than one year but less than two years.
| 29. | Related-Party Transactions |
All inter-company transactions, balances and unrealized gains on transactions between Group companies are eliminated; unrealized losses are also eliminated unless costs cannot be recovered. Accounting policies of subsidiaries have been changed where necessary to ensure consistency with the policies of the Group.
The Company has related-party relationships with its subsidiaries (which are eliminated) and with its Directors and members of key management in the form of remuneration. There are no transactions with related parties who are not members of the Group.
40
GlobeOp Financial Services S.A.
Notes to Consolidated Financial Statements
December 31, 2011, 2010 and 2009
The following transactions were carried out with related parties:
Key Management Compensation
| Years Ended December 31, | ||||||||||||
| (in thousands) | 2011 | 2010 | 2009 | |||||||||
| Salaries and other short-term employee benefits |
$ | 1,407 | $ | 1,355 | $ | 1,658 | ||||||
| Termination benefits |
— | — | 67 | |||||||||
| Share-based compensation |
339 | 245 | 685 | |||||||||
|
|
|
|
|
|
|
|||||||
| $ | 1,746 | $ | 1,600 | $ | 2,410 | |||||||
|
|
|
|
|
|
|
|||||||
The Group does not have a policy on termination benefits but from time to time can include certain termination provisions in senior management employment contracts.
Directors
| Years Ended December 31, | ||||||||||||
| (in thousands) | 2011 | 2010 | 2009 | |||||||||
| Aggregate emoluments |
$ | 4,083 | $ | 3,568 | $ | 1,093 | ||||||
| Aggregate amounts payable under long-term incentive plans |
1,060 | 820 | 671 | |||||||||
| Company contributions to defined-contribution plans |
23 | 29 | 15 | |||||||||
|
|
|
|
|
|
|
|||||||
| $ | 5,166 | $ | 4,417 | $ | 1,779 | |||||||
|
|
|
|
|
|
|
|||||||
Refer to the Remuneration Report of the Board of Directors for further details of remuneration of Directors employed by the Group.
| 30. | Post-Balance Sheet Events |
On May 31, 2012 SS&C Technologies Holdings, Inc. through its indirect wholly owned subsidiary, SS&C Technologies Holdings Europe S.a.r.l. (“Bidco”), declared its offer to acquire all of the outstanding share capital of GlobeOp Financial Services S.A. wholly unconditional and gained control of the Group, replaced certain members of the board of directors of GlobeOp and subsequently acquired all of the outstanding share capital of GlobeOp pursuant to the terms of its offer of £4.85 per outstanding share (the “Acquisition”). GlobeOp Financial Services S.A. became a subsidiary of Bidco and its shares no longer trade on the London Stock Exchange.
In connection with the Acquisition an offer was made to the holders of the outstanding share options and restricted share units to be purchased by Bidco or exercised, with the resultant common shares being purchased by Bidco. These offers provided for the acceleration of vesting of 363,878 share options and 3,563,668 restricted share units. In connection with the offer all remaining outstanding unvested share options and restricted share units were cancelled. The amount paid to option holders was £4.85 less the exercise price of the option per underlying common share and the RSU holders were paid £4.85 for each vested unit (after the acceleration).
The Company incurred $19,662,000 of transaction fees and expenses associated with the transaction.
41
GlobeOp Financial Services S.A.
Notes to Consolidated Financial Statements
December 31, 2011, 2010 and 2009
| 31. | Reconciliation to Accounting Principles Generally Accepted in the United States of America |
The consolidated financial statements, included herein have been prepared and presented in accordance with IFRS as endorsed by the EU (“IFRS-EU”). IFRS-EU varies in certain significant respects from accounting principles generally accepted in the United States of America (“US GAAP”). The matters described below summarize significant differences between IFRS-EU and US GAAP, which have also been reconciled to US GAAP below. The statements of cash flows have been prepared in accordance with International Accounting Standard No. 7, as amended in October 1992.
The principal differences between IFRS-EU and US GAAP that affect the Company’s financial statements relates to the treatment of revenue recognized for certain of the Company’s services provided to certain customers, accounting for the affects of exercises and the related income tax windfalls (shortfalls), deferred income taxes and the timing of recognition for the employer portion of national insurance contributions (“NIC”) related to the Company’s share options and the treatment and classification of certain other deferred income taxes.
Revenue Recognition
Under US GAAP revenue for services rendered is recognized when the services have been provided and when persuasive evidence of an arrangement exists, the price is fixed or determinable and collectibility is reasonably assured. Under IFRS-EU revenue is recognized pursuant to the accounting policy included in Note 2 to these financial statements. Given that the IFRS-EU principles do not require a specific form of evidence of an arrangement as a requirement to recognize revenue, certain revenue was recognized for certain customers before the contractual arrangement was executed by the Company and/or the customer. Under US GAAP the revenue has been deferred until such time as the final form of the contractual arrangement was executed by the customers and obtained and executed by the Company thus providing the necessary evidence of an arrangement, or in certain cases when the Company determined that no continuing obligations to the customer existed. The reconciling items have the effect of modifying the timing of the revenue recognition and the cumulative revenue expected to be recognized for each customer/contract remains unchanged.
Accounting for Share Options
Under US GAAP, the deferred income tax assets with regard to share options are generally recognized as the Company records book compensation expense based on the grant date fair value of the share options. The deferred taxes established for awards are generally reversed upon the exercise of the award and the excess tax deduction (based on the intrinsic value of the award at exercise) is recorded as an income tax windfall to shareholders’ equity and any tax deduction that is less than the deferred tax asset that had been recorded is recorded as an income tax shortfall to shareholders’ equity to the extent of previous windfalls that were accumulated and then as a component of the income tax charge once all previous windfalls recorded within shareholder’s equity have been reversed.
Under IFRS-EU, a deferred tax asset is recognized only when the share options have current intrinsic value at the end of each reporting period that is deductible for tax purposes to the extent it is probable that taxable profit will be available against which these deductible temporary differences will be utilized. When the expected tax benefits from equity awards exceed the recorded cumulative recognized expense multiplied by the tax rate, the tax benefit up to the amount of the tax effect of the cumulative book compensation expense is recorded in the income statement; the excess (windfall) is recorded in shareholders’ equity. The reconciling items have the effect of reflecting the windfalls (shortfalls) and deferred income taxes in accordance with US GAAP. The adjustments to shareholders’ equity are reflected within other reserves in the table below.
42
GlobeOp Financial Services S.A.
Notes to Consolidated Financial Statements
December 31, 2011, 2010 and 2009
In addition, in accordance with IFRS-EU, the Company accrues NIC (social charges) on stock-based compensation expense during the expense attribution period. Provisions are adjusted for movements in share price given that the contributions are paid on the intrinsic value at the time of exercise. Under US GAAP, no social charges are recorded until the options are exercised or matching of shares takes place, which increases net income for each period presented as shown in the table below.
Deferred Income Taxes (Other Than With Regard to Share Options as Described Above)
Under US GAAP the deferred tax is calculated on the US GAAP adjustments and the US GAAP balance sheet disclosure reflects the gross recognition of any valuation allowance and the current and noncurrent classification of deferred tax assets and liabilities on the balance sheet under US GAAP.
Application of US GAAP as described above would have had the following effects on consolidated net income.
Adjustments to Net Income
| (in thousands) | 2011 | 2010 | 2009 | |||||||||
| Net income (loss) per IFRS-EU |
$ | 40,386 | $ | 33,746 | $ | (5,980 | ) | |||||
| US GAAP adjustments |
||||||||||||
| Revenue recognition |
97 | (233 | ) | 782 | ||||||||
| NIC related to share options |
122 | 246 | 133 | |||||||||
| Deferred income taxes related to share options |
1,397 | (3,039 | ) | (2,268 | ) | |||||||
| Tax effects of US GAAP adjustments |
(36 | ) | (7 | ) | (332 | ) | ||||||
|
|
|
|
|
|
|
|||||||
| Net income (loss) according to US GAAP |
$ | 41,966 | $ | 30,713 | $ | (7,665 | ) | |||||
|
|
|
|
|
|
|
|||||||
Comprehensive Income
| (in thousands) | 2011 | 2010 | 2009 | |||||||||
| Net income (loss) according to US GAAP |
$ | 41,966 | $ | 30,713 | $ | (7,665 | ) | |||||
| Other comprehensive (loss) income |
||||||||||||
| Cumulative translation adjustment |
(5,072 | ) | (357 | ) | 2,195 | |||||||
|
|
|
|
|
|
|
|||||||
| Comprehensive income according to US GAAP |
$ | 36,894 | $ | 30,356 | $ | (5,470 | ) | |||||
|
|
|
|
|
|
|
|||||||
43
GlobeOp Financial Services S.A.
Notes to Consolidated Financial Statements
December 31, 2011, 2010 and 2009
Earnings Per Share in Accordance With US GAAP
| (in thousands, except per share data) | 2011 | 2010 | 2009 | |||||||||
| Net income (loss)—US GAAP |
$ | 41,966 | $ | 30,713 | $ | (7,665 | ) | |||||
|
|
|
|
|
|
|
|||||||
| Weighted average shares outstanding (in thousands) |
||||||||||||
| Weighted average shares outstanding IFRS-EU—basic |
104,743 | 103,473 | 102,950 | |||||||||
| Adjustment |
— | — | — | |||||||||
|
|
|
|
|
|
|
|||||||
| Weighted average shares outstanding US GAAP—basic |
104,743 | 103,473 | 102,950 | |||||||||
|
|
|
|
|
|
|
|||||||
| Weighted average shares outstanding IFRS-EU—diluted |
115,358 | 111,076 | 102,950 | |||||||||
| Adjustment |
(2,182 | ) | (229 | ) | — | |||||||
|
|
|
|
|
|
|
|||||||
| Weighted average shares outstanding US GAAP—diluted |
113,176 | 110,847 | 102,950 | |||||||||
|
|
|
|
|
|
|
|||||||
| Earnings per share |
||||||||||||
| Basic earnings (loss) per share—US GAAP |
$ | 0.40 | $ | 0.30 | $ | (0.07 | ) | |||||
| Diluted earnings (loss) per share—US GAAP |
$ | 0.37 | $ | 0.28 | $ | (0.07 | ) | |||||
Certain captions within the consolidated income statement and balance sheet are required to be separately disclosed under US GAAP. The amounts disclosed below reflect the separate disclosure of cost of revenues, selling, general and administrative, research and development and prepaid expenses and separate disclosure of current and noncurrent deferred income taxes under IFRS-EU in accordance with the US GAAP disclosure requirements. This disclosure has no affect on the total results of the Company as included within the statement of operations for any period, as the amounts are components of the amounts disclosed in the historical financial statements as the one caption of “Operating Expenses.”
| (in thousands) | 2011 | 2010 | 2009 | |||||||||
| Cost of revenues |
$ | 124,381 | $ | 108,458 | $ | 100,441 | ||||||
| Selling, general and administrative expenses |
29,113 | 26,483 | 66,184 | |||||||||
| Research and development |
12,540 | 10,955 | 9,141 | |||||||||
44
GlobeOp Financial Services S.A.
Notes to Consolidated Financial Statements
December 31, 2011, 2010 and 2009
Balance Sheet Items According to IFRS-EU and US GAAP
| IFRS-EU | US GAAP | |||||||||||||||
| December 31, | December 31, | |||||||||||||||
| (in thousands) | 2011 | 2010 | 2011 | 2010 | ||||||||||||
| Deferred income tax assets |
$ | 9,951 | $ | 19,617 | $ | 5,699 | $ | 8,035 | ||||||||
| Total noncurrent assets |
51,193 | 57,252 | 46,940 | 45,670 | ||||||||||||
| Prepaid expenses |
— | — | 4,773 | 3,962 | ||||||||||||
| Accounts receivable and other current assets |
27,664 | 21,147 | 22,390 | 16,806 | ||||||||||||
| Deferred income tax assets |
— | — | 1,329 | 1,329 | ||||||||||||
| Total current assets |
135,207 | 95,039 | 136,035 | 95,989 | ||||||||||||
| Total assets |
186,400 | 152,291 | 182,975 | 141,659 | ||||||||||||
| Other reserves |
30,700 | 37,255 | 26,394 | 26,982 | ||||||||||||
| Retained earnings |
93,523 | 61,977 | 95,226 | 62,098 | ||||||||||||
| Total shareholders’ equity |
144,678 | 116,141 | 142,075 | 105,989 | ||||||||||||
| Total noncurrent liabilities |
5,804 | 5,235 | 5,804 | 5,235 | ||||||||||||
| Trade and other payables |
35,741 | 27,502 | 34,919 | 27,022 | ||||||||||||
| Total current liabilities |
35,918 | 30,915 | 35,096 | 30,435 | ||||||||||||
| Total shareholders’ equity and liabilities |
$ | 186,400 | $ | 152,291 | $ | 182,975 | $ | 141,659 | ||||||||
Recently Issued Accounting Pronouncements
In September 2011, the Financial Accounting Standards Board (“FASB”) issued Accounting Standards Update (“ASU”) No. 2011-08, “Intangibles — Goodwill and Other (Topic 350): Testing Goodwill for Impairment” (“ASU 2011-08”). ASU 2011-08 intends to address concerns about the cost and complexity of performing the first step of the two-step goodwill impairment test required under Topic 350, Intangibles — Goodwill and Other. The guidance permits an entity to first assess qualitative factors to determine whether it is more likely than not that the fair value of a reporting unit is less than its carrying amount as a basis for determining whether it is necessary to perform the two-step goodwill impairment test described in Topic 350. The “more-likely-than-not” threshold is defined as having a likelihood of more than 50%. Under ASU 2011-08, an entity is not required to calculate the fair value of a reporting unit unless the entity determines that it is more likely than not that its fair value is less than its carrying amount. The provisions of ASU 2011-08 will be applied prospectively for annual and interim goodwill impairment tests performed for fiscal years beginning after December 15, 2011. Early adoption is permitted. The adoption of this standard will not have an impact on the Company’s financial position, results of operations or cash flows.
In June 2011, the FASB issued ASU No. 2011-05, “Comprehensive Income” (“ASU 2011-05”). ASU 2011-05 intends to enhance comparability and transparency of other comprehensive income components. The guidance provides an option to present total comprehensive income, the components of net income and the components of other comprehensive income in a single continuous statement or two separate but consecutive statements. ASU 2011-05 eliminates the option to present other comprehensive income components as part of the statement of changes in stockholders’ equity. The provisions of ASU 2011-05 will be applied retrospectively for interim and annual periods beginning after December 15, 2011. Early application is permitted. The FASB has announced that certain aspects of this update may be delayed. The adoption of this standard is not expected to have a material impact on the Company’s financial position, results of operations or cash flows as the financial statements already present a separate statement of comprehensive income in a consecutive statement to the income statement.
45
GlobeOp Financial Services S.A.
Notes to Consolidated Financial Statements
December 31, 2011, 2010 and 2009
In May 2011, the FASB issued ASU No. 2011-04, “Fair Value Measurement” (“ASU 2011-04”). ASU 2011-04 amends current fair value measurement and disclosure guidance to include increased transparency around valuation inputs and investment categorization. The changes are effective prospectively for interim and annual periods beginning after December 15, 2011. The adoption of this standard is not expected to have a material impact on the Company’s financial position, results of operations or cash flows.
In December 2010, the FASB issued ASU No. 2010-29, which updates the guidance in Accounting Standards Codification (“ASC”) Topic 805, Business Combinations (“ASU 2010-29”). The objective of ASU 2010-29 is to address diversity in practice regarding the interpretation of the pro forma revenue and earnings disclosure requirements for business combinations. The amendments in ASU 2010-29 specify that if a public entity presents comparative financial statements, the entity should disclose revenue and earnings of the combined entity as though the business combination(s) that occurred during the current year had occurred as of the beginning of the comparable prior annual reporting period only. The amendments also expand the supplemental pro forma disclosures to include a description of the nature and amount of material, nonrecurring pro forma adjustments directly attributable to the business combination included in the reported pro forma revenue and earnings. This guidance is effective for business combinations with an acquisition date on or after the beginning of the first annual reporting period beginning on or after December 15, 2010. The Company adopted this standard beginning January 1, 2011, and the adoption did not have a material impact on its financial position, results of operations or cash flows.
In December 2010, the FASB issued ASU No. 2010-28, Intangibles — Goodwill and Other (Topic 350): When to Perform Step 2 of the Goodwill Impairment Test for Reporting Units with Zero or Negative Carrying Amounts (“ASU 2010-28”). ASU 2010-28 modifies Step 1 of the goodwill impairment test so that for those reporting units with zero or negative carrying amounts, an entity is required to perform Step 2 of the goodwill impairment test if it is more likely than not based on an assessment of qualitative indicators that goodwill impairment exists. In determining whether it is more likely than not that goodwill impairment exists, an entity should consider whether there are any adverse qualitative factors indicating that impairment may exist. This guidance is effective for fiscal years, and interim periods within those years, beginning after December 15, 2010. The Company adopted this standard beginning January 1, 2011, and the adoption did not have an impact on its financial position, results of operations or cash flows.
In October 2009, the Financial Accounting Standards Board (“FASB”) issued an authoritative literature update relating to multiple-deliverable revenue arrangements. This updated literature establishes the accounting and reporting guidance for arrangements including multiple revenue-generating activities. The standard provides amendments to the criteria for separating deliverables, measuring and allocating arrangement consideration to one or more units of accounting. The amendments in this standard also establish a selling price hierarchy for determining the selling price of a deliverable. Significantly enhanced disclosures are also required to provide information about a vendor’s multiple-deliverable revenue arrangements, including information about the nature and terms, significant deliverables, and its performance within arrangements. The amendments also require disclosure regarding the significant judgments made and changes to those judgments and regarding the effect of the application of the relative selling-price method on the timing or amount of revenue recognition. These amendments are effective prospectively for revenue arrangements entered into or materially modified in the fiscal years beginning on or after June 15, 2010. Early application is permitted. The Company adopted this standard beginning January 1, 2011, and the adoption did not have a material impact on its financial position, results of operations or cash flows.
46
GlobeOp Financial Services S.A.
Notes to Consolidated Financial Statements
December 31, 2011, 2010 and 2009
Amortization of Intangible Assets
Total estimated amortization expense, related to intangible assets, for each of the next five years, as of December 31, 2011, is expected to approximate:
| (in thousands) | ||||
| Years Ending December 31, |
||||
| 2012 |
$ | 2,769 | ||
| 2013 |
1,418 | |||
| 2014 |
549 | |||
|
|
|
|||
| $ | 4,736 | |||
|
|
|
|||
Given the estimated useful lives of the intangible assets, no amortization expense is expected beyond 2014.
Research and Development
Research and development expense consist primarily of personnel costs [and other expenses] attributable to the enhancement of existing products and the development of new software products.
Leases
The Company is obligated under noncancelable operating leases for office space and office equipment. Total rental expense was $5.6 million, $4.9 million and $5.1 million for the years ended December 31, 2011, 2010 and 2009, respectively. Future minimum lease payments under the Company’s operating leases as of December 31, 2011, are as follows:
| (in thousands) | ||||
| Years Ending December 31, |
||||
| 2012 |
$ | 5,401 | ||
| 2013 |
5,325 | |||
| 2014 |
5,514 | |||
| 2015 |
5,394 | |||
| 2016 |
5,197 | |||
| 2017 and thereafter |
6,407 | |||
|
|
|
|||
| $ | 33,238 | |||
|
|
|
|||
Share-based Compensation
There were 10,565,000 shares authorized for grant under the 2009 LTIP and 1,868,147 shares available for future grant as of December 31, 2011.
The Company has recorded $1,389,000, 974,000 and nil of excess tax benefits in additional paid-in capital in 2011, 2010 and 2009, respectively.
At December 31, 2011, there was approximately $1.7 million of unearned noncash stock-based compensation related to the stock options that the Company expects to recognize as expense over an average remaining period of approximately 1 year.
47
GlobeOp Financial Services S.A.
Notes to Consolidated Financial Statements
December 31, 2011, 2010 and 2009
We have not yet recognized compensation expense relating to unvested restricted stock units of $5.9 million which will be recognized over a weighted-average future period of approximately 1.9 years.
The following table provides further information for our restricted stock unit and stock option awards:
| Years Ended December 31, | ||||||||||||
| (in thousands) | 2011 | 2010 | 2009 | |||||||||
| Total intrinsic value of stock option awards exercised |
$ | 8,458 | $ | 2,944 | $ | 375 | ||||||
| Total fair value of restricted stock unit awards vested |
458 | 2,173 | 1,439 | |||||||||
The following table summarizes information about stock options outstanding that are expected to vest and stock options outstanding that are exercisable at December 31, 2011:
| Outstanding, Vested Options Currently Exercisable | Outstanding Options Expected to Vest | |||||||||||||||||||||||||||||
| Shares | Weighted Average Exercise Price |
Aggregate Intrinsic Value (In thousands) |
Weighted Average Remaining Contractual Term (Years) |
Shares | Weighted Average Exercise Price |
Aggregate Intrinsic Value (In thousands) |
Weighted Average Remaining Contractual Term (Years) |
|||||||||||||||||||||||
| 13,174,589 | $ | 2.53 | $ | 24,938 | $ | 3.83 | 16,740,499 | $ | 2.60 | $ | 31,506 | $ | 4.68 | |||||||||||||||||
The fair value of each stock option grant or modification is estimated on the date of grant using a Black-Scholes valuation model, which incorporates the assumptions disclosed elsewhere. The risk-free interest rate is equal to the U.S. Treasury yield curve in effect at the time of grant for instruments with a similar expected life. The expected life represents an estimate of the period of time that options are expected to remain outstanding. Assumptions of expected dividend yield are estimates of dividend yields based on historical trends.
Income Taxes
The carrying value of our deferred tax assets assumes that we will be able to generate sufficient future taxable income in certain tax jurisdictions, based on estimates and assumptions. If these estimates and related assumptions change in the future, we may be required to record additional valuation allowances against our deferred tax assets resulting in additional income tax expense in our Consolidated Income Statement. On a quarterly basis, we evaluate whether deferred tax assets are realizable and assess whether there is a need for additional valuation allowances. The carrying value of our deferred tax assets and liabilities is recorded based on the statutory rates that we expect our deferred tax assets and liabilities to reverse into income. We estimate the state rate at which our deferred tax assets and liabilities will reverse based on estimates of state income apportionment for future years. Each of these estimates requires significant judgment on the part of our management. In addition, we evaluate the need to provide additional tax provisions for adjustments proposed by taxing authorities.
As of December 31, 2011, we had $0.2 million in liabilities associated with unrecognized tax benefits. All of the unrecognized tax benefits, if recognized, would decrease our effective tax rate and increase our net income. We recognize accrued interest and penalties relating to unrecognized tax benefits as a component of selling, general and administrative expenses.
48
GlobeOp Financial Services S.A.
Notes to Consolidated Financial Statements
December 31, 2011, 2010 and 2009
The sources of income before income taxes were as follows:
| Years Ended December 31, | ||||||||||||
| (in thousands) | 2011 | 2010 | 2009 | |||||||||
| U.S. |
$ | 35,179 | $ | 35,720 | $ | (32,739 | ) | |||||
| Foreign |
21,229 | 7,663 | 14,483 | |||||||||
|
|
|
|
|
|
|
|||||||
| Income before income taxes |
$ | 56,408 | $ | 43,383 | $ | (18,256 | ) | |||||
|
|
|
|
|
|
|
|||||||
In accordance with IFRS-EU, deferred tax assets and liabilities are included within one single line item. A break-out is included in the balance sheet summary above to disclose the deferred tax assets and liabilities in accordance with US GAAP.
The taxation charge (benefit) consists of the following:
| Years Ended December 31, | ||||||||||||
| (in thousands) | 2011 | 2010 | 2009 | |||||||||
| Current |
||||||||||||
| Federal |
$ | 5,767 | $ | 531 | $ | (6,057 | ) | |||||
| Foreign |
4,777 | 5,405 | 3,067 | |||||||||
| State |
2,035 | 339 | (1,680 | ) | ||||||||
|
|
|
|
|
|
|
|||||||
| 12,579 | 6,275 | (4,670 | ) | |||||||||
|
|
|
|
|
|
|
|||||||
| Deferred |
||||||||||||
| Federal |
2,078 | 6,429 | (4,676 | ) | ||||||||
| Foreign |
(329 | ) | (622 | ) | (1,065 | ) | ||||||
| State |
113 | 588 | (180 | ) | ||||||||
|
|
|
|
|
|
|
|||||||
| 1,862 | 6,395 | (5,921 | ) | |||||||||
|
|
|
|
|
|
|
|||||||
| $ | 14,441 | $ | 12,670 | $ | (10,591 | ) | ||||||
|
|
|
|
|
|
|
|||||||
The components of deferred income taxes at December 31, 2011 and 2010 are as follows:
| 2011 | 2010 | |||||||||||||||
| (in thousands) | Deferred Tax Assets |
Deferred Tax Liabilities |
Deferred Tax Assets |
Deferred Tax Liabilities |
||||||||||||
| Deferred share based compensation |
$ | 4,580 | $ | — | $ | 5,879 | $ | — | ||||||||
| Tax credit carryforwards |
1,889 | — | 2,373 | — | ||||||||||||
| Net operating loss carryforward |
3,810 | — | 2,827 | — | ||||||||||||
| Accrued expenses |
950 | — | 719 | — | ||||||||||||
| Other |
798 | — | 515 | — | ||||||||||||
| Intangible and fixed assets |
— | (1,189 | ) | — | (122 | ) | ||||||||||
|
|
|
|
|
|
|
|
|
|||||||||
| 12,027 | (1,189 | ) | 12,313 | (122 | ) | |||||||||||
| Valuation allowance |
(3,810 | ) | — | (2,827 | ) | — | ||||||||||
|
|
|
|
|
|
|
|
|
|||||||||
| $ | 8,217 | $ | (1,189 | ) | $ | 9,486 | $ | (122 | ) | |||||||
|
|
|
|
|
|
|
|
|
|||||||||
49
GlobeOp Financial Services S.A.
Notes to Consolidated Financial Statements
December 31, 2011, 2010 and 2009
The Company has recorded valuation allowances of $3,810,000 at December 31, 2011 and $2,827,000 at 2010 related to net operating loss carryforwards and tax credits in certain foreign jurisdictions. Available evidence includes the reversal of existing taxable temporary differences, future taxable income exclusive of temporary differences, taxable income in carryback years and tax planning strategies. The valuation allowance increased $983,000 in 2011 primarily due to losses incurred in Luxembourg.
The Company accounts for uncertain tax positions using a two-step approach. The first step is to evaluate the tax position for recognition by determining if the weight of available evidence indicates it is more likely than not that the position will be sustained on audit, including resolution of related appeals or litigation processes, if any. The second step is to measure the tax benefit as the largest amount which is more than 50% likely of being realized upon ultimate settlement. The Company considers many factors when evaluating and estimating its tax positions and tax benefits, which may require periodic adjustments and which may not accurately forecast actual outcomes.
The following table summarizes the activity related to the Company’s unrecognized tax benefits for the years ended December 31, 2011, 2010 and 2009:
| (in thousands) | ||||
| Balance at January 1, 2009 |
$ | 908 | ||
| Lapse of statutes of limitation |
(166 | ) | ||
|
|
|
|||
| Balance at December 31, 2009 |
742 | |||
| Lapse of statutes of limitation |
(230 | ) | ||
|
|
|
|||
| Balance at December 31, 2010 |
512 | |||
| Lapse of statutes of limitation |
(294 | ) | ||
|
|
|
|||
| Balance at December 31, 2011 |
$ | 218 | ||
|
|
|
|||
The Company recognized income, before federal tax benefit related to interest and penalties of $182,000, $220,000 and $94,000 in 2011, 2010 and 2009, respectively. The Company had $102,000 and $284,000 accrued for the payment of interest and penalties as of December 31, 2011 and December 31, 2010, respectively.
We operate under certain tax holidays in India, which are effective through December 2012 and may be extended if certain additional requirements are satisfied. The tax holidays are conditional upon our meeting certain employment and investment thresholds. The impact of these tax holidays decreased foreign taxes by $1,137,000, $1,185,000 and $320,000 for 2011, 2010 and 2009, respectively. The benefit of the tax holidays on net income per share (basic and diluted) was $.01, $.01, and $ nil for 2011, 2010, and 2009, respectively.
50