Attached files
| file | filename |
|---|---|
| 8-K - LAYNE CHRISTENSEN COMPANY 8-K - LAYNE CHRISTENSEN CO | a50587319.htm |
Exhibit 99.1
Layne March 11‐12, 2013 WATER MINERAL ENERGY
Safe Harbor This presentation may contain forward‐looking statements within the meaning of Section 27A of the Securities Act of 1933 and Section 21E of the Exchange Act of 1934. Such statements may include, but are not limited to, statements of plans and objectives, statements of future economic performance and statements of assumptions underlying such statements, and statements of management’s intentions, hopes, beliefs, expectations or predictions of the future. Forward‐looking statements can often be identified by the use of forward‐looking terminology, such as “should,” “intended,” “continue,” “believe,” “may,” “hope,” “anticipate,” “goal,” “forecast,” “plan,” “estimate” and similar words or phrases. Such statements are based on current expectations and are subject to certain risks, uncertainties and assumptions, including but not limited to: the outcome of the ongoing internal investigation into, among other things, the legality, under the FCPA and local laws, of certain payments to agents and other third parties interacting with government officials in certain countries in Africa relating to the payment of taxes and the importing of equipment (including any government enforcement action which could arise out of the matters under review or that the matters under review may have resulted in a higher dollar amount of payments or may have a greater financial or business impact than management currently anticipates), prevailing prices for various commodities, unanticipated slowdowns in the Company’s major markets, the availability of credit, the risks and uncertainties normally incident to the construction industry the impact of competition the effectiveness of operational changes expected to increase industry, competition, efficiency and productivity, worldwide economic and political conditions and foreign currency fluctuations that may affect worldwide results of operations. Should one or more of these risks or uncertainties materialize, or should underlying assumptions prove incorrect, actual results may vary materially and adversely from those anticipated, estimated or projected. These forward‐looking statements are made as of the date of this presentation and the Company assumes no obligation to update such forward‐looking statements or to update the reasons why actual results could differ materially from those anticipated in such forward‐looking statements. The preliminary results could differ materially from the audited results that will be reported on or about April 15, 2013. The unaudited results presented in this presentation are preliminary, and remain subject to regular year‐end closing processes that could result in significant adjustments, including the assessment of the value of long‐lived assets and goodwill, income tax provisions, evaluation of uncertain tax positions, evaluation of certain deferred tax assets, final assessment of legal matters and other significant estimates. 2
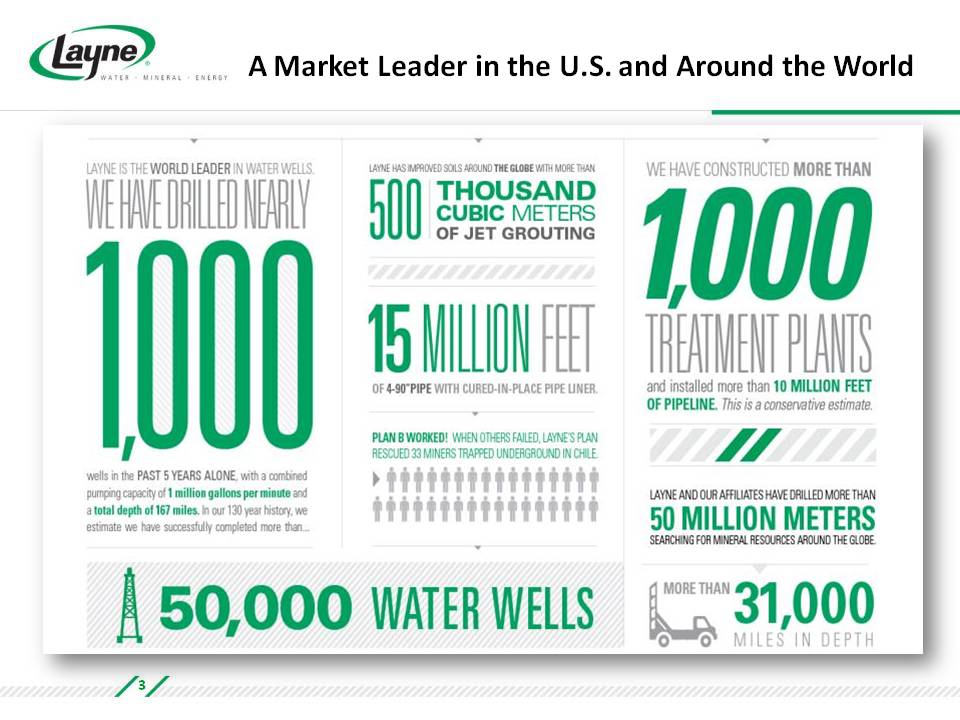
A Market Leader in the U.S. and Around the World 3
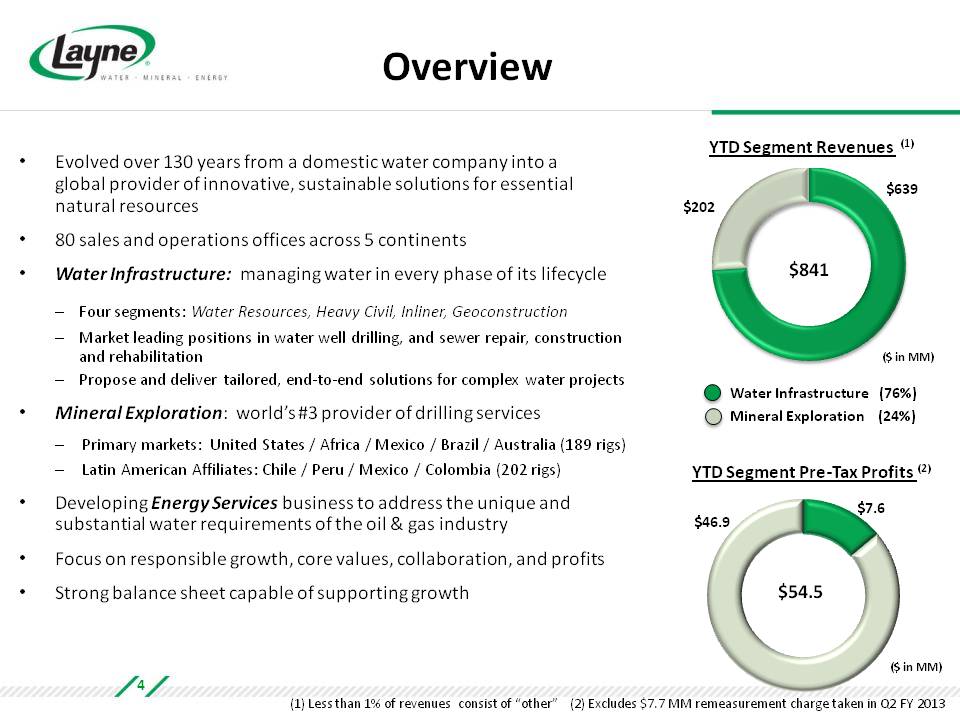
Overview Evolved over 130 years from a domestic water company into a global provider of innovative, sustainable solutions for essential natural resources 80 sales and operations offices across 5 continents Water Infrastructure: managing water in every phase of its lifecycle Four segments: Water Resources, Heavy Civil, Inliner, Geoconstruction Market leading positions in water well drilling, and sewer repair, construction and rehabilitation Propose and deliver tailored, end‐to‐end solutions for complex water projects Mineral Exploration: world’s #3 provider of drilling services Primary markets: United States / Africa / Mexico / Brazil / Australia (189 rigs) Latin American Affiliates: Chile / Peru / Mexico / Colombia (202 rigs) Developing Energy Services business to address the unique and substantial water requirements of the oil & gas industry Focus on responsible growth, core values, collaboration, and profits Strong balance sheet capable of supporting growth YTD Segment Revenues (1) $841 $639 $202 ($ in MM) Water Infrastructure (76%) Mineral Exploration (24%) YTD Segment Pre‐Tax Profits (2) $54.5 $46.9 $7.6 ($ in MM) (1) Less than 1% of revenues consist of “other” (2) Excludes $7.7 MM remeasurement charge taken in Q2 FY 2013 4
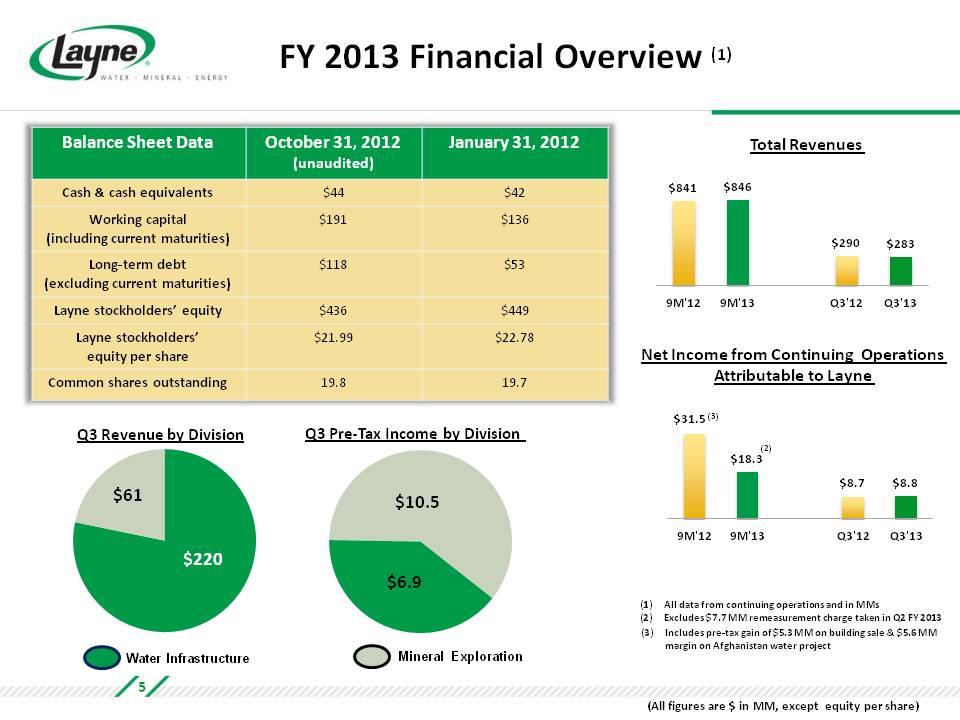
FY 2013 Financial Overview (1) Balance Sheet Data October 31, 2012 (unaudited) January 31, 2012 Cash & cash equivalents $44 $42 Working capital (including current maturities) $191 $136 Long‐term debt (excluding current maturities) $118 $53 Layne stockholders’ equity $436 $449 Layne stockholders’ equity per share $21.99 $22.78 Common shares outstanding 19.8 19.7 Q3 Revenue by Division Q3 Pre‐Tax Income by Division $220 $61 Water Infrastructure $10.5 $6.9 Mineral Exploration Total Revenues $841 $846 $290 $283 9M'12 9M'13 Q3'12 Q3'13 Net Income from Continuing Operations Attributable to Layne $31.5 (3) $18.3 (2) $8.7 $8.8 9M'12 9M'13 Q3'12 Q3'13 (1) All data from continuing operations and in MMs (2) Excludes $7.7MM remeasurement charge taken in Q2 FY 2013 (3) Includes pre‐tax gain of $5.3 MM on building sale & $5.6 MM margin on Afghanistan water project (All figures are $ in MM, except equity per share) 5
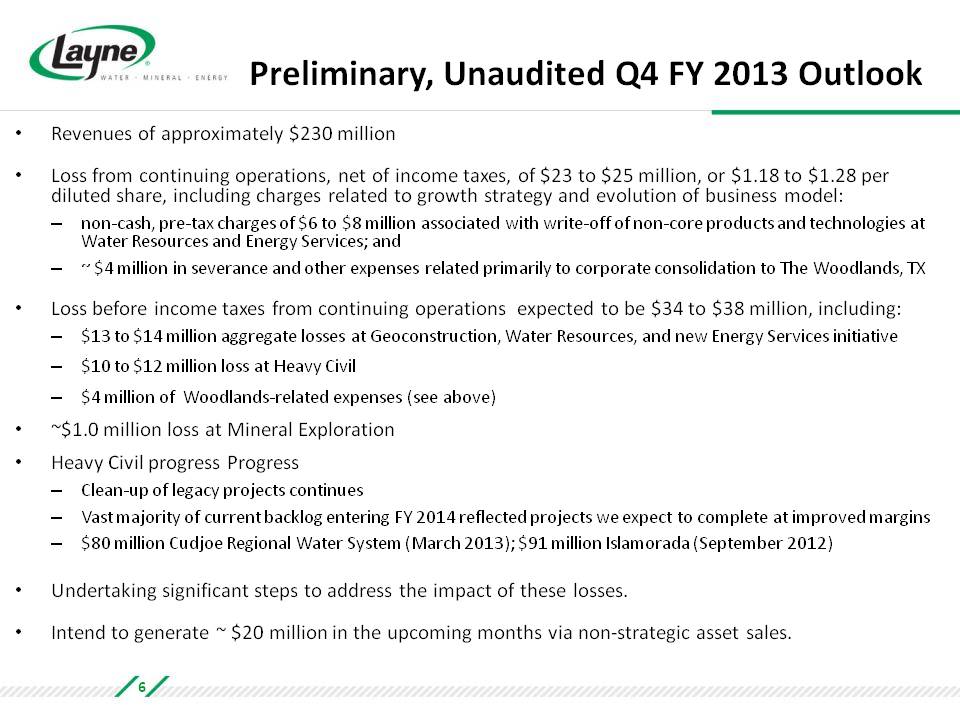
Preliminary, Unaudited Q4 FY 2013 Outlook Revenues of approximately $230 million Loss from continuing operations, net of income taxes, of $23 to $25 million, or $1.18 to $1.28 per diluted share, including charges related to growth strategy and evolution of business model: non‐cash, pre‐tax charges of $6 to $8 million associated with write‐off of non‐core products and technologies at Water Resources and Energy Services; and ~ $4 million in severance and other expenses related primarily to corporate consolidation to The Woodlands, TX Loss before income taxes from continuing operations expected to be $34 to million $38 million, including: $13 to $14 million aggregate losses at Geoconstruction, Water Resources, and new Energy Services initiative $10 to $12 million loss at Heavy Civil $4 million of Woodlands‐related expenses (see above) ~$1.0 million loss at Mineral Exploration Heavy Civil progress Progress Clean‐up of legacy projects continues Vast of current backlog FY 2014 reflected projects we expect to complete – majority entering at improved margins $80 million Cudjoe Regional Water System (March 2013); $91 million Islamorada (September 2012) Undertaking significant steps to address the impact of these losses. Intend to generate ~ $20 million in the upcoming months via non‐strategic asset sales. 6
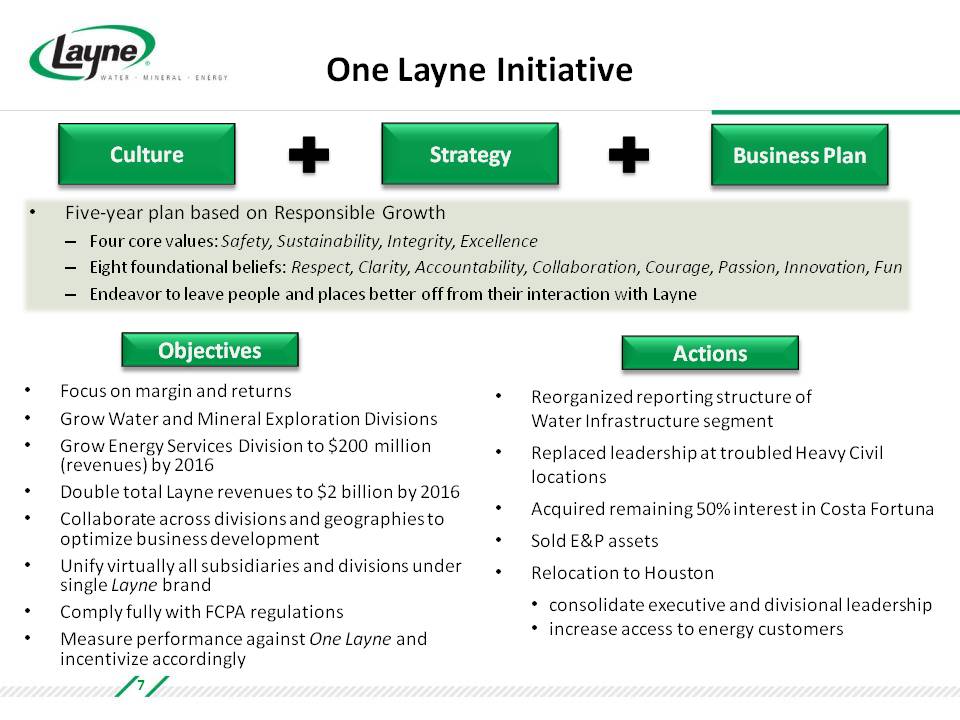
One Layne Initiative Culture Strategy Business Plan Five‐year plan based on Responsible Growth Four core values: Safety, Sustainability, Integrity, Excellence Eight foundational beliefs: Respect, Clarity, Accountability, Collaboration, Courage, Passion, Innovation, Fun Endeavor to leave people and places better off from their interaction with Layne Objectives Focus on margin and returns Grow Water and Mineral Exploration Divisions Grow Energy Services Division to $200 million (revenues) by 2016 Double total Layne revenues to $2 billion by 2016 Collaborate across divisions and geographies to optimize business development Unify virtually all subsidiaries and divisions under single Layne brand Comply fully with FCPA regulations Measure performance against One Layne and incentivize accordingly Actions Reorganized reporting structure of Water Infrastructure segment Replaced leadership at troubled Heavy Civil locations Acquired remaining 50% interest in Costa Fortuna Sold E&P assets Relocation to Houston consolidate executive and divisional leadership increase access to energy customers 7
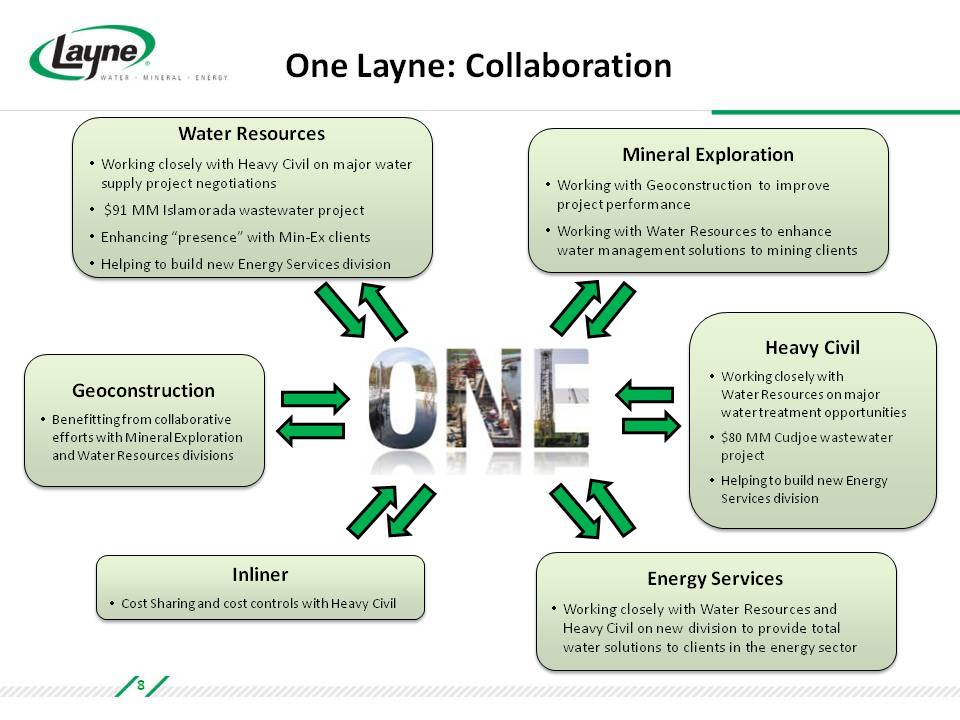
One Layne: Collaboration Water Resources Working closely with Heavy Civil on major water supply project negotiations $91 MM Islamorada wastewater project Enhancing “presence” with Min‐Ex clients Helping to build new Energy Services division Mineral Exploration Working with Geoconstruction to improve project performance Working with Water Resources to enhance water management solutions to mining clients Geoconstruction Benefitting from collaborative efforts with Mineral Exploration and Water Resources divisions Heavy Civil Working closely with Water Resources on major water treatment opportunities $80 MM Cudjoe wastewater project Helping to build new Energy Services division Inliner Cost Sharing and cost controls with Heavy Civil Energy Services Working closely with Water Resources and Heavy Civil on new division to provide total water solutions to clients in the energy sector 8
Water Infrastructure Solutions: Manage Every Phase of the Water Cycle Source Transfer/Deliver Treat Reuse
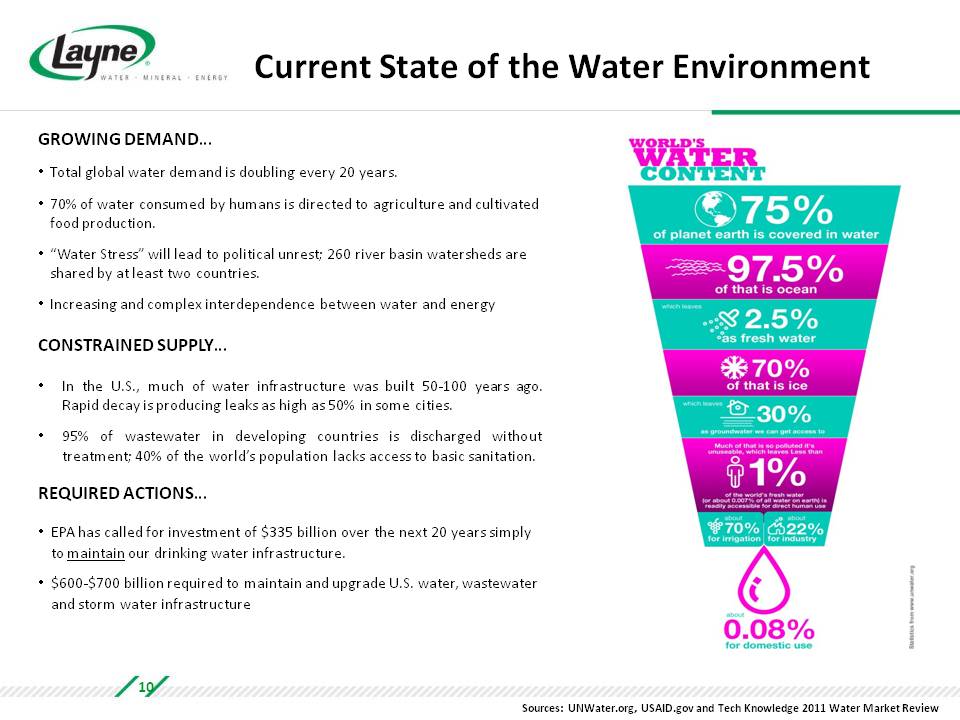
Current State of the Water Environment GROWING DEMAND… Total global water demand is doubling every 20 years. 70% of water consumed by humans is directed to agriculture and cultivated food production. “Water Stress” will lead to political unrest; 260 river basin watersheds are shared by at least two countries. Increasing and complex interdependence between water and energy CONSTRAINED SUPPLY… In the U.S., much of water infrastructure was built 50‐100 years ago. Rapid decay is producing leaks as high as 50% in some cities. 95% of wastewater in developing countries is discharged without treatment; 40% of the world’s population lacks access to basic sanitation. REQUIRED ACTIONS… EPA has called for investment of $335 billion over the next 20 years simply to maintain our drinking water infrastructure. $600‐$700 billion required to maintain and upgrade U.S. water, wastewater and storm water infrastructure Sources: UNWater.org, USAID.gov and Tech Knowledge 2011 Water Market Review 10
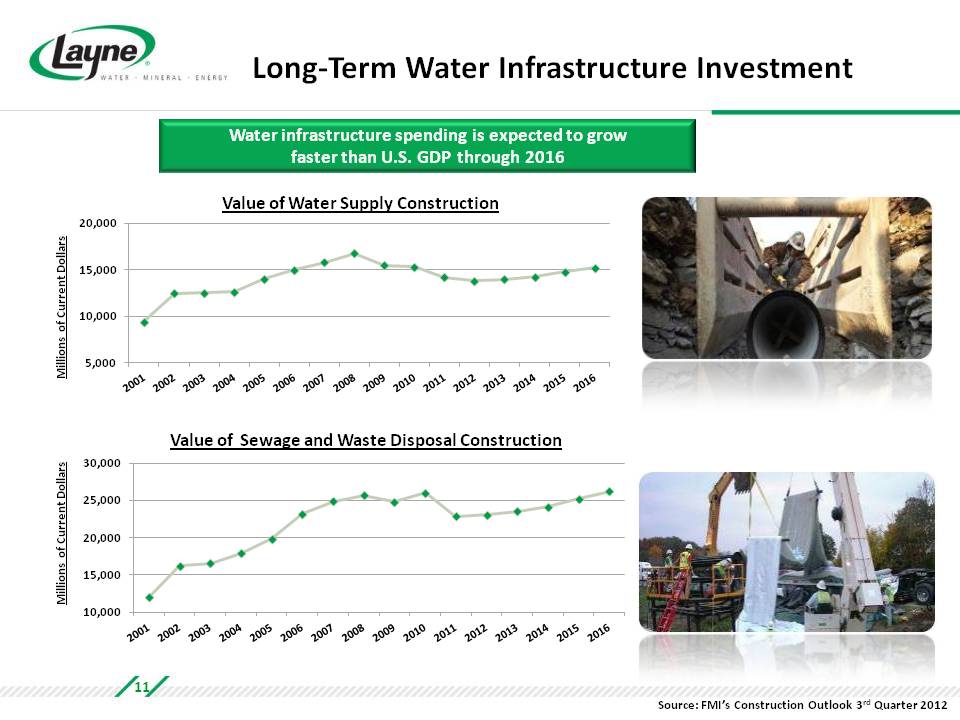
Long‐Term Water Infrastructure Investment Water infrastructure spending is expected to grow faster than U.S. GDP through 2016 Value of Water Supply Construction Value of Sewage and Waste Disposal Construction Source: FMI’s Construction Outlook 3rd Quarter 2012 11
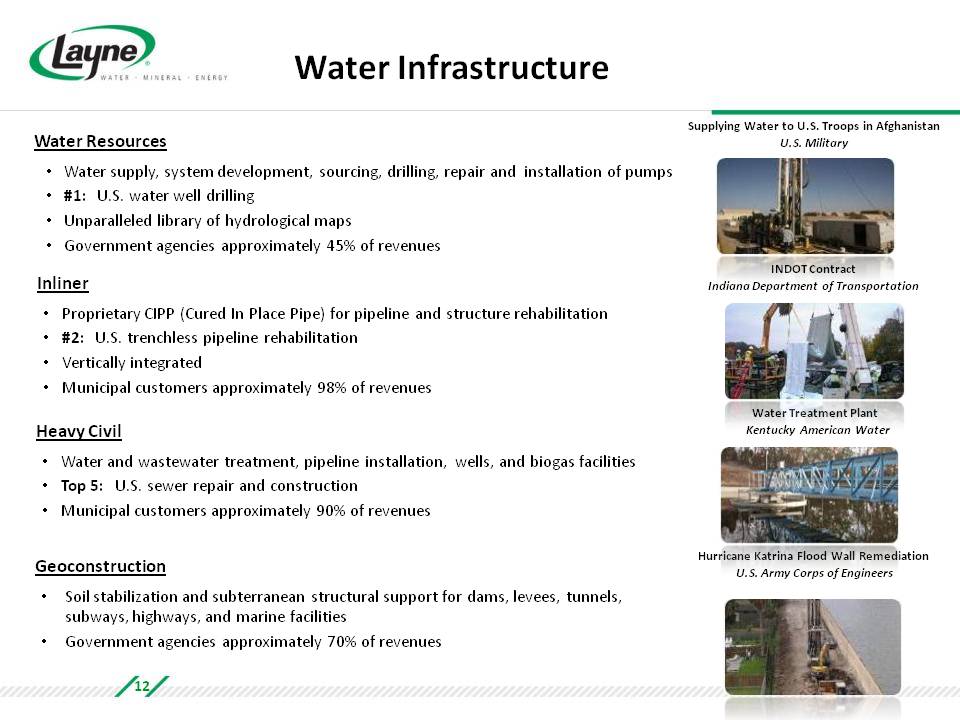
Water Infrastructure Water Resources Water supply, system development, sourcing, drilling, repair and installation of pumps #1: U.S. water well drilling Unparalleled library of hydrological maps Government agencies approximately 45% of revenues Inliner Proprietary CIPP (Cured In Place Pipe) for pipeline and structure rehabilitation #2: U.S. trenchless pipeline rehabilitation Vertically integrated Municipal customers approximately 98% of revenues Heavy Civil Water and wastewater treatment, pipeline installation, wells, and biogas facilities Top 5: U.S. sewer repair and construction Municipal customers approximately 90% of revenues Geoconstruction Soil stabilization and subterranean structural support for dams, levees, tunnels, subways, highways , and marine facilities Government agencies approximately 70% of revenues Supplying Water to U.S. Troops in Afghanistan U.S. Military INDOT Contract Indiana Department of Transportation Water Treatment Plant Kentucky American Water Hurricane Katrina Flood Wall Remediation U.S. Army Corps of Engineers 12
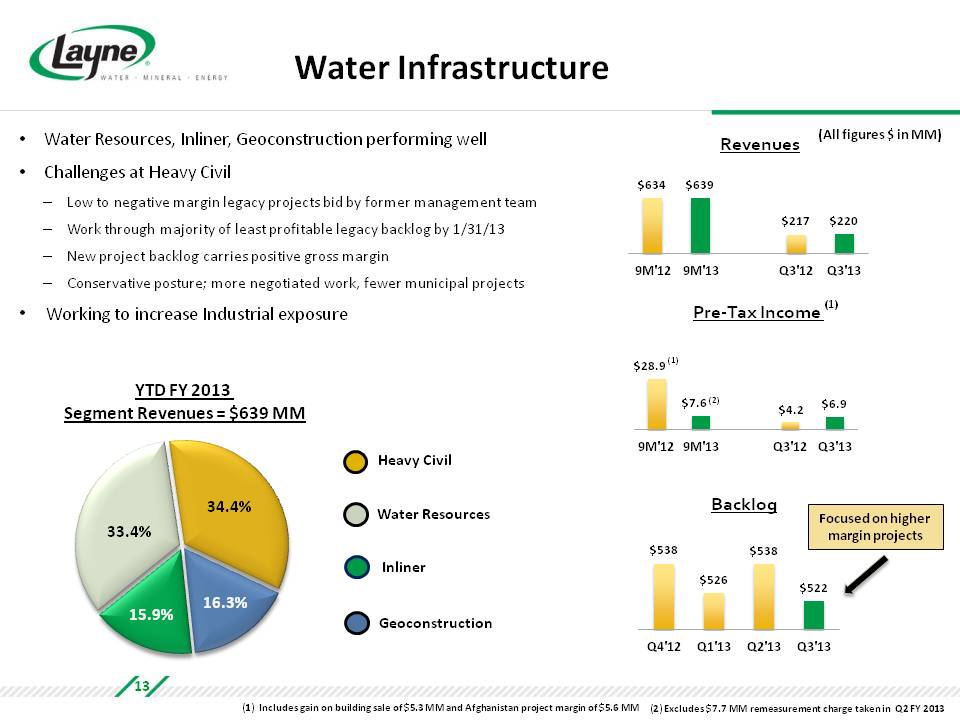
Water Infrastructure Water Resources, Inliner, Geoconstruction performing well Challenges at Heavy Civil Low to negative margin legacy projects bid by former management team Work through majority of least profitable legacy backlog by 1/31/13 New project backlog carries positive gross margin Conservative posture; more negotiated work, fewer municipal projects Working to increase Industrial exposure Revenues (All figures $ in MM) $634 $639 $217 $220 9M'12 9M'13 Q3'12 Q3'13 Pre‐Tax Income (1) $28.9 (1) $7.6 (2) $4.2 $6.9 9M'12 9M'13 Q3'12 Q3'13 Backlog $538 $526 $538 $522 Q4'12 Q1'13 Q2'13 Q3'13 Focused on higher margin projects YTD FY 2013 Segment Revenues = $639 MM 34.4% 33.4% 15.9% 16.3% Heavy Civil Water Resources Inliner Geoconstruction (1) Includes gain on building sale of $5.3 MM and Afghanistan project margin of $5.6 MM (2) Excludes $7.7 MM remeasurement charge taken in Q2 FY 2013 13
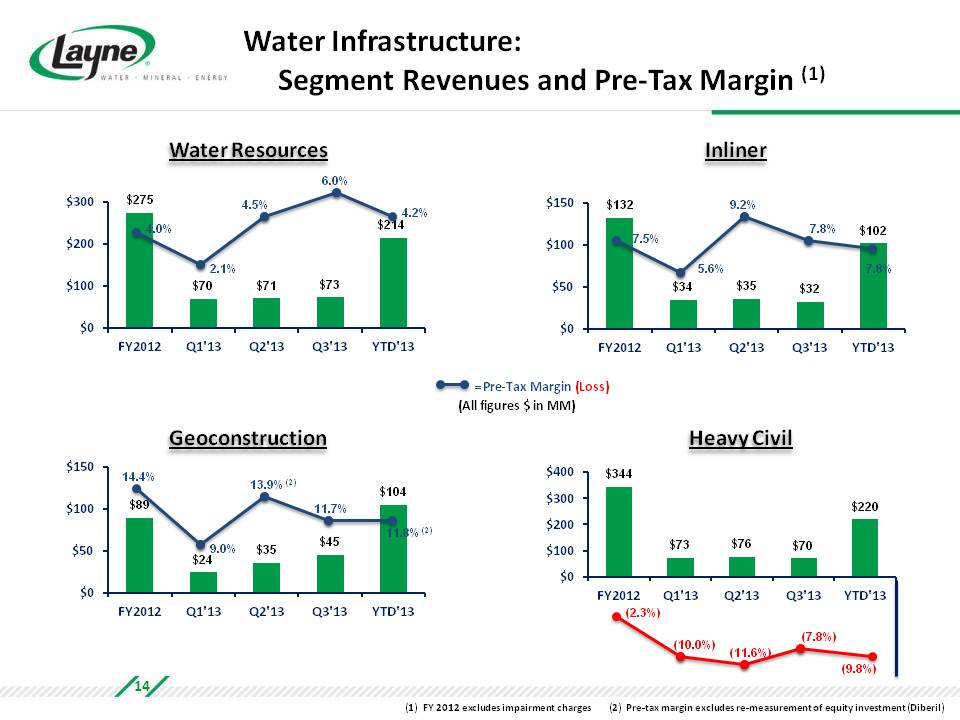
Water Infrastructure: Segment Revenues and Pre‐Tax Margin (1) = Pre‐Tax Margin (Loss) (All figures in MM) Water Resources $275 4.0% $70 2.1% $71 4.5% $73 6.0% $214 4.2% FY2012 Q1'13 Q2'13 Q3'13 YTD'13 Inliner $132 7.5% $34 5.6% $35 9.2% $32 7.8% $102 7.8% FY2012 Q1'13 Q2'13 Q3'13 YTD'13 Geoconstruction $89 14.4% $24 9.0% $35 13.9%(2) $45 11.7% $104 11.8%(2) FY2012 Q1'13 Q2'13 Q3'13 YTD'13 Heavy Civil $344 (2.3%) $73 (10.0%) $76 (11.6%) $70 (7.8%) $220 (9.8%) FY2012 Q1'13 Q2'13 Q3'13 YTD'13 (1) FY 2012 excludes impairment charges (2) Pre‐tax margin excludes re‐measurement of equity investment (Diberil) 14
Water Infrastructure Outlook Water Resources Drought‐stricken areas, i.e. Southeast and Midwest, offer opportunity for profitable growth Making progress in international expansion; drilling in Ethiopia to commence December 2012 $47 million of Industrial revenue YTD FY 2013; will exceed $50 million target for FY 2013 Growth strategies: pursue more international business, focus on growth markets, tailored solutions, collaboration Heavy Civil Emphasize negotiated work – $91 million Islamorada (September 2012); $80 million Cudjoe Wastewater (March 2013) Project 2 million in annual savings ‐ align cost structure and streamline operations Majority of least profitable backlog completed by 1/31/13 Return to profitability by second half of 2013 Growth strategies: pursue higher margin projects, and larger, more complex jobs; take advantage of rebounding infrastructure market and attrition of weaker competitors; manage costs Geoconstruction Expect positive benefits from Costa Fortuna acquisition and ground stabilization project in Washington, D.C., as well as collaboration with other Layne divisions Growth strategies: introduce new technologies; R&D partnerships; develop & expand presence in Central & South America; enter new markets Inliner WSSC project progressing and fiberglass manufacturing facility to come on line in calendar 2013 Sluggish Q4 FY 2013, but expect to stay on or ahead of plan Growth strategies: territory expansion; R&D; manufactured products; expanded installation and curing methodologies 15
Mineral Exploration Full Spectrum Mineral Exploration Drilling Services
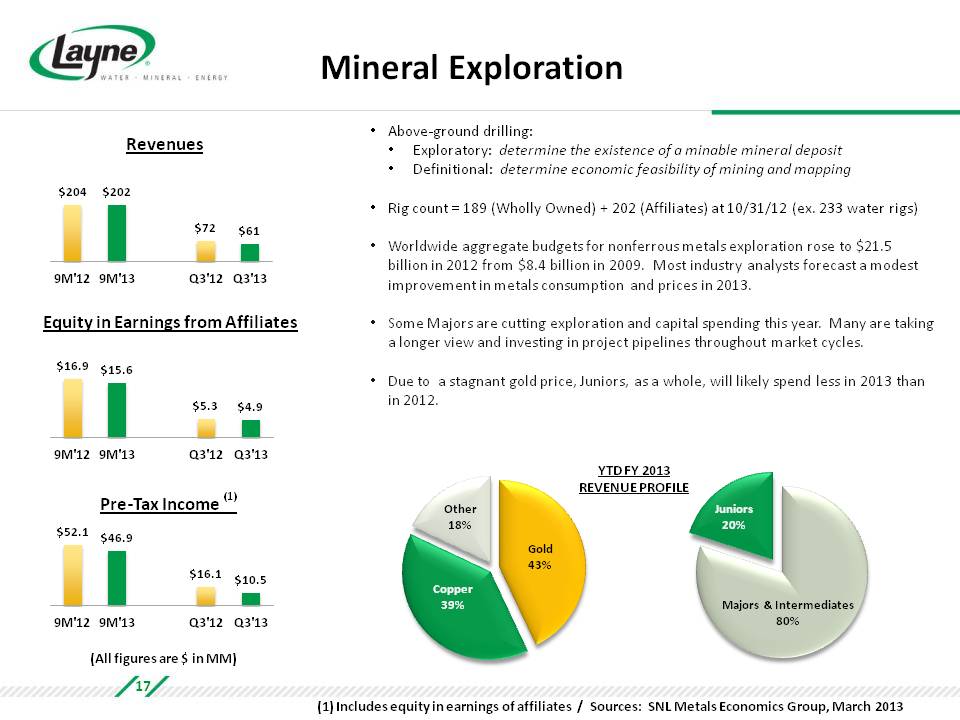
Mineral Exploration Revenues $204 $202 $72 $61 9M'12 9M'13 Q3'12 Q3'13 Equity in Earnings from Affiliates $16.9 $15.6 $5.3 $4.9 9M'12 9M'13 Q3'12 Q3'13 Pre‐Tax Income (1) $52.1 $46.9 $16.1 $10.5 9M'12 9M'13 Q3'12 Q3'13 (All figures are $ in MM) Above‐ground drilling: Exploratory: determine the existence of a minable mineral deposit Definitional: determine economic feasibility of mining and mapping Rig count = 189 (Wholly Owned) + 202 (Affiliates) at 10/31/12 (ex 233 water rigs) Worldwide aggregate budgets for nonferrous metals exploration rose to $21.5 billion in 2012 from $8.4 billion in 2009. Most industry analysts forecast a modest improvement in metals consumption and prices in 2013. Some Majors are cutting exploration and capital spending this year. Many are taking a longer view and investing in project pipelines throughout market cycles. Due to a stagnant gold price, Juniors, as a whole, will likely spend less in 2013 than in 2012. YTD FY 2013 REVENUE PROFILE Other 18% Copper 39% Gold 43% Juniors 20% Majors & Intermediates 80% (1) Includes equity in earnings of affiliates / Sources: SNL Metals Economics Group, March 2013 17
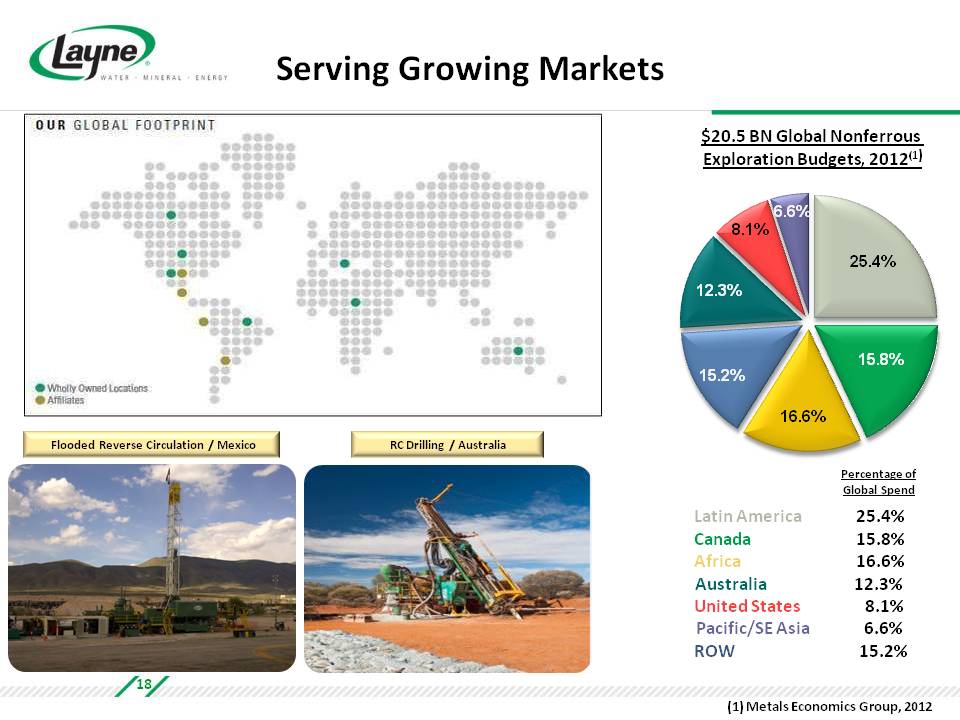
Serving Growing Markets $20.5 BN Global Nonferrous Exploration Budgets, 2012(1) Percentage of Global Spend Latin America 25.4% Canada 15.8% Africa 16.6% Australia 12.3% United States 8.1% Pacific/SE Asia 6.6% ROW 15.2% Flooded Reverse Circulation / Mexico RC Drilling / Australia (1) Metals Economics Group, 2012 18
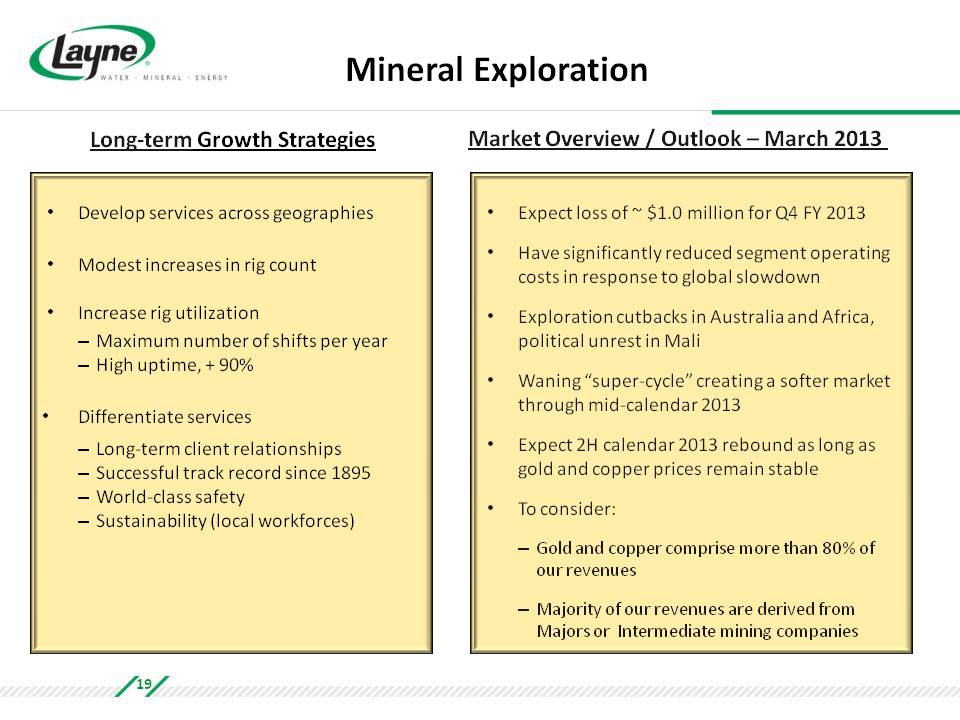
Mineral Exploration Long‐term Growth Strategies Develop services across geographies Modest increases in rig count Increase rig utilization Maximum number of shifts per year High uptime, + 90% Differentiate services Long‐term client relationships Successful track record since 1895 World‐class safety Sustainability (local workforces) Market Overview / Outlook –March 2013 Expect loss of ~ $1.0 million for Q4 FY 2013 Have significantly reduced segment operating costs in response to global slowdown Exploration cutbacks in Australia and Africa, political unrest in Mali Waning “super‐cycle” creating a softer market through mid‐calendar 2013 Expect 2H calendar 2013 rebound as long as gold and copper prices remain stable To consider: Gold and copper comprise more than 80% of our revenues Majority of our revenues are derived from Majors or Intermediate mining companies 19
Energy An Evolving Focus
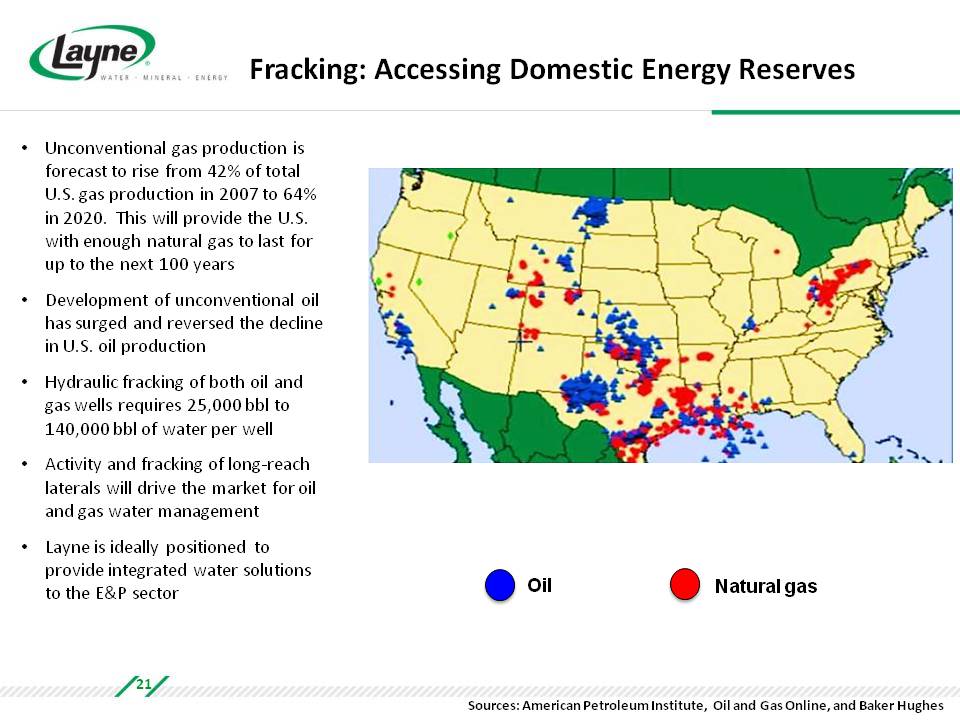
Fracking: Accessing Domestic Energy Reserves Unconventional gas production is forecast to rise from 42% of total U.S. gas production in 2007 to 64% in 2020. This will provide the U.S. with enough natural gas to last for up to the next 100 years Development of unconventional oil has surged and reversed the decline n U.S. oil production Hydraulic fracking of both oil and gas wells requires 25,000 bbl to 140,000 bbl of water per well Activity and fracking of long‐reach laterals will drive the market for oil and gas water management Layne is ideally positioned to provide integrated water solutions to the E&P sector Oil Natural gas Sources: American Petroleum Institute, Oil and Gas Online, and Baker Hughes 21
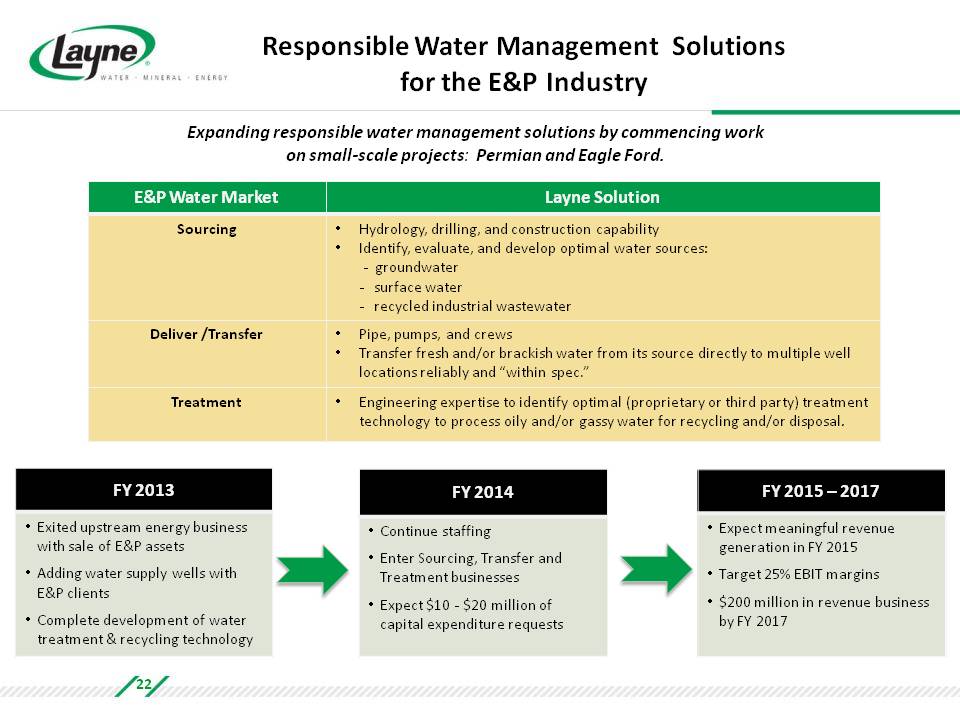
Responsible Water Management Solutions for the E&P Industry Expanding responsible water management solutions by commencing work on small‐scale projects: Permian and Eagle Ford. E&P Water Market Layne Solution Sourcing Hydrology, drilling, and construction capability Identify, evaluate, and develop optimal water sources: groundwater surface water recycled industrial wastewater Deliver /Transfer Pipe, pumps, and crews Transfer fresh and/or brackish water from its source directly to multiple well locations reliably and “within spec.” Treatment Engineering expertise to identify optimal (proprietary or third party) treatment technology to process oily and/or gassy water for recycling and/or disposal. FY 2013 FY 2014 FY 2015 – 2017 Exited upstream energy business with sale of E&P assets Adding water supply wells with E&P clients Complete development of water treatment & recycling technology Continue staffing Enter Sourcing, Transfer and Treatment businesses Expect $10 ‐ $20 million of capital expenditure requests Expect meaningful revenue generation in FY 2015 Target 25% EBIT margins $200 million in revenue business by FY 2017 22

Contact Us AT THE COMPANY: Layne Jerry Fanska, SVP‐Finance 913.677.6858 Jerry.Fanska@layne.com www.layne.com INVESTOR RELATIONS: The Equity Group Inc. Devin Sullivan, SVP 212.836.9608 dsullivan@equityny.com www.theequitygroup.com 23
Appendix
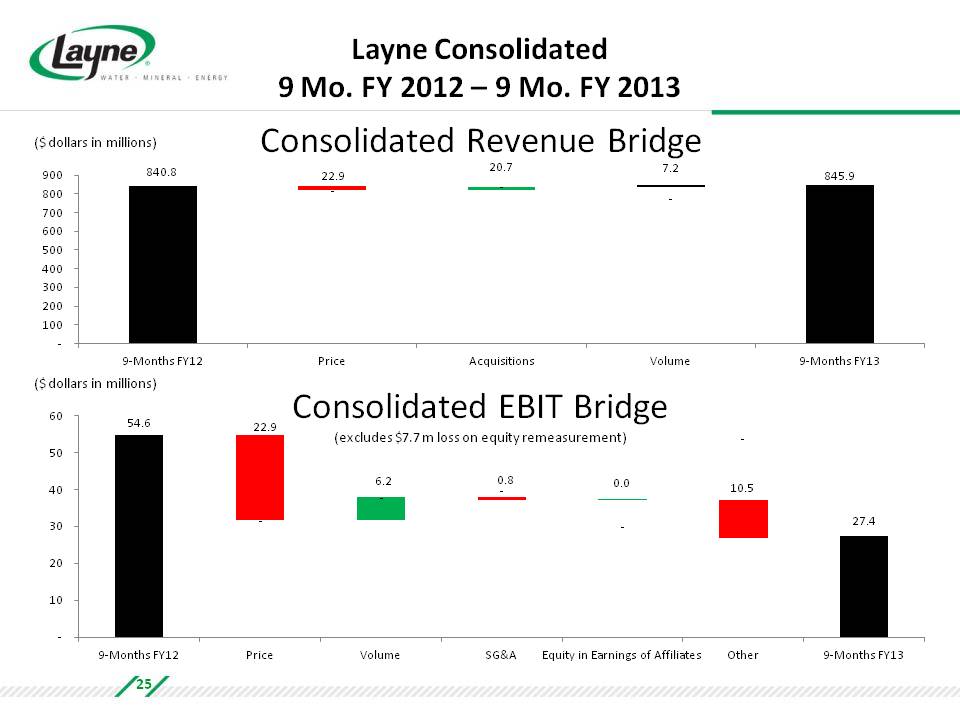
Layne Consolidated 9 Mo. FY 2012 – 9 Mo. FY 2013 Consolidated Revenue Bridge ($ dollars in millions) 840.8 22.9 20.7 7.2 845.9 9‐Months FY12 Price Acquisitions Volume 9‐Months FY13 Consolidated EBIT Bridge (excludes $7.7 m loss on equity remeasurement) ($ dollars in millions) 54.6 22.9 6.2 0.8 0.0 10.5 27.4 9‐Months FY12 Price Volume SG&A Equity in Earnings of Affiliates Other 9‐Months FY13 25
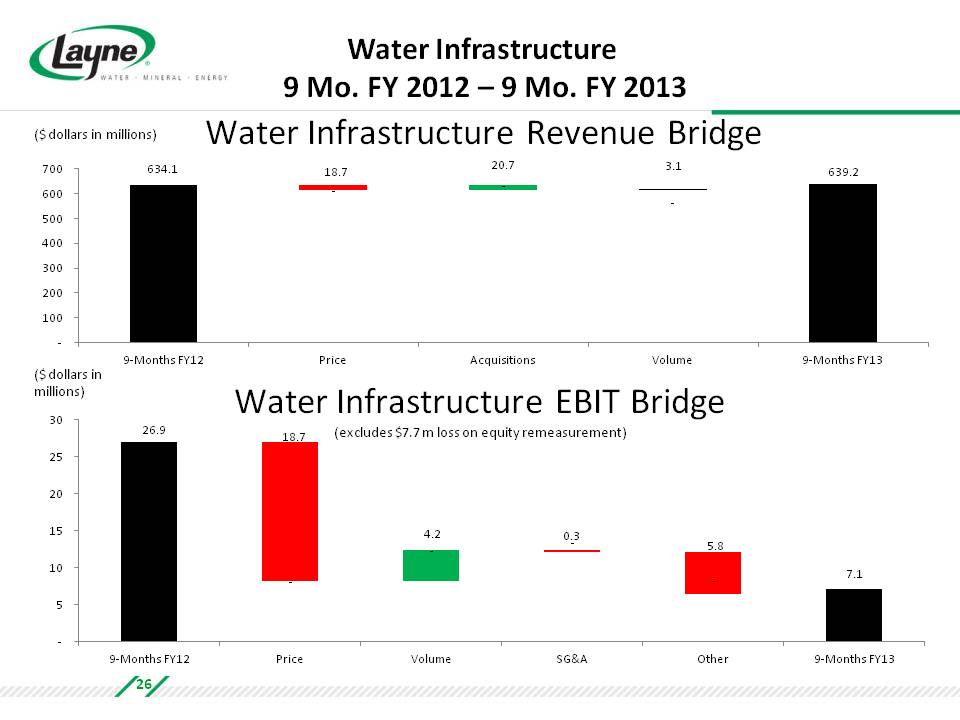
Water Infrastructure 9 Mo. FY 2012 – 9 Mo. FY 2013 Water Infrastructure Revenue Bridge ($ dollars in millions) 634.1 18.7 20.7 3.1 639.2 9‐Months FY12 Price Acquisitions Volume 9‐Months FY13 Water Infrastructure EBIT Bridge (excludes $7.7 m loss on equity remeasurement) ($ dollars in millions) 26.9 18.7 4.2 0.3 5.8 7.1 9‐Months FY12 Price Volume SG&A Other 9‐Months FY13 26
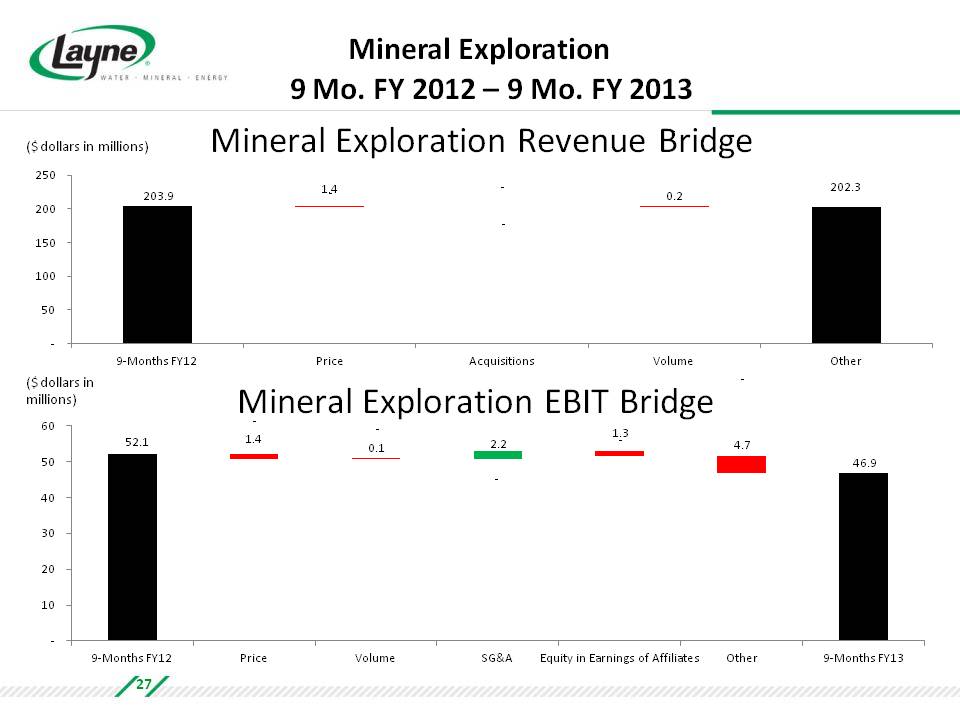
Mineral Exploration 9 Mo. FY 2012 – 9 Mo. FY 2013 Mineral Exploration Revenue Bridge ($ dollars in millions) 203.9 1.4 ‐ 0.2 202.3 9‐Months FY12 Price Acquisitions Volume Other Mineral Exploration EBIT Bridge ($ dollars in millions) 52.1 1.4 0.1 2.2 1.3 4.7 46.9 9‐Months FY12 Price Volume SG&A Equity in Earnings of Affiliates Other 9‐Months FY13 27
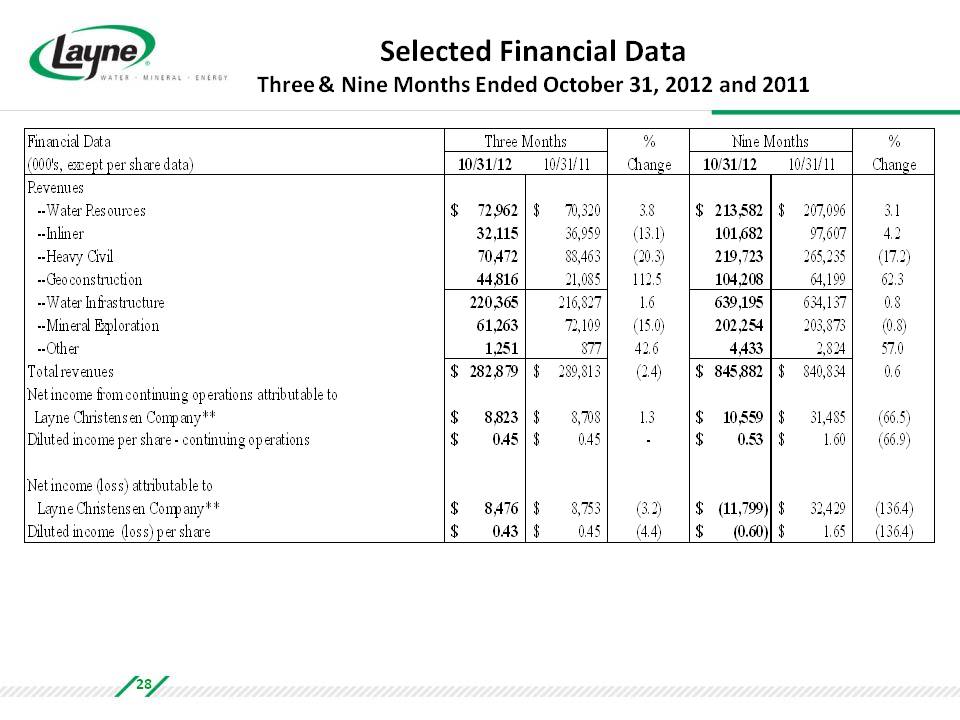
Selected Financial Data Three & Nine Months Ended October 31, 2012 and 2011 Financial Data (000's, except per share data) Three Months 10/31/12 10/31/11 % Change Nine Months 10/31/12 10/31/11 % Change Revenues Water Resources $ 72,962 $ 70,320 3.8 $ 213,582 $ 207,096 3.1 Inliner 32,115 36,959 (13.1) 101,682 97,607 4.2 Heavy Civil 70,472 88,463 (20.3) 219,723 265,235 (17.2) Geoconstruction 44,816 21,085 112.5 104,208 64,199 62.3 Water Infrastructure 220,365 216,827 1.6 639,195 634,137 0.8 Mineral Exploration 61,263 72,109 (15.0) 202,254 203,873 (0.8) Other 1,251 877 42.6 4,433 2,824 57.0 Total revenues $ 282,879 $ 289,813 $ (2.4) $ 845,882 $ 840,834 $ 0.6 Net income from continuing operations attributable to Layne Christensen Company** $ 8,823 $ 8,708 1.3 10,559 $ 31,485 (66.5) Diluted income per share - continuing operations $ 0.45 $ 0.45 - 0.53 $ 1.60 $ (66.9) Net income (loss) attributable to Layne Christensen Company** $ 8,476 $ 8,753 (3.2)$ (11,799) $ 32,429 $ (136.4) Diluted income (loss) per share $ 0.43 $ 0.45 (4.4) $ (0.60) $ 1.65 $ (136.4) 28
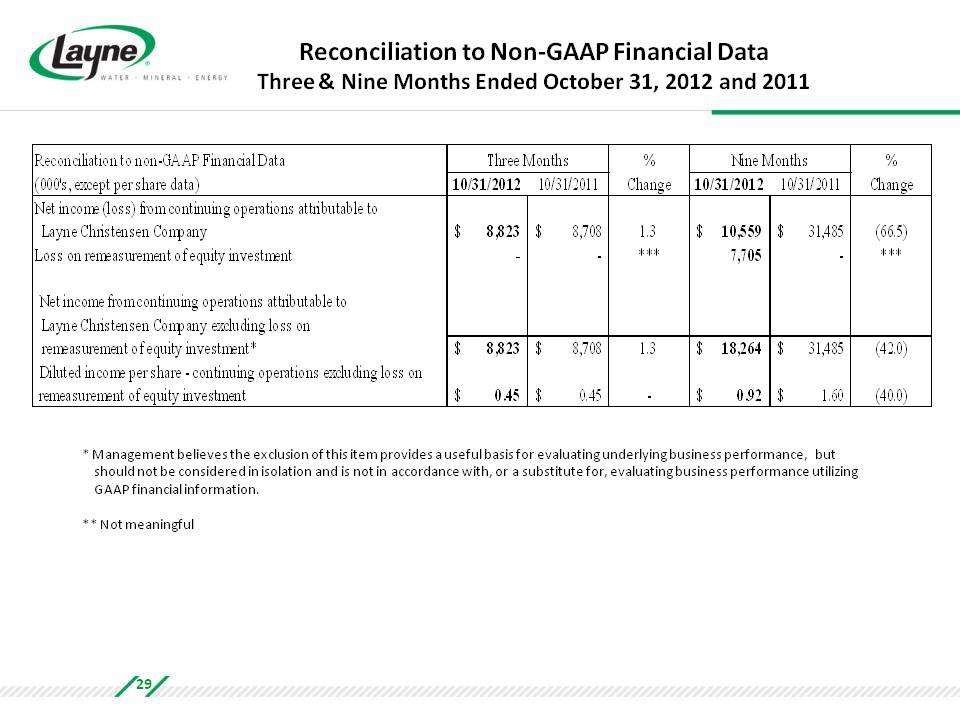
Reconciliation to Non‐GAAP Financial Data Three & Nine Months Ended October 31, 2012 and 2011 Reconciliation to non-GAAP Financial Data (000's, except per share data) Three Months 10/31/2012 10/31/2011 % Change Nine Months 10/31/2012 10/31/2011 % Change Net income (loss) from continuing operations attributable to Layne Christensen Company $ 8,823 $ 8,708 1.3 $ 10,559 $ 31,485 (66.5) Loss on remeasurement of equity investment - - *** 7,705 - *** Net income from continuing operations attributable to Layne Christensen Company excluding loss on remeasurement of equity investment* $ 8,823 $ 8,708 1.3 $ 18,264 $ 31,485 (42.0) Diluted income per share - continuing operations excluding loss on remeasurement of equity investment $ 0.45 $ 0.45 - $ 0.92 $ 1.60 $ (40.0) * Management believes the exclusion of this item provides a useful basis for evaluating underlying business performance, but should not be considered in isolation and is not in accordance with, or a substitute for, evaluating business performance utilizing GAAP financial information. ** Not meaningful 30