Attached files
| file | filename |
|---|---|
| 8-K - 8-K - Silver Bay Realty Trust Corp. | a13-6857_18k.htm |
Exhibit 99.1
|
|
SILVER BAY REALTY TRUST CORP. Fourth Quarter 2012 Investor Presentation |
|
|
SAFE HARBOR STATEMENT FORWARD-LOOKING STATEMENTS This presentation includes “forward-looking statements” within the meaning of the safe harbor provisions of the United States Private Securities Litigation Reform Act of 1995. Actual results may differ from expectations, estimates and projections and, consequently, readers should not rely on these forward-looking statements as predictions of future events. Words such as “expect,” “target,” “assume,” “estimate,” “project,” “budget,” “forecast,” “anticipate,” “intend,” “plan,” “may,” “will,” “could,” “should,” “believe,” “predicts,” “potential,” “continue,” and similar expressions are intended to identify such forward-looking statements. These forward looking statements involve significant risks and uncertainties that could cause actual results to differ materially from expected results. Factors that could cause actual results to differ include: adverse economic or real estate developments in Silver Bay’s target markets; defaults on, early terminations of or non-renewal of leases by residents; difficulties in identifying properties to acquire and completing acquisitions; increased time and/or expense to gain possession and renovate properties; Silver Bay’s failure to successfully operate acquired properties; the Company’s ability to obtain financing arrangements; general volatility of the markets in which we participate; interest rates and the market value of Silver Bay’s target assets; the impact of changes in governmental regulations, tax law and rates, and similar matters. Readers are cautioned not to place undue reliance upon any forward-looking statements, which speak only as of the date made. Silver Bay does not undertake or accept any obligation to release publicly any updates or revisions to any forward-looking statement to reflect any change in its expectations or any change in events, conditions or circumstances on which any such statement is based. Additional information concerning these and other risk factors is contained in Silver Bay’s most recent filings with the Securities and Exchange Commission. All subsequent written and oral forward looking statements concerning Silver Bay or matters attributable to Silver Bay or any person acting on its behalf are expressly qualified in their entirety by the cautionary statements above. |
|
|
BUSINESS OVERVIEW First publicly traded REIT focused on the acquisition, renovation, leasing and management of single-family properties Mission of bringing institutional excellence to the single-family rental market, providing residents with superior rental housing and best-in-class customer service Capitalize on generational opportunity created by dislocations in U.S. housing market Acquire single-family properties at significant discounts to replacement cost Focus on markets with strong demographic and macroeconomic indicators Diversified portfolio of more than 4,000(1) single-family properties in Arizona, California, Florida, Georgia, Nevada, North Carolina, Ohio and Texas Trading on NYSE provides investors liquidity and exposure to the single-family residential asset class PROPERTIES BY MARKET AS OF DECEMBER 31, 2012 Silver Bay recently entered Southeast Florida, Jacksonville, Florida, Columbus, Ohio and Houston, Texas, but did not own any homes in these markets as of December 31, 2012. (1) As of February 15, 2013, Silver Bay managed a portfolio of more than 4,000 single-family properties, including properties under contract. Phoenix 29% Tampa 24% Atlanta 18% Northern CA 8% Las Vegas 6% Tucson 5% Southern CA 4% Orlando 3% Charlotte 2% Dallas 1% |
|
|
CORE STRATEGY Provide high quality rental homes with best-in-class customer service to create a long-term sustainable business Achieve attractive total return profile combining capital appreciation with rental cash flow yields Properties acquired at significant discounts to replacement cost Estimate mid to high single digit annual capital appreciation over the next five to seven years for most of our markets Inflation protection Growth through an experienced and disciplined acquisition infrastructure Auction Broker Portfolio Capture efficiencies of scale as business grows Expand operating platform and generate efficiencies Establish a brand as the preferred manager within the single-family rental community Leverage G & A, reduce per unit operating expenses and lower cost of capital Institutionalize a highly fragmented industry SFR market is large Large opportunity to gain market share through better scale, service and cost of capital |
|
|
FORMATION AND HISTORY Completed IPO of 15.2 million common shares for net proceeds of $263 million, inclusive of over-allotment Simultaneously, combined portfolios of single-family homes owned by Two Harbors(1) and Provident Entities(2) Provident commenced acquisition of single-family properties in 2009 Launched with diverse portfolio September 2009: Provident Entities begin acquiring SFRs February 2012: Two Harbors begins acquiring SFRs December 19, 2012: SBY completes its formation transactions and IPO February 15, 2013: SBY portfolio exceeds 4,000 SFRs Silver Bay acquired (1) Silver Bay Property Investment LLC (formerly Two Harbors Property Investment LLC), a wholly owned subsidiary of Two Harbors Investment Corp. We refer to Silver Bay Property Investment LLC as our Predecessor. (2) Silver Bay acquired five limited liability companies managed by Provident Real Estate Advisors LLC that we refer to as the Provident Entities. |
|
|
HISTORIC MARKET OPPORTUNITY (1) Source: U.S. Census Bureau. Note: Correlation since 1988 between the U.S. median asking rent and the U.S. median asking home sales price. (2) “MSA” means Metropolitan Statistical Areas, which is generally defined as one or more adjacent counties or county equivalents that have at least one urban core area of at least a 50,000-person population, plus adjacent territory that has a high degree of social and economic integration with the core as measured by commuting ties. Peak refers to highest historical home prices in a particular market. Trough refers to lowest home prices in a particular market since the peak. (3) MSA used for Northern California is Fairfield-Vallejo, which most closely approximates the geographic area in which we purchase homes in Northern California. This MSA is comprised of Solano County and the most populous cities in the MSA are Vallejo, Fairfield, Vacaville, Suisun and Benicia. MSA used for Southern California is Riverside-San Bernardino-Ontario. This MSA is comprised of Riverside and San Bernardino Counties and the most populous cities in the MSA are Riverside, San Bernardino, Fontana and Moreno. MSA used for Southeast FL is Fort Lauderdale-Pompano Beach-Deerfield Beach, FL. Macro housing trends point to a compelling single-family rental investment thesis U.S. real housing prices have fallen ~33% from their peak in 2006 Home affordability is at all-time high, but many are unable to qualify for a mortgage, thus rental demand is strong Overhang of shadow inventory creates strong potential acquisition pipeline Over 5 million mortgages in some form of delinquency or foreclosure, roughly double normalized levels Market recovery in early stages Signs of housing stabilization underway, but significant number of houses remain at levels below replacement cost Declining foreclosures and delinquencies >92% correlation(1) between rental rates and home sales prices Fragmented market in need of institutional platform Attractive current yields and discount to replacement cost in certain markets suggest a compelling total return story Supply constraint as household formations have exceeded housing starts since 2010 MSA HOME PRICE APPRECIATION (“HPA”)(2) SOURCE: CORELOGIC AS OF DECEMBER 31, 2012 MARKET HPA (Peak to Trough)(2) HPA (Peak to Current) HPA (Prior 12 months) HPA (Prior 3 months) Phoenix, AZ -53% -41% 23% 3% Tucson, AZ -43% -37% 9% -1% Northern CA(3) -61% -55% 14% 5% Southern CA(3) -54% -48% 11% 4% Jacksonville, FL -41% -34% 8% 4% Orlando, FL -56% -47% 11% 2% Southeast FL(3) -54% -47% 9% 1% Tampa, FL -49% -44% 6% 1% Atlanta, GA -34% -27% 6% -1% Charlotte, NC -17% -12% 5% -1% Las Vegas, NV -60% -54% 15% 3% Columbus, OH -19% -13% 5% -1% Dallas, TX -15% -9% 4% -% Houston, TX -14% -6% 4% 1% NATIONAL -33% -27% 8% -% |

|
|
HOUSING MARKET OVERVIEW U.S. housing stock as of the first quarter of 2012 was an estimated $16.4 trillion market with over 130 million housing units(1) Approximately 40.6 million rental units, of which 11.1 million are single-family rental units(2) Though fragmented, existing single-family rental market is estimated to be approximately half of the size of the multi-family rental sector Institutional ownership of single-family rentals is still estimated to be only 2-3% and pricing remains attractive Source: Federal Reserve Board’s Flow of Funds Accounts. (2) John Burns Real Estate Consulting (“JBREC”) calculations, white papers, and estimates of 2012 data using 2010 & 2011 CB figures. 132.8mm Housing Units 40.6mm Rented 13.6mm Individually Owned Rentals 25.1mm Multi-family Units 2.5mm Condo 11.1mm Single-family Rentals(2) 1.9mm Mobile Homes |
|
|
STRONG DEMAND FOR RENTAL PROPERTIES(1) Housing is very affordable by historical standards; however, constraints in the credit markets prevent many potential homeowners from getting a mortgage Housing starts remain low vs. historical standards Family rentals will continue to be viable alternative to purchase (1) Sources: National Association of Realtors & Bankrate.com, Inside Mortgage Finance and Zelman & Associates. (2) Department of Commerce, U.S. Census Bureau. PERCENTAGE OF HOMEOWNERS VERSUS RENTERS(2) 29% 30% 31% 32% 33% 34% 35% 63% 64% 65% 66% 67% 68% 69% 70% Mar-00 Dec-00 Sep-01 Jun-02 Mar-03 Dec-03 Sep-04 Jun-05 Mar-06 Dec-06 Sep-07 Jun-08 Mar-09 Dec-09 Sep-10 Jun-11 Mar-12 Dec-12 Rental Rate Homeownership Rate HOMEOWNERSHIP RATE RENTAL RATE |
|
|
HOUSING MARKET UPDATE Silver Bay target markets remain attractive for acquisition and rental Housing prices remain cheap to replacement cost and affordability metrics 2012 housing prices increased across all Silver Bay target markets Fourth quarter 2012 housing price indices roughly flat to low single digit appreciation Relative strength in the distressed/REO segment Housing supply is large and shadow inventory remains elevated Demographic factors highly favorable to demand; household formations increased to ~1 million(1) on an annualized basis New building activity increased in recent months, but is still historically low Anticipate upward pressure on housing prices as demand exceeds supply Price reversion to replacement cost favorable to total return profile (1) Source: U.S. Census Bureau as of January 29, 2013. |
|
|
RESIDENTIAL RECOVERY LAG (1) Source: Green Street Advisors: http://www.greenstreetadvisors.com (2) Represents S&P/Case-Shiller Composite 20 Home Price Index (Not Seasonally Adjusted). Source: Bloomberg. +19.7% (27.9%) (1) (2) INDEXED COMMERCIAL PROPERTIES AND APARTMENTS VS. SINGLE-FAMILY RETURNS +29.6% (1) COMMERCIAL PROPERTY PRICE INDEX ALL PROPERTY TYPES(1) COMMERCIAL PROPERTY PRICE INDEX (APARTMENT)(1) CASE SHILLER COMPOSITE(2) 40.0% 30.0% 20.0% 10.0% 0.0% -10.0% -20.0% -30.0% -40.0% Jan-06 Jul-06 Jan-07 Jul-07 Jan-08 Jul-08 Jan-09 Jul-09 Jan-10 Jul-10 Jan-11 Jul-11 Jan-12 Jul-12 |
|
|
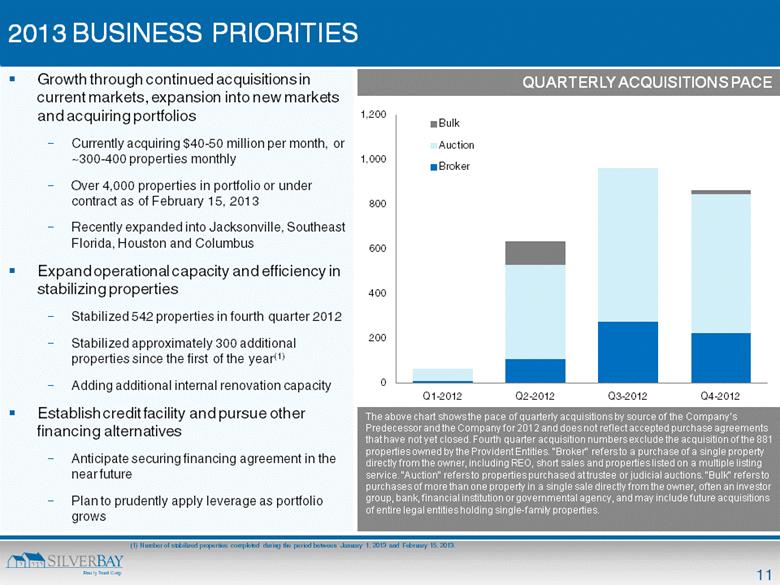
2013 BUSINESS PRIORITIES Growth through continued acquisitions in current markets, expansion into new markets and acquiring portfolios Currently acquiring $40-50 million per month, or ~300-400 properties monthly Over 4,000 properties in portfolio or under contract as of February 15, 2013 Recently expanded into Jacksonville, Southeast Florida, Houston and Columbus Expand operational capacity and efficiency in stabilizing properties Stabilized 542 properties in fourth quarter 2012 Stabilized approximately 300 additional properties since the first of the year(1) Adding additional internal renovation capacity Establish credit facility and pursue other financing alternatives Anticipate securing financing agreement in the near future Plan to prudently apply leverage as portfolio grows QUARTERLY ACQUISITIONS PACE The above chart shows the pace of quarterly acquisitions by source of the Company’s Predecessor and the Company for 2012 and does not reflect accepted purchase agreements that have not yet closed. Fourth quarter acquisition numbers exclude the acquisition of the 881 properties owned by the Provident Entities. "Broker" refers to a purchase of a single property directly from the owner, including REO, short sales and properties listed on a multiple listing service. "Auction" refers to properties purchased at trustee or judicial auctions. "Bulk" refers to purchases of more than one property in a single sale directly from the owner, often an investor group, bank, financial institution or governmental agency, and may include future acquisitions of entire legal entities holding single-family properties. (1) Number of stabilized properties completed during the period between January 1, 2013 and February 15, 2013. |
|
|
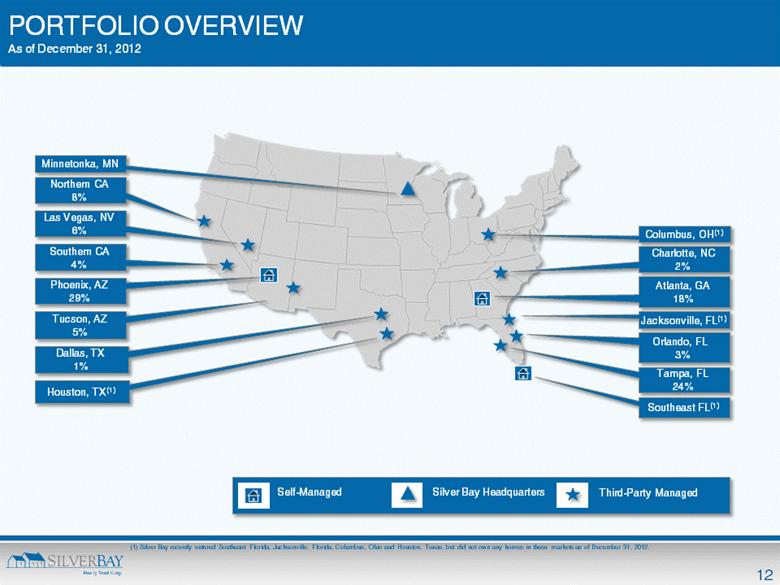
Charlotte, NC 2% PORTFOLIO OVERVIEW As of December 31, 2012 Atlanta, GA 18% Orlando, FL 3% Phoenix, AZ 29% Northern CA 8% Las Vegas, NV 6% Dallas, TX 1% Tucson, AZ 5% Tampa, FL 24% Silver Bay Headquarters Southern CA 4% Jacksonville, FL(1) Southeast FL(1) Minnetonka, MN Columbus, OH(1) Self-Managed Houston, TX(1) Third-Party Managed (1) Silver Bay recently entered Southeast Florida, Jacksonville, Florida, Columbus, Ohio and Houston, Texas, but did not own any homes in these markets as of December 31, 2012. |
|
|
PORTFOLIO OF SINGLE-FAMILY PROPERTIES The following table provides a summary of Silver Bay’s portfolio of single-family properties as of December 31, 2012. Market Number of Properties Aggregate Cost Basis(1) (thousands) Average Cost Basis Per Property (thousands) Average Age(2) (in years) Average Square Footage Number of Leased Properties Number of Vacant Properties(3) Average Monthly Rent for Leased Properties(4) Phoenix 1,002 $ 127,308 $ 127 17.9 1,717 592 410 $ 1,041 Tampa 816 99,779 122 21.9 1,675 401 415 1,261 Atlanta 607 67,674 111 14.9 2,089 313 294 1,191 Northern CA(5) 256 43,323 169 40.6 1,418 113 143 1,457 Las Vegas 213 27,255 128 13.4 1,742 77 136 1,151 Tucson 186 14,334 77 38.8 1,343 112 74 828 Southern CA(6) 149 18,161 122 38.6 1,364 13 136 1,208 Orlando 90 13,001 144 18.0 1,889 71 19 1,318 Charlotte 60 7,181 120 9.7 2,035 12 48 1,058 Dallas 26 2,546 98 17.8 1,784 1 25 1,250 Totals 3,405 $ 420,562 $ 124 21.7 1,727 1,705 1,700 $ 1,148 (1) Aggregate cost includes all capitalized costs, determined in accordance with GAAP, incurred through December 31, 2012 for the acquisition, stabilization, and significant post-stabilization renovations of properties, including land, building, possession costs and renovation costs. Aggregate cost does not include accumulated depreciation. At completion of the Formation Transactions, Silver Bay’s Predecessor’s properties were recorded at an aggregated carryover net book value cost basis because Silver Bay Property is our predecessor. The Provident Entities’ properties aggregated cost basis was $117.9 million, which represents the fair market value of properties at the formation date due to the contribution of Provident Entities’ property being considered an acquisition subject to purchase accounting for accounting purposes. (2) As of December 31, 2012, approximately 29% of the properties in the combined portfolio were less than 10 years old, 27% were between 10 and 20 years old, 16% were between 20 and 30 years old, 15% were between 30 and 40 years old, 5% were between 40 and 50 years old, and 8% were more than 50 years old. (3) A significant portion of the properties were purchased within the last six months and are still undergoing stabilization. Total number of vacant properties includes properties in the process of stabilization as well as those available for lease. (4) Average monthly rent for leased properties was calculated as the average of the contracted monthly rent for all leased properties as of December 31, 2012. To date, rent concessions have been utilized on a limited basis and have not had a significant impact on Silver Bay’s average monthly rent. If the use of rent concessions or other leasing incentives increases in the future, they may have a greater impact by reducing the average monthly rent we receive from leased properties. (5) Northern California market currently consists of Contra Costa, Napa, Sacramento and Solano Counties. (6) Southern California market currently consists of Colton, Riverside and San Bernardino Counties. |
|
|
PORTFOLIO SUMMARY OF STABILIZED PROPERTIES AND THOSE OWNED SIX MONTHS OR LONGER The following table summarizes Silver Bay’s stabilized properties and those owned six months or longer as of December 31, 2012. STABILIZED PROPERTIES PROPERTIES OWNED AT LEAST SIX MONTHS Market Number of Stabilized Properties(1) Properties Leased Properties Vacant Occupancy Rate Average Monthly Rent for Leased Stabilized Properties(2) Properties Owned 6 Months or Longer Properties Leased Properties Vacant Occupancy Rate Average Monthly Rent for Properties Owned at Least 6 Months(3) Phoenix 648 592 56 91% $ 1,041 551 481 70 87% $ 1,030 Tampa 409 401 8 98% 1,261 426 359 67 84% 1,258 Atlanta 318 313 5 98% 1,191 302 243 59 80% 1,185 Northern CA 113 113 - 100% 1,457 52 35 17 67% 1,554 Las Vegas 81 77 4 95% 1,151 101 57 44 56% 1,155 Tucson 112 112 - 100% 828 78 76 2 97% 828 Southern CA 13 13 - 100% 1,208 21 10 11 48% 1,209 Orlando 72 71 1 99% 1,318 52 51 1 98% 1,357 Charlotte(4) 12 12 - 100% 1,058 - - - - - Dallas(4) 1 1 - 100% 1,250 - - - - - Totals 1,779 1,705 74 96% $ 1,148 1,583 1,312 271 83% $ 1,143 (1) We define stabilized properties as those that we have acquired, renovated, marketed and leased for the first time. Properties acquired with in-place leases are considered stabilized. (2) Average monthly rent for leased stabilized properties was calculated as the average of the contracted monthly rent for all stabilized properties as of December 31, 2012. To date, rent concessions have been utilized on a limited basis and have not had a significant impact on Silver Bay’s average monthly rent. If the use of rent concessions or other leasing incentives increases in the future, they may have a greater impact by reducing the average monthly rent we receive from leased properties. (3) Average monthly rent for properties owned at least six months was calculated as the average of the contracted monthly rent for all properties owned at least six months as of December 31, 2012. To date, rent concessions have been utilized on a limited basis and have not had a significant impact on Silver Bay’s average monthly rent. If the use of rent concessions or other leasing incentives increases in the future, they may have a greater impact by reducing the average monthly rent we receive from leased properties. (4) As of December 31, 2012, there were no properties owned six months or longer in these markets. |
|
|
ACQUISITION STRATEGY / PROCESS MSA Evaluation Neighborhood Evaluation Property Assessment Renovation Assessment Rental and Resident Evaluation Macroeconomic and demographic factors Analyze a variety of local market trends Physical visits whenever possible Vintage and location; price vs. estimated replacement costs Property / home characteristics Proximity to key employment centers and other properties in portfolio, ease of transportation and commute, school districts, etc. Renovation required vs. acquisition price Focus on attractive risk-adjusted net rental yields and minimizing future maintenance Assessment of rental rates and potential resident pool availability Estimates of time to stabilize and vacancy cost |
|
|
PROPERTY STABILIZATION PROCESS Inspection and Possession Renovation Marketing and Leasing Property inspections Changing locks on vacant homes Legal process to possession Strategy focused on creating market specific rental standards with a focus on reducing future maintenance expenses Estimated cost of approximately 15% of purchase price Actual cost depends on market, age and condition of property Underwriting accuracy derives from experience renovating thousands of homes Volume pricing from contractors and discounts through local and national buying programs provide cost savings Multiple channels including real estate brokers, newspaper ads, yard signage, and website marketing Maintaining high quality resident screening process critical to reducing evictions, future turnover and associated costs Estimated time for the property stabilization process of approximately six months |
|
|
INVESTOR RELATIONS CONTACTS ANH HUYNH | Director of Investor Relations ahuynh@silverbaymgmt.com MARIA COZINE | Investor Relations Associate mcozine@silverbaymgmt.com SILVER BAY REALTY TRUST CORP. 601 Carlson Parkway | Suite 250 Minnetonka | MN | 55305 952.358.4400 Investors@silverbaymgmt.com CORPORATE HEADQUARTERS |