Attached files
| file | filename |
|---|---|
| 8-K - CURRENT REPORT - QUAKER CHEMICAL CORP | v337303_8k.htm |
| EX-99.1 - EXHIBIT 99.1 - QUAKER CHEMICAL CORP | v337303_ex99-1.htm |

1 Quaker Chemical Corporation Investor Conference Call March 7, 2013 Fourth Quarter and Full Year 2012 Results

2 Regulation G The attached charts include Company information that does not conform to generally accepted accounting principles (GAAP). Management believes that an analysis of this data is meaningful to investors because it provides insight with respect to ongoing operating results of the Company and allows investors to better evaluate the financial results of the Company. These measures should not be viewed as an alternative to GAAP measures of performance. Furthermore, these measures may not be consiste nt with similar measures provided by other Companies. This data should be read in conjunction with the Company’s fourth quarter and full year earnings news release dated March 6, 2013, which has been furnished to the SEC on Form 8-K, and the Company’s Form 10-K for the year ended December 31, 2012, which has been filed with the SEC. Forward-Looking Statements This presentation may contain forward-looking statements that are subject to certain risks and uncertainties that could cause actual results to differ materiall y from those projected in such statements. A major risk is that the Company’s demand is largely derived from the demand for its customers’ products, which subjects the Company to downturns in a customer’s business and unanticipated customer production shutdowns. Other major risks and uncertainties include, but are not limited to, significant increases in raw material costs, customer financial stability, worldwide economic and political conditions, foreign currency fluctuations, future terrorist attacks and other acts of violence. Other factors could also adversely affect us. Therefore, we caution you not to place undue reliance on our forward-looking statements. This discussion is provided as permitted by the Private Securities Litigation Reform Act of 1995. Risks and Uncertainties Statement
3 Speakers Michael F. Barry Chairman of the Board, Chief Executive Officer & President Margaret M. Loebl Vice President, Chief Financial Officer & Treasurer Robert T. Traub General Counsel Chart #1

4 Full Year 2012 Headlines • Record full year 2012 revenue and net income despite challenging environment • Full year 2012 record cash flow generation enhances strong balance sheet • 41% shareholder return in full year 2012 Memo: Change in Accounting Method During 2012, the Company acquired an increased ownership percent age in Primex, Ltd. (“Primex”), a captive insurance company. Due to the increased ownership percentage and other factors, the Company changed its method of accounting for its investment in Primexfrom the cost method to the equity method of accounting. As a result, the Company recast its Consolidated Balance Sheet, its Consolidated Statement of Income and its Consolidated Statement of Cash Flows for the fourth quarter and year ended December 31, 2011. The change in accounting method increased net income attributable to Quaker Chemical Corporation by $0.4 million and $0.6 million for the fourth quarters of 2012 and 2011, respectively, and by $1.8 million and $2.3 million for the full years 2012 and 2011, respectively. Chart #2

5 Chairman Comments ▪ Positives x Gross margin strength / raw material stabilization x Diversification with geographic footprint x Taking market share x Leveraging acquisitions ▪ Negatives x Typical seasonal trends x Weak market conditions in Europe and Brazil x Foreign exchange Fourth Quarter 2012 Chart #3

6 Product Volume by Quarter 25,000 30,000 35,000 40,000 45,000 50,000 55,000 4Q08 YTD Avg. 1Q09 2Q09 3Q09 4Q09 1Q10 2Q10 3Q10 4Q10 1Q11 2Q11 3Q11 4Q11 1Q12 2Q12 3Q12 4Q12 Metalworking Process Chemicals Segment Chart #4

7 Financial Snapshot Q4 2011 Recast Q4 2012 Full Year 2011 Recast Full Year 2012 Net Sales ($Mils.) 173.3 172.9 683.2 708.2 Gross Margin (%) 32.7 34.2 32.6 33.7 Operating Margin (%) 6.6 7.9 8.5 8.9 Net Income attributable to Quaker Chemical Corporation ($Mils.) * 10.4 13.0 45.9 47.4 Adjusted EBITDA ($Mils.) – Trailing Twelve Months 73.0 80.9 73.0 80.9 Adjusted EBITDA Margin (%) 10.7 11.4 10.7 11.4 Earnings Per Diluted Share * 0.80 0.99 3.66 3.63 Debt ($Mils.) 47.3 31.5 47.3 31.5 Equity ($Mils.) * 261.4 289.7 261.4 289.7 * Note: Includes equity income from the Company’s investment in a captive insurance company. Chart #5

8 Gross Margin Percentage 32.7% 34.2% 32.6% 33.7% 30.0% 31.0% 32.0% 33.0% 34.0% 35.0% Q4 2011 Q4 2012 2011 2012 Gross Margin Percentage Chart #6

9 Baseline Historical Performance $40.1 $44.2 $66.5 $73.0 $80.9 6.90% 9.80% 12.20% 10.70% 11.40% 2008 2009 2010 2011 2012 Adjusted EBITDA ($ Mils.) Adjusted EBITDA Margin (%) Chart #7
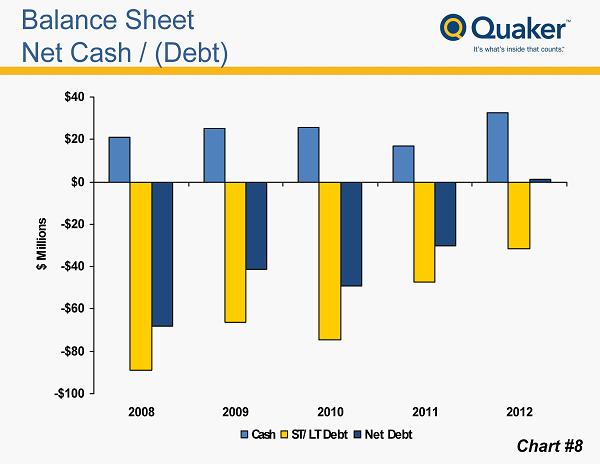
10 Balance Sheet Net Cash / (Debt) -$100 -$80 -$60 -$40 -$20 $0 $20 $40 2008 2009 2010 2011 2012 $ Millions Cash ST/LT Debt Net Debt Chart #8

11 Net Cash Flow From Operations 13.4 41.6 37.5 19.7 62.9 0 10 20 30 40 50 60 70 2008 2009 2010 2011 2012 $ Millions Chart #9

12 APPENDIX
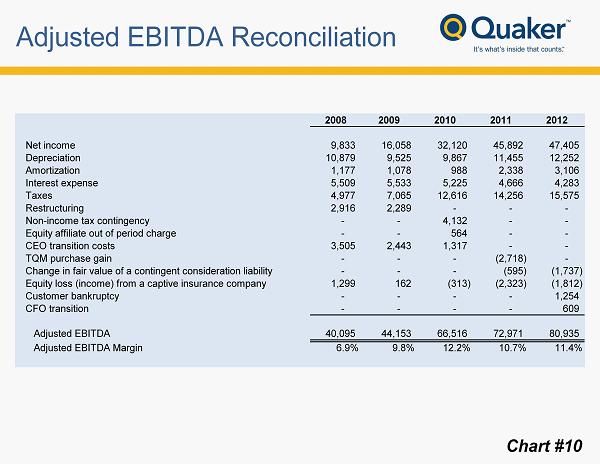
13 Adjusted EBITDA Reconciliation 2008 2009 2010 2011 2012 Net income 9,833 16,058 32,120 45,892 47,405 Depreciation 10,879 9,525 9,867 11,455 12,252 Amortization 1,177 1,078 988 2,338 3,106 Interest expense 5,509 5,533 5,225 4,666 4,283 Taxes 4,977 7,065 12,616 14,256 15,575 Restructuring 2,916 2,289 - - - Non-income tax contingency - - 4,132 - - Equity affiliate out of period charge - - 564 - - CEO transition costs 3,505 2,443 1,317 - - TQM purchase gain - - - (2,718) - Change in fair value of a contingent consideration liability - - - (595) (1,737) Equity loss (income) from a captive insurance company 1,299 162 (313) (2,323) (1,812) Customer bankruptcy - - - - 1,254 CFO transition - - - - 609 Adjusted EBITDA 40,095 44,153 66,516 72,971 80,935 Adjusted EBITDA Margin 6.9% 9.8% 12.2% 10.7% 11.4% Chart #10