Attached files
| file | filename |
|---|---|
| 8-K - FORM 8-K - United Airlines Holdings, Inc. | d494773d8k.htm |
 J.P.
Morgan Aviation,
Transportation and
Defense Conference
United Continental Holdings, Inc.
March 4, 2013
Exhibit 99.1 |
 Chairman, President and CEO
Jeff Smisek |
| Safe
Harbor Statement 3
Certain statements included in this presentation are forward-looking and thus reflect our current
expectations and beliefs with respect to certain current and future events and financial
performance. Such forward-looking statements are and will be subject to many risks and
uncertainties relating to our operations and business environment that may cause actual results
to differ materially from any future results expressed or implied in such forward-looking
statements. Words such as “expects,” “will,” “plans,”
“anticipates,” “indicates,” “believes,” “forecast,” “guidance,”
“outlook” and similar expressions are intended to identify forward-looking statements.
Additionally, forward-looking statements include statements which do not relate solely
to historical facts, such as statements which identify uncertainties or trends, discuss the
possible future effects of current known trends or uncertainties or which indicate that the
future effects of known trends or uncertainties cannot be predicted, guaranteed or assured. All forward-
looking statements in this report are based upon information available to us on the date of this report.
We undertake no obligation to publicly update or revise any forward-looking statement,
whether as a result of new information, future events, changed circumstances or otherwise, except
as required by applicable law. Our actual results could differ materially from these forward-looking statements due to numerous
factors including, without limitation, the following: our ability to comply with the terms of our
various financing arrangements; the costs and availability of financing; our ability to maintain
adequate liquidity; our ability to execute our operational plans; our ability to control our
costs, including realizing benefits from our resource optimization efforts, cost reduction
initiatives and fleet replacement programs; our ability to utilize our net operating losses; our ability
to attract and retain customers; demand for transportation in the markets in which we operate; an
outbreak of a disease that affects travel demand or travel behavior; demand for travel and the
impact that global economic conditions have on customer travel patterns; excessive taxation and
the inability to offset future taxable income; general economic conditions (including interest
rates, foreign currency exchange rates, investment or credit market conditions, crude oil prices, costs of
aircraft fuel and energy refining capacity in relevant markets); our ability to cost-effectively
hedge against increases in the price of aircraft fuel; any potential realized or unrealized gains
or losses related to fuel or currency hedging programs; the effects of any hostilities, act of
war or terrorist attack; the ability of other air carriers with whom we have alliances or
partnerships to provide the services contemplated by the respective arrangements with such carriers; the
costs and availability of aviation and other insurance; industry consolidation or changes in airline
alliances; competitive pressures on pricing and demand; our capacity decisions and the capacity
decisions of our competitors; U.S. or foreign governmental legislation, regulation and other
actions; labor costs; our ability to maintain satisfactory labor relations and the results of the
collective bargaining agreement process with our union groups; any disruptions to operations due
to any potential actions by our labor groups; weather conditions; the possibility that expected
merger synergies will not be realized or will not be realized within the expected time period; and other
risks and uncertainties set forth under Item 1A, Risk Factors, of the Company’s Annual
Report on Form 10-K, as well as other risks and uncertainties set forth from time to time in
the reports we file with the SEC.
|
 4
U.S. airline industry continues to transform
Less fragmentation
Capacity discipline
Unbundled fares and value-add products
Stronger balance sheets
Return-focused management teams |
 We’ve built the foundation for the new United
5 |
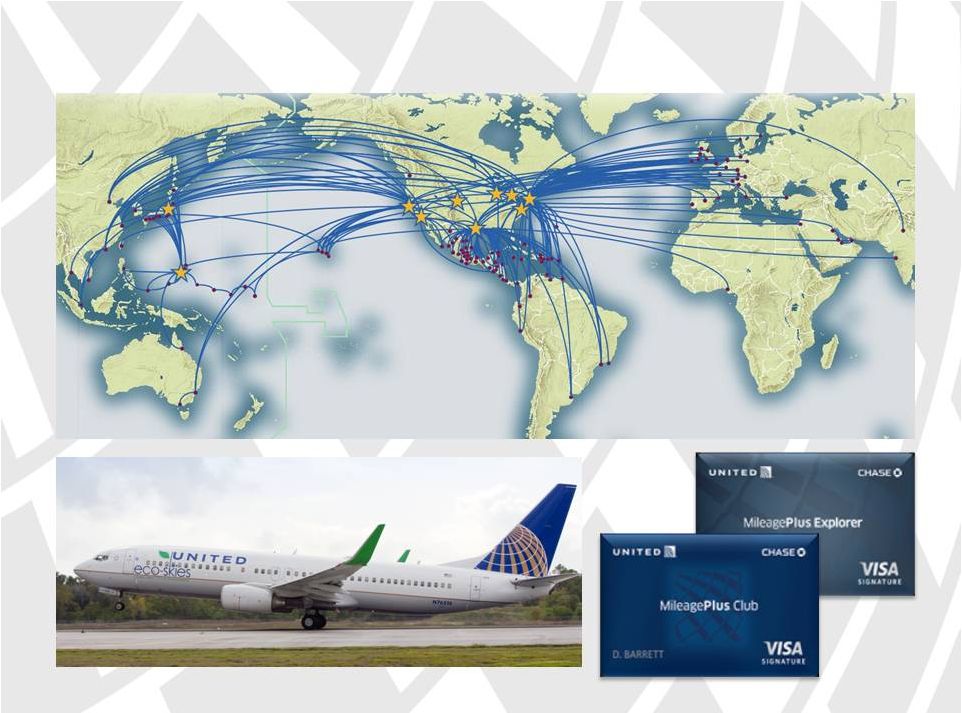 We’re leveraging United’s best-in-class assets
6 |
 Deliver ROIC of
greater than
10%
Deliver great
customer
experience
Deliver
operational
reliability
7
We have three priorities for 2013 |
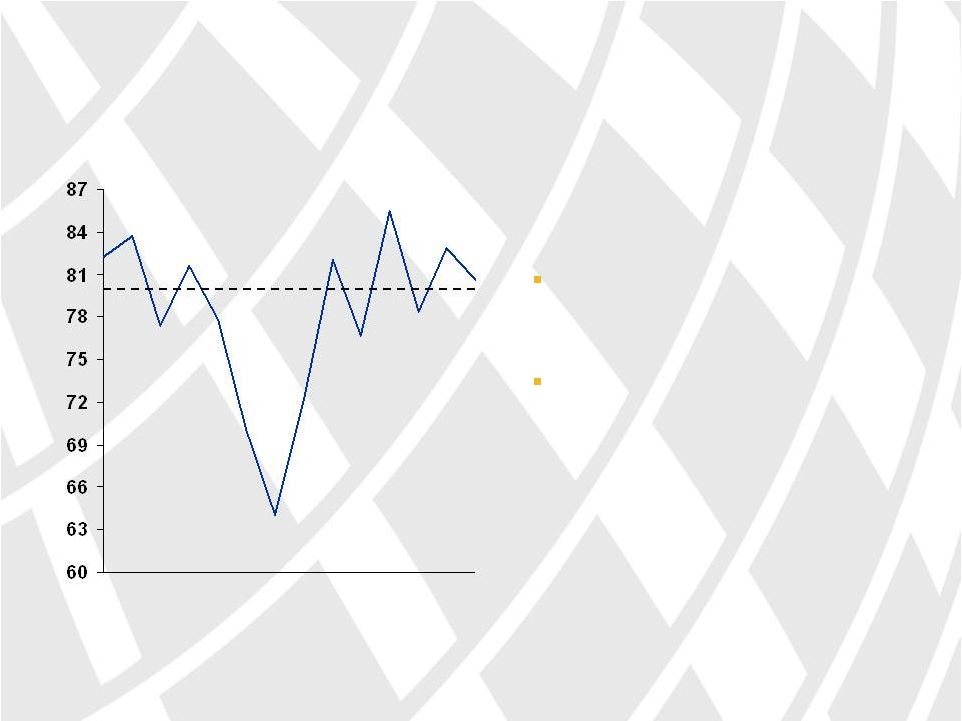 Arrival
:14
Performance
Jan
2013
Nov
Sep
Jul
May
Mar
Jan
2012
Goal: 80%
1.
Percentage of domestic mainline flights arriving within 14 minutes of scheduled
arrival 2.
Percentage of consolidated mainline flights which arrive to destinations,
excluding those canceled due to weather 8
Running a reliable airline is critical to the bottom line
A:14 performance above 80%
goal since September 2012
Year-to-date controllable
completion factor
at 99.6%
2
1 |
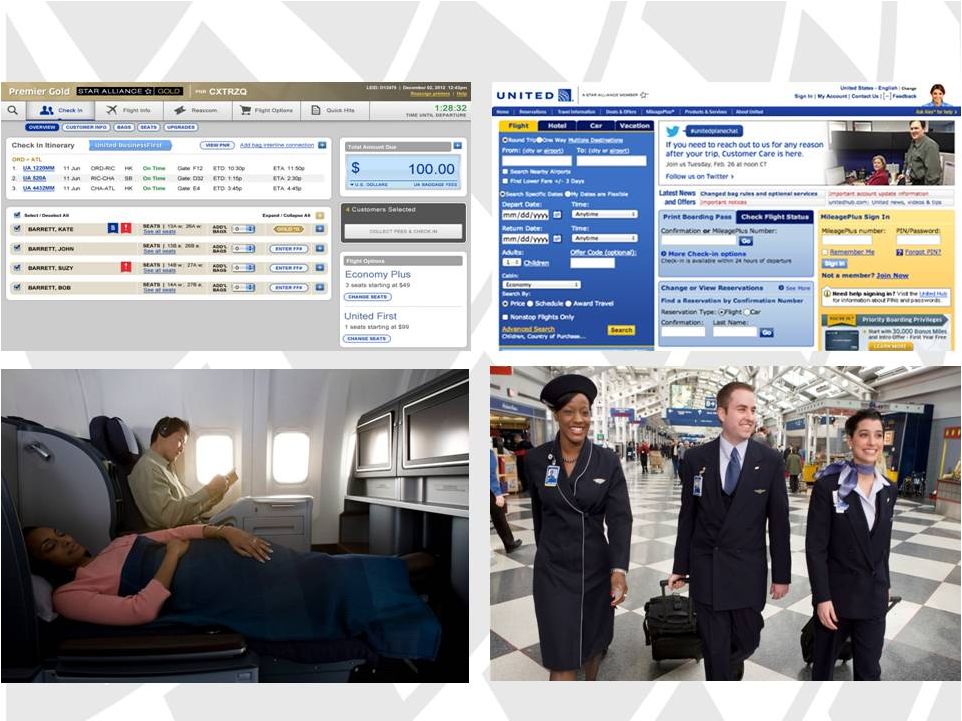
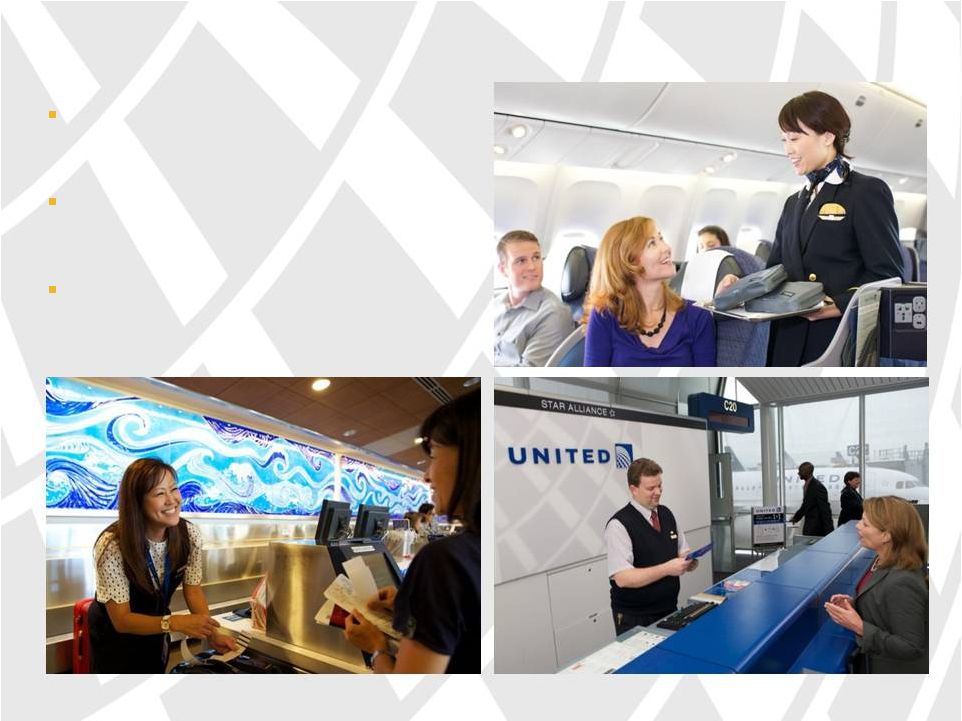 Giving
great customer service is core to United 9
Providing co-workers the tools
and training to give great service
Offering customers a friendly and
engaging experience on United
Going the extra mile for our
customers |
 On
the ground Global Satellite
Wi-Fi
In the air
In our technology
We’re investing in the customer experience, making travel
easier and more comfortable than ever
10
New United Club
in ORD T-2 |
 Customer Satisfaction Scores
11
Customers are experiencing United’s improved
operations, service levels and product offering
Customer satisfaction scores
increasing from summer low
Positive feedback from our
corporate advisory board
members on the improvements
Note: Net Promoter Score methodology: % of customers satisfied - % of customers dissatisfied
|
 12
We’re taking action to recover our revenue premium
Jan 13
4Q12
3Q12
2Q12
1Q12
UAL
PRASM
Gap
vs.
Peers
1.
UAL year-over-year PRASM percentage points H/(L) vs. A4A ex-UAL
Recovering temporarily reduced
corporate market share
Using consolidated network
demand history to make better
revenue management decisions
Investing in united.com and
mobile app functionality
Growing ancillary revenue
1 |
 13
Economy Plus
Global Satellite Wi-Fi
We’re growing ancillary revenue
2013 Goal: Grow ancillary revenue / passenger by 9%
Premium cabin upgrade
Improve how we offer existing
products and services
Introduce new value-add
products and services |
 Source: SEC filings and investor updates
We’re managing all aspects of the business with discipline
(1.0%)
(1.5%)
(0.2%)
Consolidated Capacity
Year-over-Year % Change in ASMs
2011
2012
2013E
0%
14
Fleet Flexibility
Measured approach to aircraft
replacement
Expect fleet count to remain
roughly flat over next five years
1
1.
Capacity guidance from UAL Investor Update Jan. 24, 2013
|
 Note: Results prior to 4Q 2010 pro forma; Debt outstanding includes on balance
sheet debt and capital leases; 2013E interest expense is midpoint of non-
operating expense guidance in January 24, 2013 Investor Update
Interest Expense
($B)
Debt Outstanding
($B)
12.4
13.2
12.7
15.1
15
We’ve strengthened the balance sheet by reducing debt
outstanding by 18% since 2010
0.8
0.9
1.0
2013E
~0.7
2012
2011
2010
Source: Earnings releases, SEC filings and January 2013 Investor Update. |
 Return on Invested Capital (ROIC)
16
We’re managing United for returns
Note: Results prior to 4Q 2010 pro forma
Source: Earnings releases and SEC filings
Route analysis and
network optimization
Fleet decisions
Capital investments and
allocation
Executive compensation |
 Deliver ROIC of
greater than
10%
Deliver great
customer
experience
Deliver
operational
reliability
17
By achieving these priorities in 2013, United will create
economic value and a solid base for future performance |