Attached files
| file | filename |
|---|---|
| 8-K - 8-K - TEMPUR SEALY INTERNATIONAL, INC. | d494525d8k.htm |
 1
******************************************************************************************
******************************************************************************************
******************************************************************************************
******************************************************************************************
******************************************************************************************
Exhibit 99.1 |
 Note
Regarding Trademarks, Trade Names and Service Marks: Tempur, Tempur-Pedic,
TEMPUR-Cloud Collection, TEMPUR-Cloud Select,
TEMPUR-Cloud Supreme, TEMPUR-Cloud Supreme Breeze,
TEMPUR-Cloud Luxe, TEMPUR-Cloud Allura, TEMPUR-Cloud Luxe Breeze,
TEMPUR-Choice Collection, TEMPUR-Choice Supreme, TEMPUR-Choice Luxe, TEMPUR-Weightless Collection, TEMPUR-
Weightless Select, TEMPUR-Weightless Supreme, TEMPUR-Contour Collection,
TEMPUR-Contour, TEMPUR-Contour Select, TEMPUR-Contour Signature, TEMPUR-Rhapsody, TEMPUR-Rhapsody Breeze,
TEMPUR-Allura, GrandBed, TEMPUR-Simplicity Collection, TEMPUR Original
Collection, TEMPUR Sensation Collection, TEMPUR-Ergo Advanced System, TEMPUR-Ergo Premier, TEMPUR-Cloud Pillow,
TEMPUR-Neck Pillow, TEMPUR-Symphony Pillow, TEMPUR-Comfort Pillow,
TEMPUR-Rhapsody Pillow, and TEMPUR-Traditional Pillow are trademarks, trade names or service marks of Tempur-Pedic
International Inc. and its subsidiaries.
Sealy, Sealy Posturepedic, Stearns & Foster, and Optimum are trademarks, trade
names or service marks of Sealy Corporation and its subsidiaries. All other trademarks, trade names and service marks in
this presentation are the property of the respective owners.
Forward-Looking Statements
2
This presentation contains "forward-looking statements,”
within the meaning of federal securities laws, which include information concerning
one or more of the Company's plans, objectives, goals, strategies, and
other information that is not historical information. When used in this
release, the words "estimates," "expects,"
"anticipates," "projects," "plans," “proposed,”
"intends," "believes," and variations of such words or similar
expressions are intended to identify forward-looking statements. These
forward-looking statements include, without limitation, statements relating to the Company’s proposed
initiatives and product introductions; the Company’s growth potential and
strong brand; the proposed merger with Sealy Corporation, including
expectations regarding earnings accretion, cost synergies and revenue synergies,
and the ability to invest in key growth areas and rapidly delever the
combined company; and expectations regarding the Company’s net sales and
adjusted EPS for 2013. All forward looking statements are based upon current
expectations and beliefs and various assumptions. There can be no assurance that the Company will realize these expectations or that these
beliefs will prove correct.
Numerous factors, many of which are beyond the Company's control, could cause
actual results to differ materially from those expressed as forward-
looking
statements.
These
risk
factors
include
general
economic,
financial
and
industry
conditions,
particularly
in
the
retail
sector,
as
well
as
consumer
confidence and the availability of consumer financing; uncertainties arising from
global events; the effects of changes in foreign exchange rates on the
Company’s reported earnings; consumer acceptance of the Company’s
products; industry competition; the efficiency and effectiveness of the Company’s
advertising campaigns and other marketing programs; the Company’s ability to
increase sales productivity within existing retail accounts and to further
penetrate the Company’s retail channel, including the timing of opening or
expanding within large retail accounts; the Company’s ability to expand brand
awareness, distribution and new products; the Company’s ability to
continuously improve and expand its product line, maintain efficient, timely and cost-
effective production and delivery of its products, and manage its growth; the
effects of strategic investments on the Company’s operations; changes in
foreign tax rates and changes in tax laws generally, including the ability to
utilize tax loss carry forwards; changing commodity costs; and the effect of
future legislative or regulatory changes.
Additional information concerning these and other risks and uncertainties are
discussed in the Company's filings with the Securities and Exchange
Commission, including without limitation the Company's Annual Report on Form
10-K under the headings "Special Note Regarding Forward-Looking
Statements"
and
"Risk
Factors."
In
addition,
the
proposed
merger
with
Sealy
presents
risk
factors
including
the
ability
of
the
parties
to
complete
the
proposed merger in a timely manner or at all; satisfaction of the conditions
precedent to the proposed merger, the ability to secure regulatory approvals;
the possibility of litigation (including relating to the merger itself); and the
ability to successfully integrate Sealy into Tempur-Pedic’s operations and realize
synergies from the proposed transaction. Any forward-looking statement
speaks only as of the date on which it is made, and the Company undertakes no
obligation to update any forward-looking statements for any reason, including
to reflect events or circumstances after the date on which such statements
are made or to reflect the occurrence of anticipated or unanticipated events or
circumstances. |
 Tempur-Pedic Overview |
 Tempur
Vision People who sleep on TEMPUR material sleep better than
those who don’t
Our goal is to become the world’s
favorite mattress and pillow brand
To achieve our goal we will:
1.
Make sure everyone knows they would sleep better on TEMPUR material
2.
Make sure there is a TEMPUR mattress and pillow that appeals to everyone
3.
Make sure that TEMPUR mattresses are available to everyone
4.
Make sure TEMPUR material continues to deliver the best sleep
Make sure our cost structure is optimized to enable marketing and
product investments
4 |
 Retail Price Point
$2,499-$7,999
$3,499-$3,999
$1,999-$4,999
$2,199-$2,699
$1,399
Tempur-Pedic “At-a-Glance”
Leading global specialty mattress manufacturer
Uniquely consumer focused and marketed
product that is consumer preferred
Additional products include: adjustable bases,
pillows, bed linens, slippers and cushions
Products are sold under the TEMPUR and
TEMPUR-PEDIC brand names
2012 Revenue: $1,403 million
2012 Adjusted EBITDA: $303 million
Company Highlights
By Product
Brand Portfolio
Sales Mix ¹
By Geography
5
Mattresses
Pillows
Other
1
Last 12-months ended December 31, 2012
North America
International
Note: TEMPUR-Choice Collection expected availability 2Q 2013.
|
 6
Growth Driven by Successful Innovation
Contour
HD
Cloud
Net Sales ($ in billions)
Contour
HD
Cloud
Contour
HD
Cloud
Contour
HD
Cloud
Simplicity
Weightless
Original
Sensation
Original
Sensation
Original
Sensation
Cloud
Original
Sensation
Cloud
TEMPUR-CLOUD has been a major success in
North America and Internationally
Introduced in North America in November
2009 and in International markets beginning in
March 2011
Most successful innovation to date and quickly
became Tempur-Pedic’s top selling collection
TEMPUR-CLOUD
Other Innovations
TEMPUR-Sensation
TEMPUR-Weightless
TEMPUR-Breeze Technology
TEMPUR-Choice
1
TEMPUR-Ergo
Premier
Adjustable
1
Pillows and Slippers
Cloud North America
Late 2009, 2010
Cloud Int’l
2011
Weightless
Breeze Tech
Late 2012
Simplicity
2012
Tempur NA
Mattress
Collections
Tempur
International
Mattress
Collections
1
Expected availability 2Q 2013.
Source: Company filings, management estimates. For a discussion of the
Company’s performance, please refer to the Company’s 10Q and 10K filings.
Choice
2013
1
Original
Sensation
Cloud
Contour
HD
Cloud
Simplicity
Weightless
Choice
$0.8
$1.1
$1.4
$1.4
$0.0
$0.2
$0.4
$0.6
$0.8
$1.0
$1.2
$1.4
$1.6
2009
2010
2011
2012
2013E |
 Diversified Global Platform With State-of-the-Art
Manufacturing Facilities
Subsidiary
Third Party
Global Footprint
Global Manufacturing Presence
In 2012 generated 69% of revenue from North
America and 31% from international operations
> $2.5B of sales capacity
across three existing
manufacturing facilities
Capacity utilization
approximately 45%
U.S. Facilities
Global Facilities
Manufacturing Facility
Virginia
New Mexico
R&D Facility
Virginia
Manufacturing Facility
Denmark
R&D Facility
Denmark
Virginia (540K sq ft)
New Mexico (800K sq ft)
Denmark (517K sq ft)
7 |
 Strong,
Established Management Team Prior Experience
Years
Name
Position
Prior Experience
Consumer
Products
Inter'l
with
Tempur
Mark Sarvary
President and CEO
President, Campbell Soup North America
CEO, J. Crew Group
5
President, Stouffer's Frozen Food Division at Nestle
Rick Anderson
EVP and President,
VP,
Gillette
North
America Gillette / P&G
7
Matt Clift*
EVP, Global Operations
VP / GM Lexmark International
Lexmark / IBM
8
Lou Jones
EVP and General Counsel
General Counsel, Papa John's International
SVP, Blockbuster, Inc.
4
David Montgomery
EVP and President,
President, Rubbermaid Europe
International
VP, Black & Decker Europe, Middle East, Africa
10
Brad Patrick
EVP, Human Resources
SVP, Sara Lee Corporation
Gillette / P&G
3
Delta Air Lines
Dale Williams
EVP and CFO
CFO, Honeywell Control Products
CFO, Saga Systems
10
CFO, GE Information Systems
Tim Yaggi
COO
Group President, Masco Corporation
Joined
EVP, Whirlpool Corporation
2013
Norelco (Philips)
8
Note: Matt Clift is retiring in 2013. |
 Net
Sales Net Sales decreased 1% Y/Y for the full year ended December 31,
2012 -4.0% in North America
+6.1%
Internationally,
+11.3%
approximately
on
a
constant
currency
basis¹
($ in millions)
1
For
a
discussion
of
the
Company’s
performance,
please
refer
to
the
Company’s
10Q
and
10K
filings.
9
The
references
to
“constant
currency
basis”
in
this
presentation
do
not
include
operational
impacts
that
could
result
from
fluctuations
in
foreign
currency
rates.
Certain
financial
results are adjusted based on a simple mathematical model that translates current
period results in local currency using the comparable prior year period’s currency conversion
rate. This approach is used for countries where the functional currency is the local
country currency. This information is provided so that certain financial results can be viewed
without the impact of fluctuations in foreign currency rates, thereby facilitating
period-to-period comparisons of business performance. Refer to ITEM 7A under Part II of the
Company’s 2012 Form 10-K. |
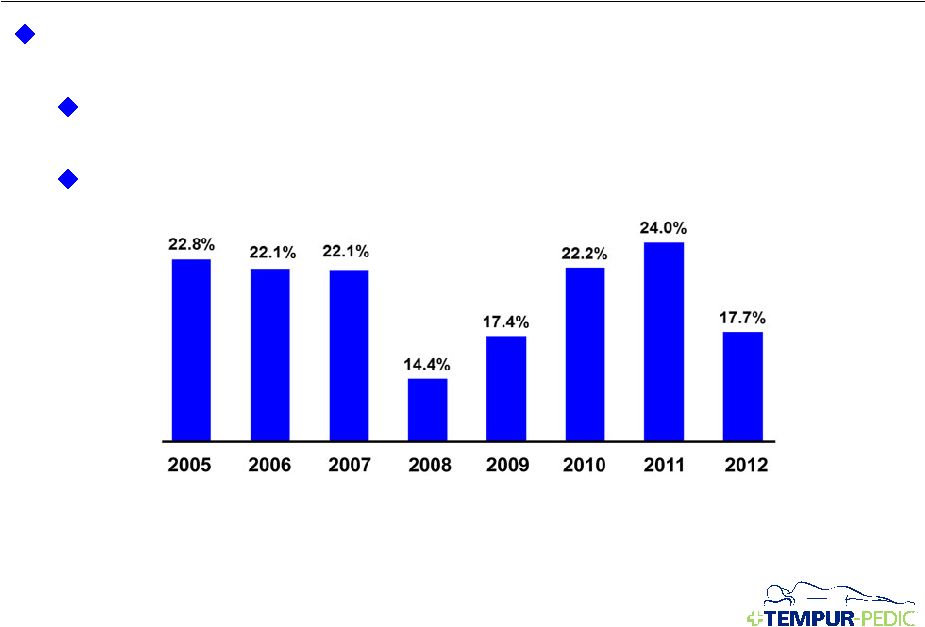
 Gross
Margin Gross margin decreased 150bps Y/Y for the full
year ended December 31, 2012
as a result of:
Increased promotions and discounts, new product introductions and
unfavorable product mix
Offset partially by geographic mix
For a discussion of the Company’s performance, please refer to the
Company’s 10Q and 10K filings. 10 |
 Operating Margin
Operating margin decreased 630 bps Y/Y for the full year ended
December 31, 2012,
primarily
as
a
result
of:
Increased Selling & Marketing expenses +320bps Y/Y (Advertising investment
+120bps Y/Y)
General, administrative and other (including R&D) expenses increased
+160bps
For a discussion of the Company’s performance, please refer to the
Company’s 10Q and 10K filings. 11 |
 Tempur-Pedic
Well positioned in an attractive market
Executing on strategy to improve competitive position, market share and
shareholder value:
Product Innovation
Strengthening Brand
Restore Margins
Significant long term growth potential
Acquiring Sealy to enhance strategic position and broaden global
opportunity
Note: For a discussion of the Company’s performance, please refer to the
Company’s 10K and 10Q filings. 12 |
 Sealy Overview |
 Business Highlights
Sales Breakdown
Sealy is a leading bedding manufacturer in the U.S.
Manufactures a full line of bedding products under the
Sealy, Posturepedic, Stearns & Foster and Optimum brand
names
Stearns & Foster addresses growth at premium price
points, and achieved strong growth in 2012
Leading global brand with significant global scale
Top market position in Canada, Mexico and
Argentina
Continuing investments in vertical integration in
Mexico and South America
Expanding manufacturing and retail presence in
China
Owned and operated retail stores in South America
and Asia
Founded in 1881 and is based in Trinity, NC
FY 2012 Sales by Geography
Net Sales $1.3Bn
United States
77%
Canada
15%
Other
8%
FY 2012 U.S. Sales
U.S. Sales $1.0Bn
U.S. Innerspring
86%
U.S. Specialty
12%
U.S. Other
2%
Leading global bedding manufacturer with
broadest portfolio of established brands
14
Sealy “At-a-Glance”
Note: Sealy’s FY 2012 ended December 2, 2012. For a discussion of
the Sealy’s performance, please refer to Sealy’s 10Q and 10K filings. |
 Strategic Rationale For The Acquisition
Comprehensive Portfolio of Iconic Brands
Tempur-Pedic,
Sealy,
Sealy
Posturepedic,
and
Stearns
&
Foster
are
among
the
most
highly
recognized
brands
in
North
America
Strong brand recognition across South America, Europe, and Asia with
Tempur-Pedic and Sealy Complementary Product Offering
Tempur-Pedic’s expertise in visco-elastic
Sealy’s expertise in innerspring
Ability to leverage more in R&D to strengthen existing products and develop
innovative new offerings Global Footprint
Tempur-Pedic: Strong presence around the world, particularly in North America,
Europe and Asia Sealy: Well represented in U.S., Canada, Mexico, Argentina
and Asia Significant Value Creation
Expected to be accretive in the first full year of operations
Cost synergy estimate in excess of $40 million by the third year
Attractive
upside
potential
from
revenue
synergies
across
organizations
–
hybrid
technologies,
cross-selling,
international
Strong Financial Characteristics
Combined adjusted EBITDA of $453 million for last 12
months¹ Ability to invest in key growth
areas Commitment
to
delever
–
Cash
flow
characteristics
will
enable
rapid
deleveraging
15
1
Last 12-months ended December 31, 2012 for Tempur-Pedic and December 2,
2012 for Sealy. See Appendix for Adjusted EBITDA reconciliation. |
 Combined Comprehensive Portfolio of Iconic Brands
16 |
 Appendix |
 18
Use of Non-GAAP Financial Measures
Tempur-Pedic International Inc. (the “Company”) has presented the
following non-GAAP financial measures in this presentation: adjusted
EBITDA of each of the Company and Sealy, and adjusted EBITDA of the combined company. The Company and Sealy each
define its non-GAAP adjusted EBITDA to exclude the following: (1) interest
expense, net; (2) provision for income taxes; and (3) depreciation and
amortization expense. The Company and Sealy also exclude certain unusual items and other adjustments permitted in
calculating its respective debt covenants in its debt agreements. The
reconciliations of these historical non-GAAP measures to each of
Tempur-Pedic’s and Sealy’s GAAP financial measures for the periods
presented, are set forth on slide 19. The Company believes the use of these
non-GAAP financial measures are useful to investors in comparing the
results of operations for
comparable periods by eliminating certain of the more significant effects of
adjusted EBITDA. These measures also reflect how the Company and Sealy
manage their businesses internally. In addition to the adjustments included in the calculation of the Company’s
non-GAAP
adjusted
EBITDA
eliminates
the
effects
of
financing,
income
taxes
and
the
accounting
effects
of
capital
spending
and
acquisitions.
As
with
the
items
eliminated
in
its
calculation
of
non-GAAP
adjusted
EBITDA,
these
items
may
vary
for
different
companies for reasons unrelated to the overall operating performance of a
company’s business. When analyzing Tempur-Pedic’s,
Sealy’s and the combined company’s operating performance, investors
should not consider these non-GAAP financial measures as a substitute
for comparable measures in accordance with GAAP. |
 19
Adjusted EBITDA Reconciliation
1
Last 12-months ended December 31, 2012 for Tempur-Pedic and December 2,
2012 for Sealy. LTM Combined Adjusted EBITDA
($ in millions)
2
Includes Comfort Revolution acquisition costs, noncontrolling interest, and various
immaterial adjustments. Tempur-Pedic
Sealy
Combined
Net income (loss)
$106.8
($1.2)
$105.6
Interest expense
18.8
89.3
108.1
Income taxes
122.4
12.5
134.9
Depreciation and amortization
42.0
26.4
68.4
EBITDA
$290.0
$127.1
$417.1
Transaction costs
8.9
2.5
11.4
Integration costs
2.2
2.2
Refinancing charges
3.7
3.7
Non-cash compensation
8.1
8.1
Restructuring and impairment related charges
1.5
2.4
3.9
Discontinued operations
2.0
2.0
Other ²
4.3
4.3
Adjusted EBITDA
$302.6
$150.1
$452.7
1
1
1 |
 1
******************************************************************************************
******************************************************************************************
******************************************************************************************
******************************************************************************************
******************************************************************************************
Exhibit 99.1
™ |