Attached files
| file | filename |
|---|---|
| EX-32.1 - EXHIBIT 32.1 - TEMPUR SEALY INTERNATIONAL, INC. | exhibit321-tpxx201610k.htm |
| EX-31.2 - EXHIBIT 31.2 - TEMPUR SEALY INTERNATIONAL, INC. | exhibit312-tpxx201610k.htm |
| EX-31.1 - EXHIBIT 31.1 - TEMPUR SEALY INTERNATIONAL, INC. | exhibit311-tpxx201610k.htm |
| EX-23.1 - EXHIBIT 23.1 - TEMPUR SEALY INTERNATIONAL, INC. | exhibit231-tpxx201610k.htm |
| EX-21.1 - EXHIBIT 21.1 - TEMPUR SEALY INTERNATIONAL, INC. | exhibit211-tpxx201610k.htm |
| EX-10.58 - EXHIBIT 10.58 - TEMPUR SEALY INTERNATIONAL, INC. | exhibit1058-tpxx201610k.htm |
| EX-10.57 - EXHIBIT 10.57 - TEMPUR SEALY INTERNATIONAL, INC. | exhibit1057-tpxx201610k.htm |
| EX-10.23 - EXHIBIT 10.23 - TEMPUR SEALY INTERNATIONAL, INC. | exhibit1023-tpxx201610k.htm |
UNITED STATES
SECURITIES AND EXCHANGE COMMISSION
WASHINGTON, D.C. 20549
FORM 10-K
ANNUAL REPORT PURSUANT TO SECTION 13 OR 15(d) OF THE SECURITIES EXCHANGE ACT OF 1934
For the fiscal year ended December 31, 2016
Commission file number 001-31922
TEMPUR SEALY INTERNATIONAL, INC.
(Exact name of registrant as specified in its charter)
Delaware | 33-1022198 | |
(State or other jurisdiction of incorporation or organization) | (I.R.S. Employer Identification No.) | |
1000 Tempur Way
Lexington, Kentucky 40511
(Address of registrant’s principal executive offices) (Zip Code)
Registrant’s telephone number, including area code: (800) 878-8889
Securities registered pursuant to Section 12(b) of the Act:
Title of Each Class | Name of Each Exchange on Which Registered | |
Common Stock, $0.01 par value | New York Stock Exchange | |
Securities registered pursuant to Section 12(g) of the Act:
None
Indicate by check mark if the registrant is a well-known seasoned issuer, as defined in Rule 405 of the Securities Act. Yes x No¨
Indicate by check mark if the registrant is not required to file reports pursuant to Section 13 or Section 15(d) of the Act. Yes ¨ No x
Indicate by check mark whether the registrant (1) has filed all reports required to be filed by Section 13 or 15(d) of the Securities Exchange Act of 1934 during the preceding 12 months (or for such shorter period that the registrant was required to file such reports), and (2) has been subject to such filing requirements for the past 90 days. Yes x No ¨
Indicate by check mark whether the registrant has submitted electronically and posted on its corporate Web site, if any, every Interactive Data File required to be submitted and posted pursuant to Rule 405 of Regulation S-T during the preceding 12 months (or for such shorter period that the registrant was required to submit and post such files). Yes x No ¨
Indicate by check mark if disclosure of delinquent filers pursuant to Item 405 of Regulation S-K (§229.405 of this chapter) is not contained herein, and will not be contained, to the best of registrant’s knowledge, in definitive proxy or information statements incorporated by reference in Part III of this Form 10-K or any amendment to this Form 10-K. ¨
Indicate by check mark whether the registrant is a large accelerated filer, an accelerated filer, a non-accelerated filer or a smaller reporting company. See definitions of “large accelerated filer”, “accelerated filer” and “smaller reporting company” in Rule 12b-2 of the Exchange Act. (Check one):
Large Accelerated filer x Accelerated filer o Non-Accelerated filer o Smaller Reporting Company ¨
Indicate by check mark whether the registrant is a shell company (as defined in Rule 12b-2 of the Exchange Act.): Yes ¨ No x
The aggregate market value of the common equity held by nonaffiliates of the registrant on June 30, 2016, computed by reference to the closing price for such stock on the New York Stock Exchange on such date, was approximately $2,845,571,126.
The number of shares outstanding of the registrant’s common stock as of February 21, 2017 was 53,798,212 shares.
DOCUMENTS INCORPORATED BY REFERENCE
Portions of the registrant’s definitive proxy statement for the 2017 Annual Meeting of Stockholders, which is to be filed subsequent to the date hereof, are incorporated by reference into Part III of this Form 10-K.
TABLE OF CONTENTS
Page | ||
2
Special Note Regarding Forward-Looking Statements
This Annual Report on Form 10-K (“Report”), including the information incorporated by reference herein, contains “forward-looking statements” within the meaning of Section 27A of the Securities Act of 1933, as amended (the “Securities Act”), and Section 21E of the Securities Exchange Act of 1934, as amended (the “Exchange Act”), which includes information concerning one or more of our plans; objectives; goals; strategies and key strategic growth initiatives; future revenues or performance; the anticipated impact on our business and financial performance resulting from the termination of our relationship with Mattress Firm, Inc.; the impact of the macroeconomic environment in both the U.S. and internationally on our business segments and expectations regarding growth of the mattress industry; uncertainties arising from global events; general economic, financial and industry conditions, particularly in the retail sector, as well as consumer confidence and the availability of consumer financing; competition in our industry; consumer acceptance of our products; the ability to continuously improve and expand our product line, maintain efficient, timely and cost-effective production and delivery of products, and manage growth; the ability to expand brand awareness, distribution and new products; the efficiency and effectiveness of our advertising campaigns and other marketing programs; the ability to increase sales productivity within existing retail accounts and to further penetrate the retail channel, including the timing of opening or expanding within large retail accounts and the timing and success of product launches; the effects of consolidation of retailers on revenues and costs; the effects of strategic investments on our operations, including our efforts to expand our global market share; changing commodity costs; changes in product and channel mix and the impact on the Company's gross margin; initiatives to improve gross margin; our capital structure and increased debt level, including our ability to meet financial obligations and continue to comply with the terms and financial ratio covenants of our credit facilities; changes in interest rates; changes in foreign tax rates and changes in tax laws generally, including the ability to utilize tax loss carry forwards; effects of changes in foreign exchange rates on our reported earnings; the outcome of pending tax audits or other tax proceedings; the effect of future legislative or regulatory changes; litigation and similar issues; financial flexibility; our expected sources of cash flow; changes in capital expenditures; our ability to effectively manage cash; and expectations regarding our target leverage and our share repurchase program. Many of these statements appear, in particular, under the heading “Management’s Discussion and Analysis of Financial Condition and Results of Operations” in Part II, ITEM 7 of this Report. When used in this Report, the words "assumes," "estimates," "expects," “guidance,” “anticipates,” “proposed,” “projects,” “plans,” “intends,” “believes” and variations of such words or similar expressions are intended to identify forward-looking statements. These forward-looking statements are based upon our current expectations and various assumptions. There can be no assurance that we will realize our expectations or that our beliefs will prove correct.
There are a number of risks and uncertainties that could cause our actual results to differ materially from the forward-looking statements contained in this Report. There are important factors, many of which are beyond the Company’s control, that could cause our actual results to differ materially from those expressed as forward-looking statements in this Report, including under the heading “Risk Factors” under Part I, ITEM 1A of this Report. There may be other factors that may cause our actual results to differ materially from the forward-looking statements.
All forward-looking statements attributable to us apply only as of the date of this Report and are expressly qualified in their entirety by the cautionary statements included in this Report. Except as may be required by law, we undertake no obligation to publicly update or revise any of the forward-looking statements, whether as a result of new information, future events, or otherwise.
When used in this Report, except as specifically noted otherwise, the term “Tempur Sealy International” refers to Tempur Sealy International, Inc. only, and the terms “Company,” “we,” “our,” “ours” and “us” refer to Tempur Sealy International, Inc. and its consolidated subsidiaries. When used in this Report, the term “Sealy” refers to Sealy Corporation and its historical subsidiaries. In addition, when used in this Report “2016 Credit Agreement” refers to the Company’s senior credit facility entered into in the first quarter of 2016; “2012 Credit Agreement” refers to the Company’s prior senior credit facility entered into in 2012; “2026 Senior Notes” refers to the 5.50% senior notes due 2026 issued in 2016; “2023 Senior Notes” refers to the 5.625% senior notes due 2023 issued in 2015; ”2020 Senior Notes” refers to the 6.875% senior notes due 2020 retired in 2016; and "8.0% Sealy Notes” refers to Sealy’s 8.0% Senior Secured Third Lien Convertible Notes retired in 2016.
3
PART I
ITEM 1. BUSINESS
General
We are the world's largest bedding manufacturer. We develop, manufacture, market, and distribute bedding products, which we sell globally in approximately 100 countries. Our brand portfolio includes many highly recognized brands in the industry, including our Tempur products sold under the TEMPUR® and Tempur-Pedic® brands, and our Sealy products sold under the Sealy®, Sealy Posturepedic®, and Stearns & Foster® brands. In 2017, the Sealy® brand will also feature Posturepedic Technology™ in the Sealy Performance™ and Sealy Premium™ collections. Our comprehensive suite of bedding products offers a variety of products to consumers across a broad range of channels.
We operate in two segments: North America and International. Corporate operating expenses are not included in either of the segments and are presented separately as a reconciling item to consolidated results. These segments are strategic business units that are managed separately based on geography. Our North America segment consists of Tempur and Sealy manufacturing and distribution subsidiaries, joint ventures and licensees located in the U.S. and Canada. Our International segment consists of Tempur and Sealy manufacturing and distribution subsidiaries, joint ventures and licensees located in Europe, Asia-Pacific and Latin America. We evaluate segment performance based on net sales, gross profit and operating income. Financial information about our segments and geographic areas is included elsewhere in this Report in Part II, ITEM 7, "Management's Discussion and Analysis of Financial Condition and Results of Operations," and Note 16, "Business Segment Information," of the Notes to the Consolidated Financial Statements, included in Part II, ITEM 8, "Financial Statements and Supplementary Data."
We sell our products through two distribution channels in each segment: Retail (furniture and bedding retailers, department stores, specialty retailers and warehouse clubs); and Other (direct-to-consumer through e-commerce platforms; company-owned stores and call centers; third party distributors; hospitality and healthcare customers).
Our principal executive office is located at 1000 Tempur Way, Lexington, Kentucky 40511 and our telephone number is (800) 878-8889. Tempur Sealy International, Inc. was incorporated under the laws of the State of Delaware in September 2002. Our Annual Reports on Form 10-K, Quarterly Reports on Form 10-Q, Current Reports on Form 8-K and any amendments to such reports filed with or furnished to the Securities and Exchange Commission (“SEC”) pursuant to Sections 13(a) or 15(d) of the Exchange Act, are available free of charge on our website at www.tempursealy.com as soon as reasonably practicable after such reports are electronically filed with the SEC.
You may read and copy any materials we file with the SEC at the SEC’s public reference room at 100 F Street NE, Washington, DC 20549. The public may obtain information about the operation of the public reference room by calling the SEC at 1-800-SEC-0330. The SEC also maintains an Internet site that contains reports, proxy and information statements, and other information regarding issuers that file electronically with the SEC. The website of the SEC is www.sec.gov.
Strategy
Our long-term strategy is to drive earnings growth. Our goal is to improve the sleep of more people, every night, all around the world. In order to achieve our long-term strategy while managing the current economic and competitive environments, we will focus on developing the best bedding products, investing in our brands, expanding our North America margins while maintaining market share, growing our market share in International and optimizing our worldwide distribution. Through our strategy, we will generate earnings growth and strong cash flow that will be used to reduce debt to the extent appropriate and return value to stockholders.
Our Products and Brands
We have a comprehensive offering of products that appeal to a broad range of consumers, some of which are covered by one or more patents and/or patent applications. We also routinely introduce new mattress models, launch new products and update our existing mattress products in each of our segments. Our products are divided into two categories, as described below:
• | Bedding - Our bedding product category includes mattresses, foundations and adjustable foundations and represented 92.5% of our net sales in 2016. |
4
• | Other - Our other product category includes pillows, mattress covers, sheets, cushions and various other comfort products and represented 7.5% of our net sales in 2016. |
In order to achieve our goal to improve the sleep of more people, every night, all around the world, one of our strategic initiatives is to leverage and strengthen our comprehensive portfolio of iconic brands and products. Our brand portfolio includes many highly recognized brands, including TEMPUR®, Tempur-Pedic®, Sealy®, Sealy Posturepedic® and Stearns & Foster®, which are described below:
• | Tempur-Pedic - Founded in 1991, the Tempur brand is our specialty innovation category leader designed to provide life changing sleep for our wellness seeking consumers. Our proprietary Tempur material precisely adapts to the shape, weight and temperature of the consumer and creates fewer pressure points, reduces motion transfer and provides personalized comfort and support. |
• | Stearns & Foster - The Stearns & Foster brand offers our consumers high quality mattresses built by certified craftsmen who have been specially trained. Founded in 1846, the brand is designed and built with precise engineering and relentless attention to detail and fuses new innovative technologies with time-honored techniques, creating supremely comfortable beds. |
• | Sealy - The Sealy brand originated in 1881 in Sealy, Texas, and for over a century has focused on offering trusted comfort, durability and excellent value while maintaining contemporary styles and great support. In 2017, we are uniting all of our Sealy products under one masterbrand, which will include the Posturepedic Technology™ as described below. |
• | Sealy Posturepedic - The Sealy Posturepedic brand, introduced in 1950, is engineered to provide all-over support and body alignment to allow full relaxation and deliver a comfortable night's sleep. In 2017, Sealy Posturepedic will no longer represent its own separate brand, but will be featured as Posturepedic Technology™ in the Sealy Performance™ and Sealy Premium™ collections. |
• | Cocoon by Sealy - The Cocoon by Sealy brand, introduced in 2016, is our new offering in the below $1,000 e-commerce space, made with the high quality materials that consumers expect from Sealy, sold online at www.cocoonbysealy.com and delivered in a box directly to consumers' doorsteps. |
Our 2016 product introductions included the new line of Stearns & Foster® products. The new Reserve Collection offers our exclusive Hybrid Pillowtop featuring our Nano Comfort™ Quilt Layer. The innovative mattress top design delivers precise support and superior adaptiveness. In addition, we updated our existing Stearns & Foster® Estate, Lux Estate and Lux Estate Hybrid product lines, which, along with the Reserve Collection, now offer four exclusive features: IntelliCoil® Advanced coil design, PrecisionEdge™ edge system, PrimaCool™ performance fabric and Advanced Adapt™ foam. We also updated our TEMPUR-Breeze line to include state-of-the-art PureCool™ Comfort technology, an ultra breathable design and a premium cooling cover. These upgrades provide more refreshing sleep for consumers seeking a cooler sleeping environment.
In 2017, we are planning significant new product introductions in our North America and International segments. In North America, we are uniting all of our Sealy products under one masterbrand. Product introductions will include new Sealy products in two distinct lines: Response and Conform. The new Sealy Essentials™, Sealy Performance™, and Sealy Premium™ Collections combine smart innovation, precise engineering and industry-leading testing to ensure quality and durability. Sealy's exclusive Posturepedic Technology™ will be featured in the Performance and Premium Collections, offering the highest quality materials to target the right level of support for each area of the body. In addition, we are introducing the new Tempur-Pedic Anniversary collection to celebrate the 25th anniversary of the Company’s founding and relaunching our flagship line of Tempur mattresses in International to feature the iconic aesthetics similar to Tempur-Pedic mattresses that you see in North America.
Our Channels
We sell our products through two channels: Retail and Other.
5
Retail
Our Retail channel sells to furniture and bedding retailers, department stores and warehouse clubs, among others and represented 89.8% of net sales in 2016. Our top five customers accounted for approximately 38.7% of our net sales for the year ended December 31, 2016. Mattress Firm Inc. (“Mattress Firm”), which was acquired by Steinhoff International Holdings N.V. ("Steinhoff") in September 2016 and is a customer within the North America segment, was our largest customer for 2016. In February 2016, Mattress Firm acquired all of the outstanding equity interests in HMK Mattress Holdings, LLC ("Sleepy’s"). Sleepy’s has historically been one of the Company's top five customers and, as a result of this acquisition, the combined companies represented 21.4%and 23.7% of the Company's sales for the year ended December 31, 2016, and 2015 respectively. In January 2017, we terminated our contracts with Mattress Firm and we expect to wind down our relationship with Mattress Firm over the first quarter of 2017. See ITEM 1A, "Risk Factors," and ITEM 7, "Management's Discussion and Analysis of Financial Condition and Results of Operations -- Factors That Could Impact Results of Operations" for a discussion of the anticipated impact of this termination and the Company's strategy moving forward.
Other
Our Other channel sells directly to consumers through e-commerce platforms, company-owned stores and call centers, and to third party, healthcare and hospitality customers and represented 10.2% of net sales in 2016. Third party includes sales to distributors in countries where we do not sell directly through our own subsidiaries. Healthcare includes sales to hospitals, nursing homes, healthcare professionals and medical retailers. Hospitality sales include hotels.
Marketing
Our overall marketing strategy is to drive consumer demand through the use of effective marketing. We invest across multiple media platforms to build brand awareness and drive consumer interest in our products. Our strategy varies by segment; however, the majority of our advertising programs are created on a centralized basis through our in-house advertising organization. In 2017, we plan to drive net sales through continued investments in new products, marketing and other initiatives.
North America
Our North America segment sells primarily through the Retail channel, which contributed 94.1% of North America segment sales in 2016. In North America, we advertise nationally on television, digitally and through consumer and trade print. In addition, we participate in cooperative advertising on a shared basis with some of our retail customers. Throughout the year, we relied on a series of strategic initiatives, which included: new product introductions, advertising and in-store marketing investments.
International
Our International segment sells primarily through the Retail channel, which contributed 69.8% of International segment net sales in 2016. Our advertising strategy in our International segment focuses on building brand awareness, which we believe is important to increasing our overall market share. We advertise on television, digitally and through consumer and trade print, as well as cooperative advertising on a shared basis with some of our retail customers. We believe there is significant opportunity to drive sales growth in our International segment through the expansion of product lines within existing channels, increasing our market share in previously underpenetrated markets and, where appropriate, entering into new markets.
Seasonality
We believe that sales of products to furniture and bedding stores are typically subject to modest seasonality inherent in the bedding industry, with sales expected to be generally lower in the second and fourth quarters. We may not experience our typical seasonality in 2017 as we pursue our strategy to recapture market share in the U.S. Our sales in a particular quarter can also be impacted by new product launches. Additionally, the U.S. bedding industry generally experiences increases in sales around holidays and promotional periods.
Operations
Manufacturing and Distribution
Our products are currently manufactured and distributed through our global network of facilities.
6
Suppliers
We obtain the raw materials used to produce our pressure-relieving TEMPUR® material from outside sources. We currently acquire chemicals and proprietary additives for Tempur products from a number of suppliers with manufacturing locations around the world. These supplier relationships may be revised in order to maintain quality, cost, and delivery expectations. We do not consider ourselves dependent upon any single outside vendor as a source of raw materials for Tempur products and believe that sufficient alternative sources of supply for the same or similar raw materials are available. Additionally, we source a portion of the manufacturing of our adjustable bed bases and foundations from third party manufacturers. We do not consider ourselves dependent upon any single outside manufacturer as a source of these products.
In connection with the general supply chain risks described above, with respect to our Sealy products our raw materials consist of polyurethane foam, polyester, polyethylene foam and steel innerspring components that we purchase from various suppliers. In the U.S. and Canada, we source the majority of our requirements for polyurethane foam components and spring components for our Sealy and Stearns & Foster mattress units from a key supplier for each component. These components are purchased under supply agreements. We also purchase a significant portion of our Sealy foundation parts from third party sources under supply agreements. We do not consider ourselves to be dependent in the long term upon any single outside vendor as a source of supply to our bedding business, and we believe over time that sufficient alternative sources of supply for the same, similar or alternative components are available. However, for many of these components if our key supplier for the applicable component failed to supply components in the amount we require this could significantly interrupt production of our products and increase our production costs.
Research and Development
We have four research and development centers, three in the U.S. and one in Denmark, which conduct technology and product development. Additionally, we have a product testing facility that conducts hundreds of consumer tests annually. We believe our consumer-research driven approach to innovation results in best-in-class products that benefit the consumer. Research and development expenses were $26.7 million, $28.7 million and $21.6 million in 2016, 2015 and 2014, respectively.
Industry and Competition
We compete in the global bedding industry, where we are the only truly global participant. The bedding industry is comprised of mattresses and foundations, pillows and accessories. The mattress market category is comprised of traditional innerspring mattresses and non-innerspring mattresses, which includes visco-elastic and foam mattresses, innerspring/foam hybrid mattresses, airbeds and latex mattresses. The foundation category is comprised of traditional foundations and adjustable foundations. Additionally, the pillow market is comprised of traditional foam and feather pillows, as well as pillows made of visco-elastic, latex, foam, sponge, rubber and down. The primary distribution channels for mattresses and foundations are retail furniture and bedding stores, department stores and warehouse clubs.
We encounter competition from a number of bedding manufacturers in both the highly concentrated domestic and highly fragmented international markets. Participants in each of these markets compete primarily on price, quality, brand name recognition, product availability and product performance. In addition, mattress and pillow manufacturers and retailers are seeking to increase their channels of distribution and are looking for new ways to reach the consumer, including the recent expansion in the number of companies pursuing online direct-to-consumer models for foam mattresses.
The U.S. is the largest market in which we compete. Since 1996, U.S. wholesale bedding sales, which include mattresses and foundations, have grown at a compound annual growth rate, or "CAGR", of 4.7%, reaching approximately $8.0 billion in 2015 according to the International Sleep Products Association (“ISPA”). According to ISPA, U.S. mattress producer shipments increased 4.5% in 2015 as compared to 2014, making 2015 the sixth consecutive yearly unit increase since 2010. Additionally, the value of mattress shipments increased 6.8% in 2015, also the sixth consecutive yearly increase in dollar value since 2010. The value of mattress shipments set a new high in 2015. Unit shipments in 2015 set a new post-recession high, but are still below historical records, according to ISPA. Assuming the health of the overall economy continues to improve, we believe the mattress industry is well positioned for future growth.
7
Industry growth has been driven by increases in average unit selling price (“AUSP”) primarily due to consumer awareness of the ongoing new health benefits of better sleep discovered by the medical community. Additionally, industry growth over the past several years has been driven by an increase in overall consumer brand awareness, the highly profitable nature of the mattress industry for manufacturers and retailers, an overall increase in adjustable foundation attachment rates, innovative technology and consumer demographics.
The U.S. mattress market has experienced consolidation among manufacturers in recent years. We, together with Serta Simmons Bedding, LLC, which sells products under the Serta and Simmons brands, collectively accounted for a significant share of the wholesale bedding industry revenues in 2015 based on figures obtained from ISPA and Furniture/Today industry publications. The balance of the mattress market in the U.S. is served by a large number of other manufacturers. In addition, there has been consolidation of mattress retailers in the U.S. over the last several years, driven principally by Mattress Firm.
The international market is served by a large number of manufacturers, primarily operating on a regional and local basis. These manufacturers offer a broad range of mattress and pillow products.
The highly competitive nature of the mattress and pillow industries means we are continually subject to the risk of loss of market share, loss of significant customers, reductions in margins, and the inability to acquire new customers.
Intellectual Property
Patents, Trademarks and Licensing
We hold various U.S. and foreign patents and patent applications regarding certain elements of the design and function of many of our mattress and pillow products.
As of December 31, 2016, we held trademark registrations worldwide, which we believe have significant value and are important to the marketing of our products to retailers. TEMPUR® and Tempur-Pedic® are trademarks registered with the U.S. Patent and Trademark Office. In addition, we have U.S. applications pending for additional trademarks. Several of our trademarks have been registered, or are the subject of pending applications, in various foreign countries. Each U.S. trademark registration is renewable indefinitely as long as the trademark remains in use. We also own numerous trademarks, trade names, service marks, logos and design marks, including Sealy®, Stearns & Foster® and Sealy Posturepedic®. We also license the Bassett® trade name in various territories under a long-term agreement.
We derive income from royalties by licensing Sealy® brands, technology and trademarks to other manufacturers. Our licenses include rights for the licensees to use trademarks as well as current proprietary or patented technology utilized by us. We also provide our licensees with product specifications, research and development, statistical services and marketing programs. For the year ended December 31, 2016, our licensing activities as a whole generated unaffiliated net royalties of approximately $19.5 million.
Governmental Regulation
Our operations are subject to state, local and foreign consumer protection and other regulations relating to the mattress and pillow industry. These regulations vary among the states and countries in which we do business. The regulations generally impose requirements as to the proper labeling of bedding merchandise, restrictions regarding the identification of merchandise as “new” or otherwise, controls as to hygiene and other aspects of product handling and sale and penalties for violations. The U.S. Consumer Product Safety Commission has adopted rules relating to fire retardancy standards for the mattress industry. Many foreign jurisdictions also regulate fire retardancy standards. Future changes to these standards may require modifications to our products to comply with these additional standards. We are also subject to environmental and health and safety requirements with regard to the manufacture of our products and conduct of our operations and facilities. We have made and will continue to make capital and other expenditures necessary to comply with these requirements. Currently these expenditures are immaterial to our financial results.
8
Our principal waste products are foam and fabric scraps, wood, cardboard and other non-hazardous materials derived from product component supplies and packaging. We also periodically dispose of (primarily by recycling) small amounts of used machine lubricating oil and air compressor waste oil. In the U.S., we are subject to federal, state and local laws and regulations relating to environmental health and safety, including the Federal Water Pollution Control Act and the Comprehensive Environmental Response, Compensation and Liability Act. We believe that we are in compliance with all applicable international, federal, state and local environmental statutes and regulations. We do not expect that compliance with international, federal, state or local provisions that have been enacted or adopted regulating the discharge of materials into the environment, or otherwise relating to the protection of the environment, will have a material effect upon our capital expenditures, earnings or competitive position. We are not aware of any pending federal environmental legislation which would have a material impact on our operations, and have not been required to make and do not expect to make any material capital expenditures for environmental control facilities in the foreseeable future.
Employees
As of December 31, 2016, we had approximately 7,300 Tempur Sealy employees, approximately 4,900 of which are located in North America and 2,400 in the rest of the world. Approximately 34.2% of our employees are represented by various labor unions with separate collective bargaining agreements. Due to the large number of collective bargaining agreements, we are periodically in negotiations with certain of the unions representing our employees. We consider our overall relations with our workforce to be satisfactory. Our current collective bargaining agreements, which are typically one to three years in length, expire at various times beginning in 2017 through 2019. As of December 31, 2016, our North America segment employed approximately 600 individuals covered under collective bargaining agreements expiring in 2017 and our International segment employed approximately 1,000 individuals covered under collective bargaining agreements expiring in 2017.
Executive Officers of the Registrant
This information is incorporated herein by reference from our definitive proxy statement for the 2017 Annual Meeting of Stockholders (the “Proxy Statement”) under the section entitled “Proposal One—Election of Directors—Executive Officers.”
ITEM 1A. RISK FACTORS
The following risk factors and other information included in this Report should be carefully considered. Please also see “Special Note Regarding Forward-Looking Statements” on page 3.
Set forth below are descriptions of certain risks relating to our business.
Unfavorable economic and market conditions could reduce our sales and profitability and as a result, our operating results may be adversely affected.
Our business has been affected by general business and economic conditions, and these conditions could have an impact on future demand for our products. The global economy remains unstable, and we expect the economic environment to continue to be challenging. Economic uncertainty may give households less confidence to make discretionary purchases.
There could be a number of other effects from these economic developments on our business, including reduced consumer demand for products; insolvency of our customers, resulting in increased provisions for credit losses; insolvency of our key suppliers resulting in product delays; inability of retailers and consumers to obtain credit to finance purchases of our products; decreased consumer confidence; decreased retail demand, including order delays or cancellations; counterparty failures negatively impacting our treasury operations; inability for us, our customers and our suppliers to accurately forecast future product demand trends; and adverse movements in foreign currency exchange rates. If such conditions are experienced in future periods, our industry, business and results of operations may be severely impacted.
We recently terminated our contracts with Mattress Firm, our largest customer, and this will have a significant negative impact on our sales and profitability in the short term, and if we are unable to recapture these lost sales through other retailers and other channels, over the longer term.
Mattress Firm, which was acquired by Steinhoff in September 2016 and is a customer within the North America segment, was our largest customer in 2016. In February 2016, Mattress Firm acquired Sleepy’s, another large customer. As a result of this acquisition, Mattress Firm and Sleepy's combined represented 21.4% and 23.7% of our sales for the year ended December 31, 2016 and 2015, respectively.
9
During the week of January 23, 2017, we were unexpectedly notified by the senior management of Mattress Firm and representatives of its parent, Steinhoff, of Mattress Firm’s intent to terminate all of Mattress Firm’s contracts with us in the U.S. if we did not agree to considerable changes to its agreements, including significant economic concessions. We engaged in discussions to facilitate a mutually agreeable supply arrangement with Mattress Firm. However, the parties were unable to reach an agreement, and we issued formal termination notices for all of our brands to Mattress Firm as of January 27, 2017. We expect we will wind down our business with Mattress Firm during the first quarter of 2017.
We expect that the termination of our relationship with Mattress Firm will have a significant negative impact on our financial performance in the short-term, but that this termination is in the long term interests of our stockholders. In the short term, we expect that the wind-down of our relationship with Mattress Firm may disrupt the retail mattress market as Mattress Firm closes out its inventory of Tempur and Sealy products. In addition, we expect that the loss of Mattress Firm as a customer will cause a decrease in our market share in the U.S. in 2017 and will cause our net sales in 2017 to decline from our net sales in 2016, and as a result we expect to be less profitable in 2017 as compared to 2016. If we are unable to recapture this market share and net sales or manage our cost structure in light of the decreased volume of sales, this will have a significant negative impact on our net sales and profitability. In the first quarter of 2017 we expect to incur restructuring charges and non-cash write offs related to certain prepaid items and intangibles associated with the Mattress Firm relationship. In addition, as a result of the Mattress Firm termination, indicators of impairment with respect to intangible assets may exist that will require further analysis in the first quarter of 2017. For more information about the anticipated impacts of the Mattress Firm termination and our plans going forward to address the anticipated impacts, please see “Management’s Discussion and Analysis of Financial Condition and Results of Operations - Factors That Could Impact Results of Operations” included in Part II, ITEM 7 of this Report.
Because we depend on our significant customers, a decrease or interruption in their business with us would reduce our sales and results of operations.
Our top five customers, collectively, accounted for approximately 38.7% of our sales for 2016. Sales to Mattress Firm represented approximately 21.4% of our sales for 2016. Excluding Mattress Firm, our revised top five customers (the second to sixth largest customers in 2016) represented approximately 19.5% of our sales. The credit environment in which our customers operate has been relatively stable over the past few years. We expect that some of the retailers that carry our products may consolidate, undergo restructurings or reorganizations, experience financial difficulty, or realign their affiliations, any of which could decrease the number of stores that carry our products or increase the ownership concentration in the retail industry. An increase in the concentration of our sales to large customers may negatively affect our profitability due to the impact of volume and other incentive programs related to these customers. Furthermore, as sales to our large customers grow, our credit exposure to these customers may also increase. Some of these retailers may decide to carry only a limited number of brands of mattress products, which could affect our ability to sell products to them on favorable terms, if at all. A substantial decrease or interruption in business from these significant customers could result in the loss of future business and could reduce liquidity and profitability. In addition, the timing of large purchases by these customers could have an increasingly significant impact on our quarterly net sales and earnings. In addition, if Steinhoff or Mattress Firm acquired one or more significant retailers in the U.S. and these retailers thereafter chose not to do business with us, that could adversely impact our net sales and profitability.
Our sales growth is dependent upon our ability to implement strategic initiatives and actions taken to increase sales growth may not be effective.
Our ability to generate sales growth is dependent upon a number of factors, including the following:
• | our ability to continuously improve our products to offer new and enhanced consumer benefits and better quality; |
• | the ability of our future product launches to increase net sales; |
• | the effectiveness of our advertising campaigns and other marketing programs in building product and brand awareness, driving traffic to our distribution channels and increasing sales; |
• | our ability to expand into new distribution channels and grow our existing channels, including our current roll-out of Sealy mattress products in various international markets; |
• | our ability to continue to successfully execute our strategic initiatives; |
• | the level of consumer acceptance of our products; and |
• | general economic factors that negatively impact consumer confidence, disposable income or the availability of consumer financing. |
10
We operate in the highly competitive mattress and pillow industries, and if we are unable to compete successfully, we may lose customers and our sales may decline.
Participants in the mattress and pillow industries compete primarily on price, quality, brand name recognition, product availability and product performance and compete across a range of distribution channels.
A number of our significant competitors offer mattress and pillow products that compete directly with our products. Any such competition by established manufacturers or new entrants into the market could have a material adverse effect on our business, financial condition and operating results. In addition, mattress and pillow manufacturers and retailers are seeking to increase their channels of distribution and are looking for new ways to reach the consumer, including the recent expansion in the number of companies pursuing online direct-to-consumer models for foam mattresses. In addition, retailers outside the U.S. have integrated vertically in the furniture and bedding industries, and it is possible that Mattress Firm, Steinhoff and others may acquire other retailers and/or may seek to vertically integrate in the U.S. by acquiring a mattress manufacturer. The pillow industry is characterized by a large number of competitors, none of which are dominant. The highly competitive nature of the mattress and pillow industries means we are continually subject to the risk of loss of market share, loss of significant customers, reductions in margins, and the inability to acquire new customers.
We are subject to a pending tax proceeding in Denmark, and an adverse decision or a negotiated settlement could adversely impact our results of operations and cash flows.
We have received income tax assessments from the Danish Tax Authority (“SKAT”). We believe the process to reach a final resolution of this matter could potentially extend over a number of years. If we are not successful in defending our position that we owe no additional taxes, we could be required to pay a significant amount to SKAT. In addition, we are pursuing a settlement with SKAT, which could also require us to pay a significant amount to SKAT in excess of any related reserve. Each of these outcomes could have a material adverse impact on our results of operations and cash flows. In addition, prior to any ultimate resolution of this issue before the Danish National Tax Tribunal ("Tribunal"), the appeals division within SKAT, or the Danish courts, or a settlement of the matter with SKAT, based on a change in facts and circumstances, we may be required to further increase our uncertain tax liability associated with this matter, which could have a material impact on our reported earnings. For a description of these assessments and additional information with respect to these assessments and the various related legal proceedings, see “Legal Proceedings” included in Part I, ITEM 3 of this Report and Note 12, “Income Taxes,” in our Consolidated Financial Statements included in Part II, ITEM 8 of this Report, and "Management's Discussion and Analysis" included in Part II, ITEM 7 of this Report.
Changes in tax laws and regulations or other factors could cause our income tax rate to increase, potentially reducing net income and adversely affecting cash flows, and fluctuations in our tax obligations and effective tax rate may result in volatility of our financial results and stock price.
We are subject to taxation in various jurisdictions around the world and at any one time multiple tax years are subject to audit by various taxing jurisdictions. In preparing financial statements, we calculate our annual effective income tax rate based on current tax laws and regulations and the estimated taxable income within each of these jurisdictions. Our effective income tax rate, however, may be higher due to numerous factors, including, but not limited to, changes in accounting methods or policies, tax laws or regulations, the tax litigation environment in each such jurisdiction, and the outcome of pending or future audits, whether the result of litigation or negotiations with taxing authorities. Each such item may result in a tax liability that differs from our original estimate. An effective income tax rate that is significantly higher than currently anticipated could have an adverse effect on our net income and cash flows. In addition, there could be ongoing variability in our quarterly tax rates as events occur and exposures are evaluated, which could adversely affect our quarterly results of operations and stock price.
Officials in some of the jurisdictions in which we do business, including the U.S., have proposed or announced that they are considering changes in tax laws and/or other revenue raising laws and regulations, including how U.S. multi-national corporations are taxed on earnings. Additionally, the global tax environment is becoming more complex, with government tax authorities becoming increasingly more aggressive in asserting claims for taxes. Any resulting changes in tax laws or regulations could increase our effective income tax rate or impose new restrictions, costs or prohibitions on our current practices and reduce our net income and adversely affect our cash flows.
11
In addition to the increased activity of taxing authorities with respect to income tax, taxing authorities are also becoming more aggressive in asserting claims for indirect taxes such as import duties and value added tax. These types of claims present risks and uncertainties similar to those discussed above. We believe we are in compliance with all tax laws and regulations that govern such indirect taxes in each of the jurisdictions in which we do business. However, because the claims taxing authorities assert often involve the question of internal product pricing, which is inherently subjective in nature, any such claim may require us to litigate the matter to defend our position or to negotiate a settlement on the matter with the taxing authorities that differs from the amount of potential exposure recorded in the financial statements.
We rely significantly on information technology and any failure, inadequacy, interruption or security lapse of that technology could harm our ability to effectively operate our business.
Our ability to effectively manage our business depends significantly on our information systems. The failure of our current systems, or future upgrades, to operate effectively or to integrate with other systems, or a breach in security of these systems could cause reduced efficiency of our operations, and remediation of any such failure, problem or breach could reduce our liquidity and profitability. Any disruptions caused by the failure of these systems could adversely impact our day-to-day business and decision making and could have a material adverse effect on our performance.
We have successfully implemented a new enterprise resource planning, or “ERP,” system across several of our global subsidiaries. We are continuing this implementation and expanding into our North America segment. This new system will continue to replace a substantial portion of our legacy systems currently supporting our operations. If we are unable to successfully implement the replacement of the legacy systems, it could lead to a disruption in our business and unanticipated additional use of capital and other resources, which may adversely impact our results of operations. In addition, if the cost of implementing this ERP system increases above our estimates, this could have a significant adverse effect on our profitability.
Our leverage may limit our flexibility and increase our risk of default.
As a result of our acquisition of Sealy in 2013 and the implementation of our share repurchase program in 2016, our long-term debt has increased substantially, which, in turn, has increased our leverage (for information regarding these topics, see “Management’s Discussion and Analysis” included in Part II, ITEM 7 of this Report and Note 6, “Debt,” in our Consolidated Financial Statements included in Part II, ITEM 8 of this Report.
Our degree of leverage could have important consequences to our investors, such as:
• | increasing our vulnerability to adverse economic, industry or competitive developments; |
• | requiring a substantial portion of our cash flow from operations to be dedicated to the payment of principal and interest on our indebtedness, thereby reducing our ability to use our cash flow to fund our operations, capital expenditures and other business opportunities; |
• | making it more difficult for us to satisfy our obligations with respect to our indebtedness; |
• | restricting us from making strategic acquisitions or investments or causing us to make non-strategic divestitures; |
• | limiting our ability to obtain additional financing for working capital, capital expenditures, product development, debt service requirements, acquisitions and general corporate or other purposes; |
• | limiting our flexibility in planning for, or reacting to, changes in our business or the industry in which we operate, placing us at a competitive disadvantage compared to our competitors who are less highly leveraged and who therefore, may be able to take advantage of opportunities that our leverage prevents us from exploiting; |
• | exposing us to variability in interest rates, as a substantial portion of our indebtedness is and will be at variable rates; and |
• | limiting our ability to return capital to our stockholders, including through share repurchases. |
In addition, the instruments governing our debt contain financial and other restrictive covenants, which limit our operating flexibility and could prevent us from taking advantage of business opportunities and reduce our flexibility to respond to changing business and economic conditions, which could put us at a competitive disadvantage. Our failure to comply with these covenants may result in an event of default. If such event of default is not cured or waived, we may suffer adverse effects on our operations, business or financial condition, including acceleration of our debt. For further discussion regarding our debt covenants and compliance, refer to “Management’s Discussion and Analysis” included in Part II, ITEM 7 of this Report and Note 6, “Debt,” in our Consolidated Financial Statements included in Part II, ITEM 8 of this Report.
12
We may be unable to sustain our profitability, which could impair our ability to service our indebtedness and make investments in our business and could adversely affect the market price for our stock and increase our leverage.
Our ability to service our indebtedness depends on our ability to maintain our profitability. We may not be able to maintain our profitability on a quarterly or annual basis in future periods. Further, our profitability will depend upon a number of factors, including without limitation:
• | general economic conditions in the markets in which we sell our products and the impact on consumers and retailers; |
• | the level of competition in the mattress and pillow industry; |
• | our ability to successfully identify and respond to emerging trends in the mattress and pillow industry; |
• | our ability to successfully launch new products; |
• | our ability to effectively sell our products through our distribution channels in volumes sufficient to drive growth and leverage our cost structure and advertising spending; |
• | our ability to reduce costs, including our ability to align our cost structure with sales in the existing economic environment; |
• | our ability to successfully manage our relationships with our major customers; |
• | our ability to absorb fluctuations in commodity costs; |
• | our ability to maintain efficient, timely and cost-effective production and utilization of our manufacturing capacity; and |
• | our ability to maintain efficient, timely and cost-effective delivery of our products, and our ability to maintain public recognition of our brands. |
We are vulnerable to interest rate risk with respect to our debt, which could lead to an increase in interest expense.
We are subject to interest rate risk in connection with the variable rate debt under our debt agreements. Interest rate changes could increase the amount of our interest payments and thus, negatively impact our future earnings and cash flows. Although we refinanced a significant portion of our variable rate debt in 2016 and 2015 with fixed rate debt, we still have a significant amount of variable rate debt outstanding. For information regarding our sensitivity to changes in interest rates, refer to “Quantitative and Qualitative Disclosures About Market Risk” included in Part II, ITEM 7A of this Report.
We may be adversely affected by fluctuations in exchange rates, which could affect our results of operations, the costs of our products and our ability to sell our products in foreign markets.
Approximately 24% of our net sales were generated outside of the U.S. in 2016. As a multinational company, we conduct our business in a wide variety of currencies and are therefore subject to market risk for changes in foreign exchange rates. If the U.S. dollar strengthened relative to the Euro or other foreign currencies where we have operations, there would be a negative impact on our operating results upon translation of those foreign operating results into the U.S. dollar. In 2016, foreign currency exchange rate changes negatively impacted our net income by approximately 3.4% and adjusted EBITDA, which is a non-U.S. generally accepted accounting principle ("GAAP") financial measure, by approximately 2.0%. In 2017, we expect foreign exchange could continue to negatively impact our results of operations. Changes in foreign currency exchange rates could have an adverse impact on our financial condition, results of operations and cash flows. We do not hedge the translation of foreign currency operating results into the U.S. dollar.
We use foreign exchange forward contracts to manage a portion of the exposure to the risk of the eventual net cash inflows and outflows resulting from foreign currency denominated transactions between our subsidiaries and their customers and suppliers, as well as among certain subsidiaries. These foreign exchange forward contracts have maturities ranging from January 2017 to September 2017. These hedging transactions may not succeed in managing our foreign currency exchange rate risk.
Refer to “Management's Discussion and Analysis” included in Part II, ITEM 7 of this Report and “Quantitative and Qualitative Disclosures About Market Risk” included in Part II, ITEM 7A of this Report for further discussion on the impact of foreign exchange rates on our operations.
13
We are subject to fluctuations in the cost of raw materials, and increases in these costs would reduce our liquidity and profitability.
The bedding industry has been challenged by volatility in the price of petroleum-based and steel products, which affects the cost of polyurethane foam, polyester, polyethylene foam and steel innerspring component parts. The price and availability of these raw materials are subject to market conditions affecting supply and demand. Given the significance of the cost of these materials to our products, volatility in the prices of the underlying commodities can significantly affect profitability. To the extent we are unable to absorb higher costs, or pass any such higher costs to our customers, our gross margin could be negatively affected, which could result in a decrease in our liquidity and profitability.
If we, or our service providers, are unable to adequately protect our information assets from cyber-based attacks or other security incidents, our operations could be disrupted and our reputation could be damaged.
We are increasingly dependent on information technology, including the Internet, for the storage, processing, and transmission of our electronic, business-related information assets. We leverage our internal information technology infrastructures, and those of our service providers, to enable, sustain and support our global business interests. In the event that we or our service providers are unable to prevent, detect and remediate cyber-based attacks or other security incidents in a timely manner, our operations could be disrupted or we may incur financial or reputational losses arising from the theft, alteration, misuse, unauthorized disclosure or destruction of our information assets.
We cannot guarantee that we will repurchase our common stock pursuant to our stock repurchase program or that our stock repurchase program will enhance long-term stockholder value. Stock repurchases could also increase the volatility of the price of our common stock and could diminish our cash reserves.
On February 1, 2016, our Board of Directors authorized a stock repurchase program pursuant to which the Company was authorized to repurchase shares of our common stock for a total repurchase price of not more than $200.0 million. During 2016 our Board of Directors increased the total authorization to $600.0 million. As of December 31, 2016, the Company had repurchased 8.7 million shares for approximately $533.0 million under the share repurchase authorization and had approximately $67.0 million remaining under the existing share repurchase authorization. In February 2017 our Board of Directors increased this share repurchase authorization by $200 million, and at February 16, 2017 we had available approximately $227 million under this amended share repurchase authorization. Although our Board of Directors has authorized the stock repurchase program, the stock repurchase program does not obligate us to repurchase any specific dollar amount or to acquire any specific number of shares and may be suspended or terminated at any time. Stock may be purchased from time to time, in the open market or through private transactions, subject to market conditions, in compliance with applicable state and federal securities laws. The timing and amount of repurchases, if any, will depend upon several factors, including market and business conditions, restrictions in our debt agreements, the trading price of our common stock and the nature of other investment opportunities. In addition, repurchases of our common stock pursuant to our stock repurchase program could affect the market price of our common stock or increase its volatility. For example, the existence of a stock repurchase program could cause our stock price to be higher than it would be in the absence of such a program and could potentially reduce the market liquidity for our stock. Additionally, our stock repurchase program could diminish our cash reserves, which may impact our ability to finance future growth and to pursue possible future strategic opportunities and acquisitions. There can be no assurance that any stock repurchases will enhance stockholder value because the market price of our common stock may decline below the levels at which we determine to repurchase our stock. Although our stock repurchase program is intended to enhance long-term stockholder value, there is no assurance that it will do so and short-term stock price fluctuations could reduce the program’s effectiveness.
Our new product launches may not be successful due to development delays, failure of new products to achieve anticipated levels of market acceptance and significant costs associated with failed product introductions, which could adversely affect our revenues and profitability.
Each year we invest significant time and resources in research and development to improve our product offerings and launch new products. There are a number of risks inherent in our new product line introductions, including that the anticipated level of market acceptance may not be realized, which could negatively impact our sales. Also, introduction costs, the speed of the rollout of the product and manufacturing inefficiencies may be greater than anticipated, which could impact profitability.
14
Our operating results are subject to fluctuations, including as a result of seasonality, which could make sequential quarter to quarter comparisons an unreliable indication of our performance and adversely affect the market price of our common stock.
A significant portion of our net sales are attributable to our Retail channel, particularly net sales to furniture and bedding stores. We believe that our sales of products to furniture and bedding stores are typically subject to modest seasonality inherent in the bedding industry, with sales expected to be generally lower in the second and fourth quarters. Our sales in a particular quarter can be impacted by new product launches. Additionally, the U.S. bedding industry generally experiences increases in sales around holidays and promotional periods.This seasonality means that a sequential quarter to quarter comparison may not be a good indication of our performance or of how we will perform in the future. We may not experience our typical seasonality in 2017 as we pursue our strategy to recapture market share in the U.S.
We are subject to risks from our international operations, such as complying with U.S. and foreign laws, foreign exchange exposure, tariffs, increased costs, political risks and our ability to expand in certain international markets, which could impair our ability to compete and our profitability.
We are a global company, selling our products in approximately 100 countries worldwide. We generated approximately 24% of our net sales outside of the U.S. in 2016, and we continue to pursue additional international opportunities. We also participate in international license and joint venture arrangements with independent third parties. Our international operations are subject to the customary risks of operating in an international environment, including complying with U.S. laws affecting operations outside of the U.S. such as the Foreign Corrupt Practices Act; complying with foreign laws and regulations, including disparate anti-corruption laws and regulations; risks associated with varying local business customs; and the potential imposition of trade or foreign exchange restrictions, tariffs and other tax increases, fluctuations in exchange rates, inflation and unstable political situations and labor issues. We are also limited in our ability to independently expand in certain international markets where we have granted licenses to manufacture and sell Sealy® bedding products. Fluctuations in the rate of exchange between currencies in which we do business may affect our financial condition or results of operations.
If we are not able to protect our trade secrets or maintain our trademarks, patents and other intellectual property, we may not be able to prevent competitors from developing similar products or from marketing in a manner that capitalizes on our trademarks, and this loss of a competitive advantage could decrease our profitability and liquidity.
We rely on patents and trade secrets to protect the design, technology and function of our products. To date, we have not sought U.S. or international patent protection for our principal product formula for TEMPUR® material and certain of our manufacturing processes. Accordingly, we may not be able to prevent others from developing certain visco-elastic material and products that are similar to or competitive with our products. Our ability to compete effectively with other companies also depends, to a significant extent, on our ability to maintain the proprietary nature of our owned and licensed intellectual property. We own a significant number of patents or have patent applications pending on some aspects of our products and certain manufacturing processes. However, the principal product formula and manufacturing processes for our TEMPUR® material are not patented and we must maintain these as trade secrets in order to protect this intellectual property. We own U.S. and foreign registered trademarks and service marks and have applications for the registration of trademarks and service marks pending domestically and abroad. We also license certain intellectual property rights from third parties.
Certain of our trademarks are currently registered in the U.S. and are registered or pending in foreign jurisdictions. Certain other trademarks are the subject of protection under common law. However, those rights could be circumvented, or violate the proprietary rights of others, or we could be prevented from using them if challenged. A challenge to our use of our trademarks could result in a negative ruling regarding our use of our trademarks, their validity or their enforceability, or could prove expensive and time consuming in terms of legal costs and time spent defending against such a challenge. Any loss of trademark protection could result in a decrease in sales or cause us to spend additional amounts on marketing, either of which could decrease our liquidity and profitability. In addition, if we incur significant costs defending our trademarks, that could also decrease our liquidity and profitability. In addition, we may not have the financial resources necessary to enforce or defend our trademarks. Furthermore, our patents may not provide meaningful protection and patents may never issue from pending applications. It is also possible that others could bring claims of infringement against us, as our principal product formula and manufacturing processes are not patented, and that any licenses protecting our intellectual property could be terminated. If we were unable to maintain the proprietary nature of our intellectual property and our significant current or proposed products, this loss of a competitive advantage could result in decreased sales or increased operating costs, either of which would decrease our liquidity and profitability.
15
In addition, the laws of certain foreign countries may not protect our intellectual property rights and confidential information to the same extent as the laws of the U.S. or the European Union. Third parties, including competitors, may assert intellectual property infringement or invalidity claims against us that could be upheld. Intellectual property litigation, which could result in substantial cost to and diversion of effort by us, may be necessary to protect our trade secrets or proprietary technology, or for us to defend against claimed infringement of the rights of others and to determine the scope and validity of others’ proprietary rights. We may not prevail in any such litigation, and if we are unsuccessful, we may not be able to obtain any necessary licenses on reasonable terms or at all.
Loss of suppliers and disruptions in the supply of our raw materials could increase our costs of sales and reduce our ability to compete effectively.
We acquire raw materials and certain components from a number of suppliers with manufacturing locations around the world. If we were unable to obtain raw materials and certain components from these suppliers for any reason, we would have to find replacement suppliers. Any substitute arrangements for raw materials and certain components might not be on terms as favorable to us. In addition, we outsource the procurement of certain goods and services from suppliers in foreign countries. If we were no longer able to outsource through these suppliers, we could source them elsewhere, perhaps at a higher cost. We maintain relatively small supplies of our raw materials and outsourced goods at our manufacturing facilities, and any disruption in the on-going shipment of supplies to us could interrupt production of our products, which could result in a decrease of our sales or could cause an increase in our cost of sales, either of which could decrease our liquidity and profitability.
In our Sealy products, raw materials consist of polyurethane foam, polyester, polyethylene foam and steel innerspring components that we purchase from various suppliers. In the U.S. and Canada, we source the majority of our requirements for polyurethane foam components and spring components for our Sealy and Stearns & Foster mattress units from a key supplier for each component. These components are purchased under supply agreements. We also purchase a significant portion of our Sealy foundation parts from third party sources under supply agreements. We do not consider ourselves to be dependent in the long term upon any single outside vendor as a source of supply to our bedding business, and we believe over time that sufficient alternative sources of supply for the same, similar or alternative components are available. However, for many of these components if our key supplier for the applicable component failed to supply components in the amount we require this could significantly interrupt production of our products and increase our production costs.
The loss of the services of any members of our executive management team could impair our ability to execute our business strategy and as a result, reduce our sales and profitability.
We depend on the continued services of our executive management team. The loss of key personnel could have a material adverse effect on our ability to execute our business strategy and on our financial condition and results of operations. We do not maintain key-person insurance for members of our executive management team.
Deterioration in labor relations could disrupt our business operations and increase our costs, which could decrease our liquidity and profitability.
As of December 31, 2016, we had approximately 7,300 full-time employees. Approximately 34.2% of our employees are represented by various labor unions with separate collective bargaining agreements or government labor union contracts for certain international locations. Our North American collective bargaining agreements, which are typically three years in length, expire at various times during any given three year period. Due to the large number of collective bargaining agreements, we are periodically in negotiations with certain of the unions representing our employees. We may at some point be subject to work stoppages by some of our employees and, if such events were to occur, there may be a material adverse effect on our operations and profitability. Further, we may not be able to renew our various collective bargaining agreements on a timely basis or on favorable terms, or at all. Any significant increase in our labor costs could decrease our liquidity and profitability and any deterioration of employee relations, slowdowns or work stoppages at any of our locations, whether due to union activities, employee turnover or otherwise, could result in a decrease in our net sales or an increase in our costs, either of which could decrease our liquidity and profitability.
16
We may face exposure to product liability claims, which could reduce our liquidity and profitability and reduce consumer confidence in our products.
We face an inherent business risk of exposure to product liability claims if the use of any of our products results in personal injury or property damage. In the event that any of our products prove to be defective, we may be required to recall, redesign or even discontinue those products. We maintain insurance against product liability claims, but such coverage may not continue to be available on terms acceptable to us or be adequate for liabilities actually incurred. A successful claim brought against us in excess of available insurance coverage could impair our liquidity and profitability, and any claim or product recall that results in significant adverse publicity against us could result in consumers purchasing fewer of our products, which would also impair our liquidity and profitability.
Regulatory requirements, including, but not limited to, trade, environmental, health and safety requirements, may require costly expenditures and expose us to liability.
Our products and our marketing and advertising programs are subject to regulation in the U.S. by various federal, state and local regulatory authorities, including the Federal Trade Commission and the U.S. Food and Drug Administration. In addition, other governments and agencies in other jurisdictions regulate the sale and distribution of our products. These rules and regulations may change from time to time, or may conflict. There may be continuing costs of regulatory compliance including continuous testing, additional quality control processes and appropriate auditing of design and process compliance. For example, the U.S. Consumer Product Safety Commission (“CPSC”) and many foreign jurisdictions have adopted rules relating to fire retardancy standards for the mattress industry. Further, some states and the U.S. Congress continue to consider fire retardancy regulations that may be different or more stringent than the CPSC standard. Adoption of multi-layered regulatory regimes, particularly if they conflict with each other, could increase our costs, alter our manufacturing processes and impair the performance of our products which may have an adverse effect on our business. We are also subject to various health and environmental provisions, such as California Proposition 65 (the Safe Drinking Water and Toxic Enforcement Act of 1986) and 16 CFR Part 1633 (Standard for the Flammability (Open Flame) of Mattress Sets).
Our marketing and advertising practices could also become the subject of proceedings before regulatory authorities or the subject of claims by other parties and could require us to alter or end these practices or adopt new practices that are not as effective or are more expensive.
In addition, we are subject to federal, state and local laws and regulations relating to pollution, environmental protection and occupational health and safety. We may not be in complete compliance with all such requirements at all times. We have made and will continue to make capital and other expenditures to comply with environmental and health and safety requirements. If a release of hazardous substances occurs on or from our properties or any associated offsite disposal location, or if contamination from prior activities is discovered at any of our properties, we may be held liable and the amount of such liability could be material. As a manufacturer of bedding and related products, we use and dispose of a number of substances, such as glue, lubricating oil, solvents and other petroleum products, as well as certain foam ingredients, that may subject us to regulation under numerous foreign, federal and state laws and regulations governing the environment. Among other laws and regulations, we are subject in the U.S. to the Federal Water Pollution Control Act, the Comprehensive Environmental Response, Compensation and Liability Act, the Resource Conservation and Recovery Act, the Clean Air Act and related state and local statutes and regulations.
Our operations could also be impacted by a number of pending legislative and regulatory proposals to address greenhouse gas emissions in the U.S. and other countries. Certain countries have adopted the Kyoto Protocol. New greenhouse gas reduction targets have been established under the Kyoto Protocol, as amended, and certain countries, including Denmark, have adopted the new reduction targets. This and other international initiatives under consideration could affect our International operations. These actions could increase costs associated with our operations, including costs for raw materials, pollution control equipment and transportation. Because it is uncertain what laws will be enacted, we cannot predict the potential impact of such laws on our future consolidated financial condition, results of operations, or cash flows.
We have made and will continue to make capital and other expenditures to comply with environmental and health and safety requirements. In the event contamination is discovered with respect to one or more of our current or former properties, government authorities or third parties may bring claims related to these properties, which could have a material effect on our profitability.
17
Our pension plans are currently underfunded and we may be required to make cash payments to the plans, reducing our available cash.
We maintain certain defined benefit pension plans. In addition, hourly employees working at certain of Sealy’s domestic manufacturing facilities are covered by union sponsored retirement and health and welfare plans. These plans cover both active employees and retirees. The plans are currently underfunded, and under certain circumstances, including the decision to close or sell a facility, we could be required to pay amounts with respect to this underfunding. Such events may significantly impair our profitability and liquidity and the possibility of having to make these payments could affect our decision on whether to close or sell a particular facility. For more information, refer to Note 7, “Retirement Plans,” in our Consolidated Financial Statements included in Part II, ITEM 8 of this Report.
Challenges to our pricing or promotional allowance policies or practices could adversely affect our operations.
Certain of our retail pricing and promotional allowance policies or practices are subject to antitrust regulations in the U.S. and abroad. If antitrust regulators or private parties in any jurisdiction in which we do business initiate investigations or claims that challenge our pricing or promotional allowance policies or practices, our efforts to respond could force us to divert management resources and we could incur significant unanticipated costs. If such an investigation or claim were to result in a charge that our practices or policies were in violation of applicable antitrust or other laws or regulations, we could be subject to significant additional costs of defending such charges in a variety of venues and, ultimately, if there were a finding that we were in violation of antitrust or other laws or regulations, there could be an imposition of fines, and damages for persons injured, as well as injunctive or other relief. Any requirement that we pay fines or damages (which, under the laws of certain jurisdictions, may be trebled) could decrease our liquidity and profitability, and any investigation or claim that requires significant management attention or causes us to change our business practices could disrupt our operations or increase our costs, also resulting in a decrease in our liquidity and profitability. An antitrust class action or individual suit against us could result in potential liabilities, substantial costs, treble damages, and the diversion of our management’s attention and resources, regardless of the outcome.
Our stock price is likely to continue to be volatile, your investment could decline in value, and we may incur significant costs from class action litigation.
The trading price of our common stock is likely to continue to be volatile and subject to wide price fluctuations. The trading price of our common stock may fluctuate significantly in response to various factors, including but not limited to:
• | actual or anticipated variations in our quarterly and annual operating results, including those resulting from seasonal variations in our business; |
• | general economic conditions, such as unemployment, changes in short-term and long-term interest rates and fluctuations in both debt and equity capital markets; |
• | introductions or announcements of technological innovations or new products by us or our competitors; |
• | disputes or other developments relating to proprietary rights, including patents, litigation matters, and our ability to patent, or otherwise protect, our products and technologies; |
• | changes in estimates by securities analysts of our financial performance or the financial performance of our competitors or major customers or statements by others in the investment community relating to such performance; |
• | stock repurchase programs; |
• | bankruptcies of any of our major customers; |
• | loss of any of our major customers; |
• | conditions or trends in the mattress industry generally; |
• | additions or departures of key personnel; |
• | announcements by us or our competitors or significant retailer customers of significant acquisitions, strategic partnerships, joint ventures or capital commitments; |
• | announcements by our competitors or our major customers of their quarterly operating results or announcements by our competitors or our major customers of their views on trends in the bedding industry; |
• | regulatory developments in the U.S. and abroad; |
• | economic and political factors; |
• | public announcements or filings with the SEC indicating that significant stockholders, directors or officers are buying or selling shares of our common stock; and |
• | the declaration or suspension of a cash dividend. |
18
In addition, the stock market in general has experienced significant price and volume fluctuations that have often been unrelated or disproportionate to operating performance. These broad market factors may seriously harm the market price of our common stock, regardless of our operating performance.
In the past, following periods of volatility in the market price of a company’s securities, securities class action litigation has often been instituted. A securities class action suit against us could result in potential liabilities, substantial costs, and the diversion of our management’s attention and resources, regardless of the outcome. See “Legal Proceedings” included in Part I, ITEM 3 of this Report.
Future sales of our common stock may depress our stock price.
The market price of our common stock could decline as a result of sales of substantial amounts of our common stock in the public market, or the perception that these sales could occur. In addition, these factors could make it more difficult for us to raise funds through future offerings of common stock. All shares of our common stock are freely transferable without restriction or further registration under the Securities Act, except for certain shares of our common stock which were purchased by our executive officers, directors, principal stockholders, and some related parties.
We have stockholders who presently beneficially own more than 5.0% of our outstanding capital stock. Sales or other dispositions of our shares by these major stockholders may depress our stock price.
Delaware law and our certificate of incorporation and bylaws contain anti-takeover provisions, and our Board of Directors has adopted a limited duration stockholder rights agreement, any of which could delay or discourage a merger, tender offer, or assumption of control of the Company not approved by our Board of Directors that some stockholders may consider favorable.
Provisions of Delaware law and our certificate of incorporation and by-laws could hamper a third party’s acquisition of us, or discourage a third party from attempting to acquire control of us. You may not have the opportunity to participate in these transactions. These provisions could also limit the price that investors might be willing to pay in the future for shares of our common stock. These provisions include:
• | our ability to issue preferred stock with rights senior to those of the common stock without any further vote or action by the holders of our common stock; |
• | the requirements that our stockholders provide advance notice when nominating our directors; and |
• | the inability of our stockholders to convene a stockholders’ meeting without the chairperson of the Board of Directors, the president, or a majority of the Board of Directors first calling the meeting. |
In addition, our Board of Directors recently adopted a short-term stockholder rights agreement with an expiration date of February 7, 2018 and an ownership trigger threshold of 20%. This stockholder rights agreement could render more difficult, or discourage a merger, tender offer, or assumption of control of the Company that is not approved by our Board of Directors. The rights agreement, however, should not interfere with any merger, tender or exchange offer or other business combination approved by our Board of Directors. In addition, the rights agreement does not prevent our Board of Directors from considering any offer that it considers to be in the best interest of the Company’s stockholders.
ITEM 1B. UNRESOLVED STAFF COMMENTS
None.
19
ITEM 2. PROPERTIES
The following table sets forth certain information regarding our principal facilities at December 31, 2016.
Name | Location | Approximate Square Footage | Title | Type of Facility | ||||
North America | ||||||||
Tempur Production USA, LLC | Albuquerque, New Mexico | 800,000 | Leased (a) | Manufacturing | ||||
Sealy Mattress Manufacturing Co., LLC | Hagerstown, Maryland | 615,600 | Leased | Manufacturing | ||||
Sealy Mattress Manufacturing Co., LLC | Plainfield, Indiana | 614,000 | Leased | Manufacturing | ||||
Tempur Production USA, LLC | Duffield, Virginia | 581,000 | Owned (a) | Manufacturing | ||||
Sealy Mattress Manufacturing Co., LLC | Conyers, Georgia | 300,000 | Owned (a) | Manufacturing | ||||
Sealy Mattress Manufacturing Co., LLC | Green Island, New York | 257,000 | Leased | Manufacturing | ||||
Sealy Mattress Manufacturing Co., LLC | Richmond, California | 241,000 | Owned (a) | Manufacturing | ||||
Sealy Mattress Manufacturing Co., LLC | Orlando, Florida | 225,050 | Leased | Manufacturing | ||||
Sealy Mattress Manufacturing Co., LLC | Brenham, Texas | 220,500 | Owned (a) | Manufacturing | ||||
Sealy Mattress Manufacturing Co., LLC | Batavia, Illinois | 210,000 | Leased | Manufacturing | ||||
Tempur Production USA, LLC | Mountain Top, Pennsylvania | 210,000 | Leased | Manufacturing | ||||
Sealy Mattress Manufacturing Co., LLC | Trinity, North Carolina | 180,000 | Owned (a) | Manufacturing | ||||
Sealy Mattress Manufacturing Co., LLC | South Gate, California | 172,000 | Leased | Manufacturing | ||||
Sealy Canada, Ltd | Alberta, Canada | 144,500 | Owned | Manufacturing | ||||
Sealy Mattress Manufacturing Co., LLC | Medina, Ohio | 140,000 | Owned (a) | Manufacturing | ||||
Sealy Mattress Manufacturing Co., LLC | Williamsport, Maryland | 134,500 | Leased | Manufacturing | ||||
Sealy Mattress Manufacturing Co., LLC | Lacey, Washington | 134,000 | Leased | Manufacturing | ||||
Sealy Mattress Manufacturing Co., LLC | Kansas City, Kansas | 122,000 | Leased | Manufacturing | ||||
Sealy Mattress Manufacturing Co., LLC | Phoenix, Arizona | 120,000 | Leased | Manufacturing | ||||
Sealy Canada, Ltd | Toronto, Canada | 120,000 | Leased | Manufacturing | ||||
Sealy, Inc. | Trinity, North Carolina | 105,500 | Owned (a) | Office | ||||
Sealy Mattress Manufacturing Co., LLC | St. Paul, Minnesota | 93,600 | Owned (a) | Manufacturing | ||||
Sealy Canada, Ltd | Quebec, Canada | 88,000 | Owned | Manufacturing | ||||
Sealy Mattress Manufacturing Co., LLC | Denver, Colorado | 82,000 | Owned (a) | Manufacturing | ||||
Tempur-Pedic Management, LLC | Lexington, Kentucky | 77,400 | Owned (a) | Office | ||||
Sealy Mattress Company of Puerto Rico | Carolina, Puerto Rico | 44,000 | Owned | Manufacturing | ||||
International | ||||||||
Dan-Foam ApS | Aarup, Denmark | 523,000 | Owned | Manufacturing | ||||
Sealy Argentina SRL | Buenos Aires, Argentina | 144,000 | Owned | Manufacturing | ||||
Tempur Deutschland GmbH | Steinhagen, Germany | 143,500 | Owned | Warehouse | ||||
Sealy Mattress Company Mexico, S. de R.L. de C.V. | Toluca, Mexico | 130,500 | Owned | Manufacturing | ||||
Tempur UK Ltd | Middlesex, United Kingdom | 61,000 | Leased | Warehouse | ||||
Tempur France | Ile de France, France | 53,800 | Leased | Warehouse | ||||
(a) | We have granted a mortgage or otherwise encumbered our interest in this facility as collateral for secured indebtedness. | |
In addition to the properties listed above, we have other facilities in other countries, the majority under leases with one to ten year terms. The manufacturing facility in Albuquerque, New Mexico is leased as part of the related industrial revenue bond financing. We have an option to repurchase the property for one dollar upon termination of the lease.
We believe that our existing properties are suitable for the conduct of our business, are adequate for our present needs and will be adequate to meet our future needs.
20
ITEM 3. LEGAL PROCEEDINGS
(a) Alvin Todd, and Henry and Mary Thompson, individually and on behalf of all others similarly situated, Plaintiffs v. Tempur Sealy International, Inc., formerly known as Tempur-Pedic International, Inc. and Tempur-Pedic North America, LLC, Defendants; filed October 25, 2013.
On October 25, 2013, a suit was filed against Tempur Sealy International and one of its domestic subsidiaries in the U.S. District Court for the Northern District of California, purportedly on behalf of a proposed class of “consumers” as defined by Cal. Civ. Code § 1761(d) who purchased, not for resale, a Tempur-Pedic mattress or pillow in the State of California. On November 19, 2013, the Company was served for the first time in the case but with an amended petition adding additional class representatives for additional states. The purported classes seek certification of claims under applicable state laws.
The complaint alleges that the Company engaged in unfair business practices, false advertising, and misrepresentations or omissions related to the sale of certain products. The plaintiffs seek restitution, injunctive relief and all other relief allowed under applicable state laws, interest, attorneys’ fees and costs. The purported classes do not seek damages for physical injuries. The Company believes the case lacks merit and intends to defend against the claims vigorously. The Court was scheduled to consider class certification motions in the fourth quarter of 2015; however, the plaintiffs filed a Motion to Amend the Complaint, at which time the Company filed a Motion to Dismiss the Amended Complaint. A hearing on the Motion to Dismiss was held January 28, 2016 and the Court denied in part and granted in part the Company’s Motion to Dismiss allowing certain claims to proceed. The Court considered class certification motions in August 2016, and in September 2016, denied the Plaintiffs’ motion for class certification. In December 2016, the Ninth Circuit Court of Appeals affirmed the lower court’s decision. It is unclear what additional actions the plaintiffs may take in light of the denial of class certification. As a result, the outcome of the case remains unclear, and the Company is unable to reasonably estimate the possible loss or range of losses, if any, arising from this litigation, or whether the Company’s applicable insurance policies will provide sufficient coverage for these claims. Accordingly, the Company can give no assurance that this matter will not have a material adverse effect on the Company’s financial position or results of operations.
(b) Income tax assessments. The Company has received income tax assessments from SKAT. The Company believes the process to reach a final resolution of this matter could potentially extend over a number of years. If the Company is not successful in defending its position that the Company owes no additional taxes, the Company could be required to pay a significant amount to SKAT. In addition, the Company is pursuing a settlement with SKAT, which could also require the Company to pay a significant amount to SKAT in excess of any related reserve. Each of these outcomes could have a material adverse impact on the Company's results of operations and cash flows. In addition, prior to any ultimate resolution of this issue before the Tribunal or the Danish courts, or a settlement of the matter with SKAT, based on a change in facts and circumstances, the Company may be required to further increase its uncertain tax liability associated with this matter, which could have a material impact on the Company's reported earnings. For a description of these assessments and additional information with respect to these assessments and the various related legal proceedings, see Note 12, “Income Taxes,” in the Company's Consolidated Financial Statements included in Part II, ITEM 8 of this Report.
(c) Other. The Company is involved in various other legal proceedings incidental to the operations of its business. The Company believes that the outcome of all such pending legal proceedings in the aggregate will not have a material adverse effect on its business, financial condition, liquidity, or operating results.
ITEM 4. MINE SAFETY DISCLOSURES
None.
PART II
ITEM 5. MARKET FOR REGISTRANT’S COMMON EQUITY, RELATED STOCKHOLDER MATTERS AND ISSUER PURCHASES OF EQUITY SECURITIES
Market for Registrant’s Common Equity
Our sole class of common equity is our $0.01 par value common stock, which trades on the New York Stock Exchange (NYSE) under the symbol “TPX.” Trading of our common stock commenced on the NYSE on December 18, 2003. Prior to that time, there was no public trading market for our common stock.
21
The following table sets forth the high and low sales prices per common share, at closing, of our common stock as reported by the NYSE.
Price Range | |||||||
High | Low | ||||||
Fiscal 2016 | |||||||
First Quarter | $ | 69.32 | $ | 52.51 | |||
Second Quarter | 62.76 | 53.95 | |||||
Third Quarter | 82.04 | 53.95 | |||||
Fourth Quarter | 68.99 | 50.94 | |||||
Fiscal 2015 | |||||||
First Quarter | $ | 59.14 | $ | 49.17 | |||
Second Quarter | 67.18 | 56.35 | |||||
Third Quarter | 78.64 | 67.50 | |||||
Fourth Quarter | 81.89 | 70.46 | |||||
As of February 21, 2017, we had approximately 90 stockholders of record of our common stock.
Dividends
We do not pay a dividend. The decision to pay a dividend in future periods is reviewed by our Board of Directors on a periodic basis. Further, we are subject to certain customary restrictions on dividends under our 2016 Credit Agreement and Indentures. See Note 6, "Debt," in our Consolidated Financial Statements, included in Part II, ITEM 8 of this Report, for a discussion of the 2016 Credit Agreement and Indentures.
Issuer Purchases of Equity Securities
On February 1, 2016, our Board of Directors authorized a stock repurchase program pursuant to which we were authorized to repurchase shares of our common stock for a total repurchase price of not more than $200.0 million. During 2016 our Board of Directors increased the total authorization to $600.0 million. As of December 31, 2016, we had repurchased 8.7 million shares for approximately $533.0 million under the share repurchase authorization and had approximately $67.0 million remaining under the existing share repurchase authorization. In February 2017, our Board of Directors increased this share repurchase authorization by $200 million, and at February 16, 2017 we had available approximately $227 million under this amended share repurchase authorization.
Stock repurchases under this program may be made through open market transactions, negotiated purchases or otherwise, at times and in such amounts as management deems appropriate. The timing and actual number of shares repurchased will depend on a variety of factors including price, financing, regulatory requirements and other market conditions. The program does not require the repurchase of any minimum number of shares and may be suspended, modified or discontinued at any time without prior notice. Repurchases may be made under a Rule 10b5-1 plan, which would permit shares to be repurchased when we might otherwise be precluded from doing so under federal securities laws.
Equity Compensation Plan Information
Equity compensation plan information required by this Item is incorporated by reference from Part III, ITEM 12 of this Report.
Performance Graph
The following Performance Graph and related information shall not be deemed to be “soliciting material” or to be “filed” with the Securities and Exchange Commission, nor shall such information be incorporated by reference into any future filing under the Securities Act or Exchange Act, except to the extent that the Company specifically incorporates it by reference into such filing.
22
The following table compares cumulative stockholder returns for us over the last five years to the Standard & Poor’s ("S&P") 500 Stock Composite Index, and a peer group. The S&P 500 Composite Index is a capitalization weighted index of 500 stocks intended to be a representative sample of leading companies in leading industries within the U.S. economy, and are chosen for market size, liquidity and industry group representation. We believe the peer group closely reflects our business and, as a result, provides a meaningful comparison of stock performance.
The peer issuers included in this graph are set forth below in the table. In 2016 the peer group was changed to remove Mattress Firm Holding Corp., which was acquired in 2016 by Steinhoff, and to remove Newell Rubbermaid and Jarden, which combined during 2016 and no longer meet our revenue criteria. In 2016 the peer group was also changed to add La-Z-Boy and Lululemon Athletica.
2016 Peer Group
Brunswick Corp. | Harman International Industries, Inc. | Polaris Industries Inc. |
Carter's, Inc. | Hasbro, Inc. | Select Comfort Corp. |
Columbia Sportswear Co. | La-Z-Boy | Steelcase Inc. |
Deckers Outdoor Corp. | Leggett & Platt, Inc. | Tupperware Brands Corp. |
Dorel Industries Inc. | Lexmark International, Inc. | Under Armour, Inc. |
Fossil Group, Inc. | Lululemon Athletica | Williams-Sonoma, Inc. |
Gildan Activewear Inc. | Herman Miller, Inc. | Wolverine World Wide, Inc. |
HanesBrands Inc. | Mohawk Industries, Inc. | |
2015 Peer Group
Brunswick Corp. | Harman International Industries, Inc. | Newell Rubbermaid Inc. |
Carter's, Inc. | Hasbro, Inc. | Polaris Industries Inc. |
Columbia Sportswear Co. | Jarden Corp. | Select Comfort Corp. |
Deckers Outdoor Corp. | Leggett & Platt, Inc. | Steelcase Inc. |
Dorel Industries Inc. | Lexmark International, Inc. | Tupperware Brands Corp. |
Fossil Group, Inc. | Mattress Firm Holding Corp. | Under Armour, Inc. |
Gildan Activewear Inc. | Herman Miller, Inc. | Williams-Sonoma, Inc. |
HanesBrands Inc. | Mohawk Industries, Inc. | Wolverine World Wide, Inc. |
23
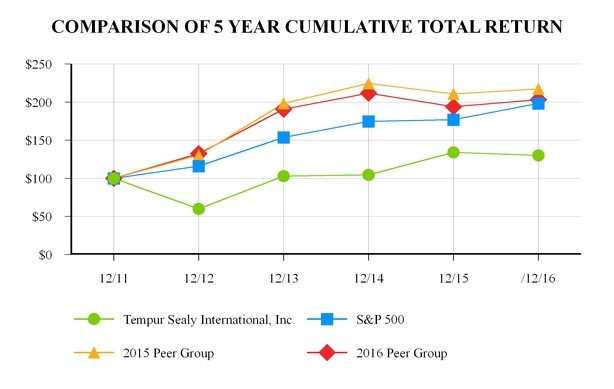
12/31/2011 | 12/31/2012 | 12/31/2013 | 12/31/2014 | 12/31/2015 | 12/31/2016 | |||||||||||||||||||
Tempur Sealy International, Inc. | $ | 100.00 | $ | 59.95 | $ | 102.72 | $ | 104.53 | $ | 134.13 | $ | 129.98 | ||||||||||||
S&P 500 | 100.00 | 116.00 | 153.58 | 174.60 | 177.01 | 198.18 | ||||||||||||||||||
2015 Peer Group | 100.00 | 130.36 | 198.15 | 224.53 | 210.83 | 217.07 | ||||||||||||||||||
2016 Peer Group | 100.00 | 132.43 | 190.64 | 211.58 | 193.81 | 202.99 | ||||||||||||||||||
24
ITEM 6. SELECTED FINANCIAL DATA
The following table sets forth our selected historical consolidated financial and operating data for the periods indicated. We have derived our statements of income and balance sheet data as of and for the years ended December 31, 2016, 2015, 2014, 2013 and 2012 from our audited financial statements. Our Consolidated Financial Statements as of December 31, 2016 and 2015 and for each of the three years in the period ended December 31, 2016 are included in Part II, ITEM 8 of this Report.
(in millions, except per common share amounts) | |||||||||||||||||||
Statement of Income Data: | 2016 | 2015 | 2014 | 2013 (1) | 2012 | ||||||||||||||
Net sales | $ | 3,127.3 | $ | 3,151.2 | $ | 2,989.8 | $ | 2,464.3 | $ | 1,402.9 | |||||||||
Cost of sales | 1,817.9 | 1,902.3 | 1,839.4 | 1,449.4 | 688.3 | ||||||||||||||
Gross profit | 1,309.4 | 1,248.9 | 1,150.4 | 1,014.9 | 714.6 | ||||||||||||||
Operating expense, net | 893.9 | 939.8 | 874.1 | 771.1 | 466.3 | ||||||||||||||
Operating income | 415.5 | 309.1 | 276.3 | 243.8 | 248.3 | ||||||||||||||
Interest expense, net | 85.2 | 96.1 | 91.9 | 110.8 | 18.8 | ||||||||||||||
Loss on extinguishment of debt | 47.2 | — | — | — | — | ||||||||||||||
Loss on disposal, net | — | — | 23.2 | — | — | ||||||||||||||
Other (income) expense, net | (0.2 | ) | 12.9 | (13.7 | ) | 5.0 | 0.3 | ||||||||||||
Income before income taxes | 283.3 | 200.1 | 174.9 | 128.0 | 229.2 | ||||||||||||||
Income tax provision (2) | (86.8 | ) | (125.4 | ) | (64.9 | ) | (49.1 | ) | (122.4 | ) | |||||||||
Net income before non-controlling interests | 196.5 | 74.7 | 110.0 | 78.9 | 106.8 | ||||||||||||||
Less: net (loss) income attributable to non-controlling interests | (5.6 | ) | 1.2 | 1.1 | 0.3 | — | |||||||||||||
Net income attributable to Tempur Sealy International, Inc. | $ | 202.1 | $ | 73.5 | $ | 108.9 | $ | 78.6 | $ | 106.8 | |||||||||
Balance Sheet Data (at end of period): | |||||||||||||||||||
Cash and cash equivalents | $ | 65.7 | $ | 153.9 | $ | 62.5 | $ | 81.0 | $ | 179.3 | |||||||||
Total assets (3) | 2,702.6 | 2,655.5 | 2,582.7 | 2,729.9 | 1,319.5 | ||||||||||||||
Total debt (3) | 1,779.0 | 1,420.8 | 1,537.0 | 1,808.9 | 1,025.0 | ||||||||||||||
Capital leases and other debt | 109.1 | 34.0 | 27.7 | 27.6 | — | ||||||||||||||
Redeemable non-controlling interest | 7.6 | 12.4 | 12.6 | 11.5 | — | ||||||||||||||
Total stockholders' (deficit) equity | (12.2 | ) | 290.2 | 202.7 | 118.6 | 22.3 | |||||||||||||
Other Financial and Operating Data: | |||||||||||||||||||
Dividends per common share | $ | — | $ | — | $ | — | $ | — | $ | — | |||||||||
Depreciation and amortization (4) | 89.5 | 93.9 | 89.7 | 91.5 | 42.0 | ||||||||||||||
Net cash provided by operating activities | 165.5 | 234.2 | 225.2 | 98.5 | 189.9 | ||||||||||||||
Net cash used in investing activities | (62.4 | ) | (59.7 | ) | (10.4 | ) | (1,213.0 | ) | (55.0 | ) | |||||||||
Net cash (used in) provided by financing activities | (185.1 | ) | (90.7 | ) | (238.1 | ) | (1,013.4 | ) | 70.8 | ||||||||||
Basic earnings per common share | 3.43 | 1.19 | 1.79 | 1.30 | 1.74 | ||||||||||||||
Diluted earnings per common share | 3.38 | 1.17 | 1.75 | 1.28 | 1.70 | ||||||||||||||
Capital expenditures | 62.4 | 65.9 | 47.5 | 40.0 | 50.5 | ||||||||||||||
(1) | Includes Sealy results of operations from March 18, 2013 through December 31, 2013. Information presented for periods prior to March 18, 2013 do not include Sealy and as a result, the information may not be comparable. |
(2) | Income tax provision for 2015 includes approximately $60.7 million related to changes in estimate related to the uncertain tax position regarding the Danish Tax Matter, as defined in Note 12, "Income Taxes," in our Consolidated Financial Statements included in Part II, ITEM 8 of this Report. |
(3) | Includes issuance of $375.0 million of 2020 Senior Notes in December 2012, with cash proceeds held in escrow at December 31, 2012. The net proceeds from the 2020 Senior Notes were used as part of the financing for the 2013 acquisition of Sealy Corporation and its subsidiaries. Refer to Note 6, “Debt,” in our Consolidated Financial Statements included in Part II, ITEM 8 of this Report for additional information regarding the 2020 Senior Notes. |
(4) | Includes $16.2 million, $22.5 million, $13.4 million, $16.9 million, $5.7 million in non-cash, stock-based compensation expense related to restricted stock units, performance restricted stock units, deferred stock units and stock options in 2016, 2015, 2014, 2013, and 2012, respectively. |
25
ITEM 7. MANAGEMENT'S DISCUSSION AND ANALYSIS OF FINANCIAL CONDITION AND RESULTS OF OPERATIONS
The following discussion and analysis should be read in conjunction with Part II, ITEM 6 of this Report and the audited Consolidated Financial Statements and accompanying notes thereto included elsewhere in this Report. Unless otherwise noted, all of the financial information in this Report is consolidated financial information for the Company. The forward-looking statements in this discussion regarding the mattress and pillow industries, our expectations regarding our future performance, liquidity and capital resources and other non-historical statements in this discussion are subject to numerous risks and uncertainties. See “Special Note Regarding Forward-Looking Statements” and Part I, ITEM 1A of this Report. Our actual results may differ materially from those contained in any forward-looking statements.
In this discussion and analysis, we discuss and explain the consolidated financial condition and results of operations for the years ended December 31, 2016, 2015 and 2014, including the following topics:
• | an overview of our business and strategy; |
• | factors impacting results of operations; |
• | results of operations including our net sales and costs in the periods presented as well as changes between periods; |
• | expected sources of liquidity for future operations; and |
• | our use of certain non-GAAP financial measures. |
Business Overview
General
We are the world's largest bedding manufacturer. We develop, manufacture, market, and distribute bedding products, which we sell globally. Our brand portfolio includes many highly recognized brands in the industry, including our Tempur products sold under the TEMPUR® and Tempur-Pedic® brands, and our Sealy products sold under the Sealy®, Sealy Posturepedic®, and Stearns & Foster® brands. Our comprehensive suite of bedding products offers a variety of products to consumers across a broad range of channels.
We sell our products through two distribution channels in each operating business segment: Retail (furniture and bedding retailers, department stores, specialty retailers and warehouse clubs); and Other (directly to consumers through e-commerce platforms, company owned stores and call centers, and to third party, healthcare and hospitality and customers).
Business Segments
We operate under two reportable segments: North America and International. Corporate operating expenses are not included in either of the segments and are presented separately as a reconciling item to consolidated results. These segments are strategic business units that are managed separately based on geography. Our North America segment consists of Tempur and Sealy manufacturing and distribution subsidiaries, joint ventures and licensees located in the U.S. and Canada. Our International segment consists of Tempur and Sealy manufacturing and distribution subsidiaries, joint ventures and licensees located in Europe, Asia-Pacific and Latin America. We evaluate segment performance based on net sales, gross profit and operating income.
Strategy
We are the world’s largest bedding manufacturer and the only manufacturer with global scale. Our long-term strategy is to drive earnings growth. Our goal is to improve the sleep of more people, every night, all around the world. In order to achieve our long-term strategy while managing the current economic and competitive environments, we will focus on developing the best bedding products, investing in our brands, expanding our North America margins while maintaining market share, growing our market share in International and optimizing our worldwide distribution. Through our strategy, we will generate earnings growth and strong cash flow that will be used to reduce debt to the extent appropriate and return value to stockholders. For a complete overview of our business, including a description of our business segments, see "Business" under Part I, ITEM 1 of this Report.
Factors That Could Impact Results of Operations
The factors outlined below could impact our future results of operations. For more extensive discussion of these and other risk factors, please refer to "Risk Factors" under Part I, ITEM 1A in this Report.
26
General Business and Economic Conditions
Our business has been affected by general business and economic conditions, and these conditions could have an impact on future demand for our products. The global economic environment continues to be challenging, and we expect the uncertainty to continue. We continue to make strategic investments, including: introducing new products; investing in increasing our global brand awareness; extending our presence and improving our Retail account productivity and distribution; investing in our operating infrastructure to meet the requirements of our business; and taking other actions to further strengthen our business.
Termination of Mattress Firm Relationship
Mattress Firm, which was acquired by Steinhoff in September 2016 and is a customer within the North America segment, is our largest customer. In February 2016, Mattress Firm acquired Sleepy’s, another large customer. As a result of this acquisition, Mattress Firm and Sleepy's combined represented 21.4% and 23.7% of our sales for the year ended December 31, 2016 and 2015, respectively. Our net sales to Mattress Firm declined 10.6% in 2016 as compared to 2015, including sales to Sleepy’s in both years. Excluding net sales to Mattress Firm, our net sales increased 2.3% in 2016 as compared to 2015.
During the week of January 23, 2017, we were unexpectedly notified by the senior management of Mattress Firm and representatives of Steinhoff of Mattress Firm's intent to terminate all of Mattress Firm's contracts with us in the U.S. if we did not agree to considerable changes to our agreements with Mattress Firm, including significant economic concessions. We engaged in discussions to facilitate a mutually agreeable supply arrangement with Mattress Firm. However, the parties were unable to reach an agreement, and we issued formal termination notices for all of our brands to Mattress Firm as of January 27, 2017. We agreed to continue supplying Mattress Firm for an additional two months. We expect that the termination of our relationship with Mattress Firm will have a significant negative impact on our financial performance in the short-term, but that this termination is in the long-term interests of our stockholders.
In the short-term, we expect that the wind down of our relationship with Mattress Firm may disrupt the retail mattress market as Mattress Firm closes out its inventory of Tempur and Sealy products. In addition, we expect that the loss of Mattress Firm as a customer will cause a decrease in our market share in the U.S. in 2017 and will cause our net sales in 2017 to decline from our net sales in 2016, and as a result we expect to be less profitable in 2017 as compared to 2016. In order to address this issue and recapture market share and lost sales, we will work with our existing retailers to expand their offerings of our products and expand our distribution with new retailers and other distribution channels. Our ability to improve our net sales performance in 2017 as compared to current expectations will be driven primarily by how quickly we can recapture market share and net sales.
With respect to our cost structure, we expect to take steps in the first quarter of 2017 to manage our cost structure, primarily in areas of our operations that are most significantly dependent on the level of our sales. In the first quarter of 2017, due to the termination of the contract with Mattress Firm, we expect there will be some restructuring charges and non-cash write offs. In managing our business and our costs going forward, we intend to manage our business with the primary goal of recapturing market share and net sales, and accordingly our expense reductions in the areas of manufacturing and marketing are not expected to be significant. On the manufacturing side of our operations, we will accept some lower operating efficiencies in the short term to retain our high quality manufacturing capabilities, which we expect the market will need over time. On the marketing side, we expect to increase our investment on an absolute dollar basis and as a percentage of sales consistent with our long-term strategy of building and maintaining our brands to drive sales, and this may have an incremental negative impact on our profitability in the short-term.
With respect to our cash flow and liquidity, we expect that over the first half of 2017 the impact of the Mattress Firm termination will be unfavorable as compared to the first half of 2016. In the first quarter of 2017, we expect to incur some restructuring charges and non-cash write offs related to certain prepaid items and intangible assets associated with the Mattress Firm relationship. In addition, as a result of the Mattress Firm termination, indicators of impairment may exist with respect to our intangible assets that will require further analysis in the first quarter of 2017.
With respect to the financial covenants in our debt facilities, we expect to remain in compliance with our financial covenants through the end of 2017 and beyond, notwithstanding the decrease in net sales and other impacts referred to above.
For further discussion of the risks associated with large customers, refer to our "Risk Factors" under Part I, ITEM 1A in this Report.
27
Exchange Rates
As a multinational company, we conduct our business in a wide variety of currencies and are therefore subject to market risk for changes in foreign currency exchange rates. Foreign currency exchange rate movements also create a degree of risk by affecting the U.S. dollar value of sales made and costs incurred in foreign currencies. We use foreign exchange forward contracts to manage a portion of the exposure to the risk of the eventual net cash inflows and outflows resulting from foreign currency denominated transactions between our subsidiaries and their customers and suppliers, as well as among certain subsidiaries. These hedging transactions may not succeed in managing our foreign currency exchange rate risk. Consequently, our reported earnings and financial position could fluctuate materially as a result of foreign exchange gains or losses. Additionally, the operations of our foreign currency denominated subsidiaries result in foreign currency translation fluctuations in our consolidated operating results. These operations do not constitute transactions which qualify for hedge accounting treatment. Therefore, we do not hedge the translation of foreign currency operating results into the U.S. dollar. Should currency rates change sharply, our results could be negatively impacted. In 2016, foreign currency exchange rate changes negatively impacted our net income by 3.4% and our adjusted EBITDA, which is a non-GAAP financial measure, by approximately 2.0%. In 2017, we expect foreign exchange rate fluctuations could continue to negatively impact our results of operations.
Competition
Participants in the bedding industry compete primarily on price, quality, brand name recognition, product availability, and product performance. We compete with a number of different types of mattress alternatives, including standard innerspring mattresses, visco-elastic mattresses, foam mattresses, hybrid innerspring/foam mattresses, futons, air beds and other air-supported mattresses. These alternative products are sold through a variety of channels, including furniture and bedding stores, department stores, mass merchants, wholesale clubs, internet, telemarketing programs, television infomercials, television advertising and catalogs.
Our North America segment competes in various mattress categories, and contributed 82.2% of our net sales for the year ended December 31, 2016. These mattress categories are highly competitive, with many competitor products supported by aggressive marketing campaigns and promotions. The international market for mattresses and pillows is generally served by a large number of manufacturers, primarily operating on a regional and local basis. These manufacturers offer a broad range of mattress and pillow products. In addition, mattress and pillow manufacturers and retailers are seeking to increase their channels of distribution and are looking for new ways to reach the consumer, including the recent expansion in the number of companies pursuing online direct-to-consumer models for foam mattresses. As a result of this or increased competition, our results could be negatively impacted.
Gross Margins
Our gross margin is primarily impacted by the relative amount of net sales contributed by our Tempur and Sealy products. Our Sealy products have a significantly lower gross margin than our Tempur products. Our Sealy mattress products range from value to premium priced offerings, and gross margins are typically higher on premium products compared to value priced offerings. Our Tempur products are exclusively premium priced products. As sales of our Sealy products increase relative to sales of our Tempur products, our gross margins will be negatively impacted in both our North America and International segments.
Our gross margin is also impacted by fixed cost leverage based on manufacturing unit volumes; the cost of raw materials; operational efficiencies due to the utilization in our manufacturing facilities; product, channel and geographic mix; foreign exchange fluctuations; volume incentives offered to certain retail accounts; participation in our retail cooperative advertising programs; and costs associated with new product introductions. Future changes in raw material prices could have a significant impact on our gross margin, and we expect commodity inflation of approximately $15 million in 2017. Our margins are also impacted by the growth in our Retail channel as sales in our Retail channel are at wholesale prices whereas sales in our Direct channel are at retail prices.
New Product Development and Introduction
Each year we invest significant time and resources in research and development to improve our product offerings. There are a number of risks inherent in our new product line introductions, including that the anticipated level of market acceptance may not be realized, which could negatively impact our sales. Also, product introduction costs, the speed of the rollout of the product and manufacturing inefficiencies may be greater than anticipated, which could impact profitability.
28
In 2017, we are planning significant new product introductions in our North America and International segments. In North America, we are uniting all of our Sealy products under one masterbrand. We expect to incur lower costs associated with new product introductions in North America as compared to 2016, given we only introduced premium products in 2016. In our International segment, we are relaunching our flagship line of Tempur mattresses to feature the iconic aesthetics similar to Tempur-Pedic mattresses that we currently sell in North America.
Financial Leverage and Liquidity
As of December 31, 2016, we had $1,901.0 million of debt outstanding, and our adjusted EBITDA, which is a non-GAAP financial measure, was $521.6 million. Higher financial leverage makes us more vulnerable to general adverse competitive, economic and industry conditions. There can be no assurance that our business will generate sufficient cash flow from operations or that future borrowing will be available. As of December 31, 2016, our ratio of funded debt less qualified cash to EBITDA in accordance with our 2016 Credit Agreement was 3.60 times, within the covenant in our debt agreements which limits this ratio to 5.00 times for the year ended December 31, 2016. For more information on this non-GAAP measure and compliance with our 2016 Credit Agreement, please refer to “Non-GAAP Financial Information” below.
Danish Tax Proceeding
As described in Note 12, "Income Taxes," of the Notes to the Consolidated Financial Statements included in Part II, ITEM 8 of this Report, the Company is the subject of significant outstanding tax assessments asserted by SKAT. Any decision by the Company to achieve a negotiated settlement of this matter, or if the Company does not enter into a negotiated settlement of this matter, a negative outcome in the related legal proceedings, could require the Company to make a significant payment, which could have a material adverse effect on the Company’s results of operations and liquidity. In addition, if the Company is required to further increase its uncertain tax liability for this matter, based on a change in facts and circumstances, this could have a material impact on the Company's reported earnings.
Integration
In 2016, we completed the operational integration of the legacy Tempur and Sealy businesses in our North America and International segments. Integration expenses were $2.0 million in the current year as compared to $28.6 million in the prior year.
Results of Operations
A summary of our results for the year ended December 31, 2016 include:
• | Total net sales decreased 0.8% to $3,127.3 million from $3,151.2 million in 2015. On a constant currency basis, which is a non-GAAP financial measure, total net sales increased 0.7%, with growth in both the North America and International business segments. |
• | Gross margin was 41.9% as compared to 39.6% in 2015. Adjusted gross margin, which is a non-GAAP financial measure, was 41.9% as compared to 40.1% in 2015. |
• | Net income was $202.1 million as compared to $73.5 million in 2015. During the fourth quarter of 2015, we re-evaluated our uncertain tax position regarding the Danish Tax Matter. As a result of the re-evaluation, including consideration of certain events that occurred during the fourth quarter of 2015, we recorded a change in estimate of its uncertain tax positions related to this matter of approximately $60.7 million. Adjusted net income, which is a non-GAAP financial measure, increased 21.3% to $242.4 million as compared to $199.9 million in 2015. |
• | Earnings before interest, taxes, depreciation and amortization ("EBITDA"), which is a non-GAAP financial measure, increased 31.3% to $510.8 million as compared to $388.9 million in 2015. Adjusted EBITDA, which is a non-GAAP financial measure, increased 14.4% to $521.6 million as compared to $455.8 million in 2015. |
• | Operating income increased 34.4% to $415.5 million, as compared to $309.1 million in 2015. Adjusted operating income, which is a non-GAAP financial measure, was $425.0 million, or 13.6% of net sales, as compared to $373.8 million, or 11.9% of net sales, in 2015. |
• | Earnings per share ("EPS") was $3.38 as compared to $1.17 in 2015. Adjusted EPS, which is a non-GAAP financial measure, increased 27.0% to $4.05 as compared to adjusted EPS of $3.19 in 2015. On a constant currency basis, which is a non-GAAP financial measure, adjusted EPS increased 30.7%. |
29
For a discussion and reconciliation of non-GAAP financial measures as discussed above to the corresponding GAAP financial results, refer to the non-GAAP financial information set forth below under the heading "Non-GAAP Financial Information."
We may refer to net sales or earnings or other historical financial information on a “constant currency basis,” which is a non-GAAP financial measure. These references to constant currency basis do not include operational impacts that could result from fluctuations in foreign currency rates. To provide information on a constant currency basis, the applicable financial results are adjusted based on a simple mathematical model that translates current period results in local currency using the comparable prior year period’s currency conversion rate. This approach is used for countries where the functional currency is the local country currency. This information is provided so that certain financial results can be viewed without the impact of fluctuations in foreign currency rates, thereby facilitating period-to-period comparisons of business performance. Constant currency information is not recognized under GAAP, and it is not intended as an alternative to GAAP measures. Refer to Part II, ITEM 7A of this Report for a discussion of our foreign currency exchange rate risk.
30
The following table sets forth the various components of our Consolidated Statements of Income, and expresses each component as a percentage of net sales:
(in millions, except percentages and | Year Ended December 31, | |||||||||||||||||||
per common share amounts) | 2016 | 2015 | 2014 | |||||||||||||||||
Net sales | $ | 3,127.3 | 100.0 | % | $ | 3,151.2 | 100.0 | % | $ | 2,989.8 | 100.0 | % | ||||||||
Cost of sales | 1,817.9 | 58.1 | 1,902.3 | 60.4 | 1,839.4 | 61.5 | ||||||||||||||
Gross profit | 1,309.4 | 41.9 | 1,248.9 | 39.6 | 1,150.4 | 38.5 | ||||||||||||||
Selling and marketing expenses | 648.5 | 20.7 | 648.0 | 20.6 | 619.9 | 20.7 | ||||||||||||||
General, administrative and other expenses | 278.2 | 8.9 | 322.0 | 10.2 | 280.6 | 9.4 | ||||||||||||||
Equity income in earnings of unconsolidated affiliates | (13.3 | ) | (0.4 | ) | (11.9 | ) | (0.4 | ) | (8.3 | ) | (0.3 | ) | ||||||||
Royalty income, net of royalty expense | (19.5 | ) | (0.6 | ) | (18.3 | ) | (0.6 | ) | (18.1 | ) | (0.6 | ) | ||||||||
Operating income | 415.5 | 13.3 | 309.1 | 9.8 | 276.3 | 9.3 | ||||||||||||||
Other expense, net: | ||||||||||||||||||||
Interest expense, net | 85.2 | 2.7 | 96.1 | 3.0 | 91.9 | 3.1 | ||||||||||||||
Loss on extinguishment of debt | 47.2 | 1.5 | — | — | — | — | ||||||||||||||
Loss on disposal, net | — | — | — | — | 23.2 | 0.8 | ||||||||||||||
Other (income) expense, net | (0.2 | ) | (0.1 | ) | 12.9 | 0.5 | (13.7 | ) | (0.4 | ) | ||||||||||
Total other expense | 132.2 | 4.1 | 109.0 | 3.5 | 101.4 | 3.5 | ||||||||||||||
Income before income taxes | 283.3 | 9.1 | 200.1 | 6.3 | 174.9 | 5.8 | ||||||||||||||
Income tax provision | (86.8 | ) | (2.8 | ) | (125.4 | ) | (4.0 | ) | (64.9 | ) | (2.2 | ) | ||||||||
Net income before non-controlling interests | 196.5 | 6.3 | 74.7 | 2.3 | 110.0 | 3.6 | ||||||||||||||
Less: Net (loss) income attributable to non-controlling interests | (5.6 | ) | (0.2 | ) | 1.2 | — | 1.1 | — | ||||||||||||
Net income attributable to Tempur Sealy International, Inc. | $ | 202.1 | 6.5 | % | $ | 73.5 | 2.3 | % | $ | 108.9 | 3.6 | % | ||||||||
Earnings per common share: | ||||||||||||||||||||
Diluted | $ | 3.38 | $ | 1.17 | $ | 1.75 | ||||||||||||||
Weighted average common shares outstanding: | ||||||||||||||||||||
Diluted | 59.8 | 62.6 | 62.1 | |||||||||||||||||
NET SALES
Year Ended December 31, | |||||||||||||||||||||||||||||||||||
Consolidated | North America | International | |||||||||||||||||||||||||||||||||
(in millions) | 2016 | 2015 | 2014 | 2016 | 2015 | 2014 | 2016 | 2015 | 2014 | ||||||||||||||||||||||||||
Net sales by channel | |||||||||||||||||||||||||||||||||||
Retail channel | $ | 2,808.4 | $ | 2,874.5 | $ | 2,750.2 | $ | 2,419.4 | $ | 2,461.5 | $ | 2,308.6 | $ | 389.0 | $ | 413.0 | $ | 441.6 | |||||||||||||||||
Other channel | 318.9 | 276.7 | 239.6 | 150.7 | 115.7 | 96.3 | 168.2 | 161.0 | 143.3 | ||||||||||||||||||||||||||
Total net sales | $ | 3,127.3 | $ | 3,151.2 | $ | 2,989.8 | $ | 2,570.1 | $ | 2,577.2 | $ | 2,404.9 | $ | 557.2 | $ | 574.0 | $ | 584.9 | |||||||||||||||||
Net sales by product | |||||||||||||||||||||||||||||||||||
Bedding | $ | 2,891.5 | $ | 2,887.2 | $ | 2,726.5 | $ | 2,447.8 | $ | 2,428.9 | $ | 2,261.9 | $ | 443.7 | $ | 458.3 | $ | 464.6 | |||||||||||||||||
Other products | 235.8 | 264.0 | 263.3 | 122.3 | 148.3 | 143.0 | 113.5 | 115.7 | 120.3 | ||||||||||||||||||||||||||
Total net sales | $ | 3,127.3 | $ | 3,151.2 | $ | 2,989.8 | $ | 2,570.1 | $ | 2,577.2 | $ | 2,404.9 | $ | 557.2 | $ | 574.0 | $ | 584.9 | |||||||||||||||||
31
Year ended December 31, 2016 compared to year ended December 31, 2015
Net sales decreased 0.8%, and on a constant currency basis increased 0.7%. The decrease in net sales was driven by:
• | North America net sales decreased 0.3%. Net sales of Bedding products were relatively flat. Our sales to Mattress Firm decreased approximately $80 million as compared to 2015. Excluding Mattress Firm, our sales increased 4%. Net sales of Other products decreased $26.0 million, or 17.5%, primarily as a result of a decline in net sales of pillows and other accessories. Canada net sales increased 2.9%, and, on a constant currency basis, increased 6.2%. |
• | International net sales decreased 2.9% due to unfavorable foreign exchange rates. On a constant currency basis, our International net sales increased 3.9%, primarily driven by the success of new product introductions, an increase in direct sales of our Tempur products in Asia-Pacific and an increase in net sales of our Sealy products in Latin America. |
Year ended December 31, 2015 compared to year ended December 31, 2014
Net sales increased 5.4%, and on a constant currency basis increased 9.4%. The increase in net sales was driven by:
• | North America net sales increased $172.3 million, or 7.2%. On a constant currency basis, our North America net sales increased approximately 8.5%. The increase was primarily due to a $167.0 million increase in net sales of Bedding products, driven primarily by strong U.S. net sales growth across both the Tempur and Sealy brands, which benefited from new product introductions and 2015 pricing actions. This increase was offset by a 6.3% decrease in Canada net sales due to unfavorable foreign exchange rates. On a constant currency basis, Canada net sales grew 8.6%. |
• | International net sales decreased $10.9 million, or 1.9%. On a constant currency basis, our International net sales increased approximately 13.2%, primarily due to strong sales growth of our Sealy products in Asia-Pacific and Latin America. Net sales growth was also driven by an increase in sales of Tempur products through Company-owned stores. |
GROSS PROFIT
Year Ended December 31, | ||||||||||||||||||||||||||
2016 | 2015 | 2014 | Margin Change | |||||||||||||||||||||||
(in millions, except percentages) | Gross Profit | Gross Margin | Gross Profit | Gross Margin | Gross Profit | Gross Margin | 2016 vs 2015 | 2015 vs 2014 | ||||||||||||||||||
North America | $ | 1,017.4 | 39.6 | % | $ | 954.6 | 37.0 | % | $ | 834.8 | 34.7 | % | 2.6 | % | 2.3 | % | ||||||||||
International | 292.0 | 52.4 | % | 294.3 | 51.3 | % | 315.6 | 54.0 | % | 1.1 | % | (2.7 | )% | |||||||||||||
Consolidated | $ | 1,309.4 | 41.9 | % | $ | 1,248.9 | 39.6 | % | $ | 1,150.4 | 38.5 | % | 2.3 | % | 1.1 | % | ||||||||||
Costs associated with net sales are recorded in cost of sales and include the costs of producing, shipping, warehousing, receiving and inspecting goods during the period, as well as depreciation and amortization of long-lived assets used in the manufacturing process. The principal factors impacting gross profit and gross margin for each segment are discussed below in the respective segment discussions.
Year ended December 31, 2016 compared to year ended December 31, 2015
Gross margin increased 230 basis points. The increase was primarily driven by 160 basis points of operational improvements, including sourcing improvements, 40 basis points due to pricing actions, and 20 basis points from favorable product mix.
• | North America gross margin increased 260 basis points. The increase was driven primarily by 180 basis points of operational improvements, including sourcing improvements, 50 basis points due to pricing actions, and 30 basis points from favorable product mix. |
• | International gross margin increased 110 basis points. The increase was driven by 80 basis points of operational improvements and 50 basis points of favorable channel mix, as we expand distribution through more profitable direct-to-consumer channels. |
32
Year ended December 31, 2015 compared to year ended December 31, 2014
Gross margin increased 110 basis points. The increase in gross margin was primarily due to supply chain and sourcing improvements of 170 basis points, a favorable decrease in discounts of 50 basis points and 2015 pricing actions which increased gross margin 40 basis points in 2015 as compared to 2014. These factors were primarily offset by unfavorable product mix of 130 basis points.
• | North America gross margin increased 230 basis points. The increase in gross margin was primarily due to supply chain and sourcing improvements of 210 basis points, a favorable decrease in discounts of 70 basis points driven by fewer floor model discounts and improved participation in our retail cooperative advertising programs and favorable 2015 pricing actions of 50 basis points in 2015 as compared to 2014. These factors were partially offset by unfavorable product mix of 140 basis points, primarily due to the introduction of new products. |
• | International gross margin declined 270 basis points. The decline in gross margin was driven by unfavorable product mix and manufacturing costs of 160 basis points due to the increase in sales of our Sealy products relative to sales of our Tempur products. The decrease in gross margin was also due to unfavorable channel mix of 110 basis points. |
OPERATING EXPENSES
Selling and marketing expenses include advertising and media production associated with the promotion of our brands, other marketing materials such as catalogs, brochures, videos, product samples, direct customer mailings and point of purchase materials, and sales force compensation. We also include in selling and marketing expense certain new product development costs, including market research and new product testing.
General, administrative and other expenses include salaries and related expenses, information technology, professional fees, depreciation and amortization of long-lived assets not used in the manufacturing process, expenses for administrative functions and research and development costs.
Year ended December 31, 2016 compared to year ended December 31, 2015
Year Ended December 31, | |||||||||||||||||||||||||||||||
2016 | 2015 | 2016 | 2015 | 2016 | 2015 | 2016 | 2015 | ||||||||||||||||||||||||
(in millions) | Consolidated | North America | International | Corporate | |||||||||||||||||||||||||||
Operating expenses: | |||||||||||||||||||||||||||||||
Advertising | $ | 352.7 | $ | 360.5 | $ | 316.5 | $ | 323.0 | $ | 36.2 | $ | 37.5 | $ | — | $ | — | |||||||||||||||
Other selling and marketing | 295.8 | 287.5 | 169.5 | 161.1 | 123.4 | 122.3 | 2.9 | 4.1 | |||||||||||||||||||||||
General, administrative and other | 278.2 | 322.0 | 127.3 | 143.6 | 54.6 | 57.0 | 96.3 | 121.4 | |||||||||||||||||||||||
Total operating expense | $ | 926.7 | $ | 970.0 | $ | 613.3 | $ | 627.7 | $ | 214.2 | $ | 216.8 | $ | 99.2 | $ | 125.5 | |||||||||||||||
Operating expenses decreased $43.3 million or 4.5%, and decreased 120 basis points as a percentage of net sales. During 2015 and 2016, we took actions to reduce our overall operating expenses, including headcount reductions and international store closings and we expect to take actions to reduce our overall operating expenses in 2017. The primary drivers of changes in operating expenses by segment are explained below.
• | North America operating expenses decreased $14.4 million and decreased 50 basis points as a percentage of net sales. The decrease was primarily driven by decreased incentive compensation expenses, as well as lower overall operating expenses in selling and marketing expenses and general, administrative and other expenses. |
• | International operating expenses decreased $2.6 million and increased 60 basis points as a percentage of net sales. |
• | Corporate operating expenses decreased $26.3 million, or 21.0%. Executive management transition and retention compensation decreased $11.6 million and integration costs decreased $4.6 million, and additional costs related to our 2015 Annual Meeting which were not incurred in 2016 were $6.3 million. We also recorded a stock compensation benefit of $3.8 million, representing the fourth quarter change in estimate to reduce accumulated performance based stock compensation amortization to actual cost based on financial results for the year ended December 31, 2016. |
33
Research and development expenses for the year ended December 31, 2016 were $26.7 million compared to $28.7 million for the year ended December 31, 2015, a decrease of $2.0 million, or 7.0%.
Year ended December 31, 2015 compared to year ended December 31, 2014
Year Ended December 31, | |||||||||||||||||||||||||||||||
2015 | 2014 | 2015 | 2014 | 2015 | 2014 | 2015 | 2014 | ||||||||||||||||||||||||
(in millions) | Consolidated | North America | International | Corporate | |||||||||||||||||||||||||||
Operating expenses: | |||||||||||||||||||||||||||||||
Advertising | $ | 360.5 | $ | 326.7 | $ | 323.0 | $ | 282.3 | $ | 37.5 | $ | 44.4 | $ | — | $ | — | |||||||||||||||
Other selling and marketing | 287.5 | 293.2 | 161.1 | 172.5 | 122.3 | 117.8 | 4.1 | 2.9 | |||||||||||||||||||||||
General and administrative | 322.0 | 280.6 | 143.6 | 131.0 | 57.0 | 54.9 | 121.4 | 94.7 | |||||||||||||||||||||||
Total operating expense | $ | 970.0 | $ | 900.5 | $ | 627.7 | $ | 585.8 | $ | 216.8 | $ | 217.1 | $ | 125.5 | $ | 97.6 | |||||||||||||||
Operating expenses increased $69.5 million or 7.7%, and increased 70 basis points as a percentage of net sales. The primary drivers of changes in operating expenses by segment are explained below.
• | North America operating expenses increased $41.9 million but remained flat as a percentage of net sales. This increase was primarily driven by a $40.7 million increase in advertising expense, driven primarily by improved participation in our retail cooperative advertising programs. |
• | International operating expenses remained relatively flat and increased 70 basis points as a percentage of net sales. |
• | Corporate operating expenses increased $27.9 million, or 28.6%. The increase was primarily driven by a $26.7 million increase in general, administrative and other expenses, including $14.5 million of executive transition and related retention expenses and $3.2 million of restructuring costs related to headcount reductions. We also incurred $6.3 million in 2015 of additional costs related to our 2015 Annual Meeting and related issues. |
Research and development expenses for the year ended December 31, 2015 were $28.7 million compared to $21.6 million for the year ended December 31, 2014, an increase of $7.1 million, or 32.9%.
OPERATING INCOME
Year Ended December 31, | ||||||||||||||||||||||||||
2016 | 2015 | 2014 | Margin Change | |||||||||||||||||||||||
(in millions, except percentages) | Operating Income | Operating Margin | Operating Income | Operating Margin | Operating Income | Operating Margin | 2016 vs 2015 | 2015 vs 2014 | ||||||||||||||||||
North America | $ | 411.8 | 16.0 | % | $ | 335.6 | 13.0 | % | $ | 255.0 | 10.6 | % | 3.0 | % | 2.4 | % | ||||||||||
International | 102.7 | 18.4 | % | 98.9 | 17.2 | % | 118.8 | 20.3 | % | 1.2 | % | (3.1 | )% | |||||||||||||
514.5 | 434.5 | 373.8 | ||||||||||||||||||||||||
Corporate expenses | (99.0 | ) | (125.4 | ) | (97.5 | ) | ||||||||||||||||||||
Total operating income | $ | 415.5 | 13.3 | % | $ | 309.1 | 9.8 | % | $ | 276.3 | 9.2 | % | 3.5 | % | 0.6 | % | ||||||||||
Year ended December 31, 2016 compared to year ended December 31, 2015
Operating income increased $106.4 million and operating margin improved 350 basis points. The increase was driven by:
• | North America operating income increased $76.2 million and operating margin improved 300 basis points. The improvement in operating margin was primarily driven by improved gross margin of 230 basis points and an improvement in operating expense leverage of 50 basis points. |
• | International operating income increased $3.8 million and operating margin improved 120 basis points. The improvement in operating margin was primarily driven by improved gross margin of 110 basis points. |
• | Corporate operating expenses decreased $26.4 million, as discussed above, which improved our consolidated operating margin by 80 basis points. |
34
Year ended December 31, 2015 compared to year ended December 31, 2014
Operating income increased $32.8 million and operating margin improved 60 basis points. The increase was driven by:
• | North America operating income increased $80.6 million and operating margin improved 240 basis points. The improvement in operating margin was primarily driven by improved gross margin of 230 basis points. |
• | International operating income decreased $19.9 million and operating margin decreased 310 basis points. The decrease in operating margin was primarily driven by a decrease in gross margin of 270 basis points and a decrease in operating expense leverage of 50 basis points. |
• | Corporate operating expenses increased $27.9 million, as discussed above, which reduced our consolidated operating margin by 90 basis points. |
INTEREST EXPENSE, NET
Year Ended December 31, | Percent change | ||||||||||||||||
(in millions, except percentages) | 2016 | 2015 | 2014 | 2016 vs 2015 | 2015 vs 2014 | ||||||||||||
Interest expense, net | $ | 85.2 | $ | 96.1 | $ | 91.9 | (11.3 | )% | 4.6 | % | |||||||
Year ended December 31, 2016 compared to the year ended December 31, 2015
Interest expense, net, decreased $10.9 million, or 11.3%. During 2015, we recorded $12.0 million of accelerated amortization of deferred financing costs associated with the $493.8 million voluntary prepayments on our 2012 Credit Agreement, subsequent to the issuance of $450 million aggregate principal amount of 2023 Senior Notes. During 2016, in connection with the overlapping period between the issuance of the 2026 Senior Notes on May 24, 2016 and redemption of the 2020 Senior Notes on June 23, 2016, we incurred an additional $2.1 million of interest as compared to 2015. Refer to Note 6, "Debt," in our Consolidated Financial Statements included in Part II, ITEM 8 for additional information.
Year ended December 31, 2015 compared to the year ended December 31, 2014
Interest expense, net, increased $4.2 million, or 4.6%. During 2015, we recorded $12.0 million of accelerated amortization of deferred financing costs associated with the $493.8 million voluntary prepayments on our Term A Facility and Term B Facility, subsequent to the issuance of the 2023 Senior Notes. Excluding this accelerated amortization, interest expense decreased due to lower average debt levels throughout 2015 as compared to 2014.
LOSS ON EXTINGUISHMENT OF DEBT
In the second quarter of 2016, we issued our 2026 Senior Notes and entered into our 2016 Credit Agreement. The net proceeds of the 2026 Senior Notes offering were used in part to redeem the 2020 Senior Notes. The net proceeds from the 2016 Credit Agreement were used to repay in full the 2012 Credit Agreement and to pay certain transaction fees and expenses incurred in connection with the 2016 Credit Agreement. In association with these transactions, we recorded a $47.2 million loss on extinguishment of debt. The $47.2 million loss includes a $23.6 million premium on the prepayment of our 2020 Senior Notes, $11.0 million and $4.8 million of deferred financing costs write-offs for the 2012 Credit Agreement and 2020 Senior Notes, respectively, and $1.9 million and $5.9 million of lender expenses for the 2016 Credit Agreement and 2026 Senior Notes, respectively. Refer to Note 6, "Debt," in our Consolidated Financial Statements included in ITEM 8 under Part II for additional information.
LOSS ON DISPOSAL OF BUSINESS
Effective June 30, 2014, we completed the sale of our three U.S. innerspring component production facilities and equipment, along with associated working capital, to Leggett and Platt ("L&P") for total consideration of approximately $47.8 million. The working capital adjustment resulted in a cash payment to L&P of $2.8 million, which reduced the total consideration received to $45.0 million. The carrying amount of the net assets sold in this transaction, including an allocation of reporting unit goodwill determined using the relative fair value method, was approximately $66.8 million. As a result, a loss on disposal of business was recorded for $23.2 million during 2014, which included $1.4 million of transaction costs and the $2.8 million working capital adjustment.
35
OTHER (INCOME) EXPENSE, NET
Year Ended December 31, | Percent change | ||||||||||||||||
(in millions, except percentages) | 2016 | 2015 | 2014 | 2016 vs 2015 | 2015 vs 2014 | ||||||||||||
Other (income) expense, net | $ | (0.2 | ) | $ | 12.9 | $ | (13.7 | ) | (101.6 | )% | 194.2 | % | |||||
Year ended December 31, 2016 compared to year ended December 31, 2015
During 2015, we reached a settlement related to an antitrust investigation by the German Federal Cartel Office ("FCO"). Under the terms of the settlement, we paid approximately €15.5 million (approximately $17.4 million) to fully resolve this matter. The payment is not tax deductible. In addition, during 2015 we recorded $9.5 million of other income from a partial settlement of a legal dispute. Refer to Note 11, "Commitments and Contingencies," in our Consolidated Financial Statements included in Part II, ITEM 8 for additional information.
Year ended December 31, 2015 compared to year ended December 31, 2014
During 2015, we reached a settlement with the FCO, as described above. Refer to Note 11, "Commitments and Contingencies," in our Consolidated Financial Statements included in Part II, ITEM 8 for additional information. In addition, we recorded $9.5 million and $15.6 million of other income from a partial settlement of a legal dispute in 2015 and 2014, respectively.
INCOME TAXES
Year Ended December 31, | Percent change | ||||||||||||||||
(in millions, except percentages) | 2016 | 2015 | 2014 | 2016 vs 2015 | 2015 vs 2014 | ||||||||||||
Income tax | $ | 86.8 | $ | 125.4 | $ | 64.9 | (30.8 | )% | 93.2 | % | |||||||
Effective tax rate | 30.6 | % | 62.7 | % | 37.1 | % | (32.1 | )% | 25.6 | % | |||||||
Income tax provision includes income taxes associated with taxes currently payable and deferred taxes, and includes the impact of net operating losses for certain of our foreign operations.
Year ended December 31, 2016 compared to year ended December 31, 2015
Our income tax provision decreased $38.6 million and our effective tax rate decreased 32.1 percentage points. During 2015, we increased our uncertain tax liability associated with the Danish Tax Matter through a charge to income tax expense of $60.7 million. Refer to Note 12, “Income Taxes,” in our Consolidated Financial Statements included in Part II, ITEM 8 of this Report for further information.
Year ended December 31, 2015 compared to year ended December 31, 2014
Our income tax provision increased $60.5 million and our effective tax rate increased 25.6 percentage points. In 2014, upon the filing of our various 2013 U.S. federal and state income tax returns, we finalized the calculation of the tax on the repatriation of earnings and we recognized an incremental $12.2 million current income tax expense for the repatriation so described to reflect tax positions taken on the various income tax returns when filed. During 2015, we increased our uncertain tax liability associated with the Danish Tax Matter through a charge to income tax expense of $60.7 million. Refer to Note 12, “Income Taxes," in our Consolidated Financial Statements included in Part II, ITEM 8 of this Report for further information associated with this tax assessment.
Liquidity and Capital Resources
Liquidity
Our principal sources of funds are cash flows from operations, borrowings made pursuant to our credit facilities and cash and cash equivalents on hand. Principal uses of funds consist of payments of principal and interest on our debt facilities, share repurchases, capital expenditures and working capital needs. At December 31, 2016, we had working capital of $126.0 million, including cash and cash equivalents of $65.7 million as compared to working capital of $96.1 million including $153.9 million in cash and cash equivalents as of December 31, 2015.
36
The increase in working capital was primarily driven by decreases in accounts payable and the current portion of long-term debt. This was partially offset by decreases in cash and cash equivalents, as we funded our share repurchase program and other capital requirements, decrease in accounts receivable, prepaid expenses and other current assets. Accounts payable decreases are driven primarily by the timing of payments to vendors. The current portion of long-term debt decreased primarily due to the repayment of our 8.0% Sealy Notes. Accounts receivable decreases are driven primarily by net sales, in addition to timing of customer collections. Prepaid expenses and other current assets decreases are driven primarily by decreases in our foreign exchange forward contracts.
The table below presents net cash provided by (used in) operating, investing and financing activities for the years ended December 31, 2016, 2015 and 2014.
(in millions) | 2016 | 2015 | 2014 | |||||||||
Net cash provided by (used in): | ||||||||||||
Operating activities | $ | 165.5 | $ | 234.2 | $ | 225.2 | ||||||
Investing activities | (62.4 | ) | (59.7 | ) | (10.4 | ) | ||||||
Financing activities | (185.1 | ) | (90.7 | ) | (238.1 | ) | ||||||
Cash provided by operating activities decreased $68.7 million in 2016 as compared to 2015. The decrease in cash provided by operating activities was primarily the result of an increase in cash used by operating assets and liabilities, which was primarily due to the $92.0 million payment on deposit with SKAT. This decrease was offset by an increase in net income before non-controlling interest, as well as excluding the impact of the loss on extinguishment of debt of $47.2 million. The loss on extinguishment of debt was composed of a non-cash write-off of $15.8 million in deferred financing costs associated with the 2012 Credit Agreement and 2020 Senior Notes, $7.8 million of fees and underwriting discounts paid to lenders associated with the 2016 Credit Agreement and 2026 Senior Notes, and $23.6 million of a call premium paid with respect to our 2020 Senior Notes. The lender fees and call premium are presented as uses of cash in financing activities.
Cash used in investing activities increased $2.7 million in 2016 as compared to 2015. The increase in cash used in investing activities is due to a decrease in capital expenditures, which is primarily due to the phasing of planned capital projects.
Cash used in financing activities increased $94.4 million in 2016 as compared to 2015. In the year ended December 31, 2016, we repurchased 8.8 million shares of treasury stock for $535.0 million. Our other primary sources and uses of cash for financing activities relate to the repayment of our 2012 Credit Agreement using proceeds from our 2016 Credit Agreement, as well as the repayment of our 2020 Senior Notes using proceeds from our 2026 Senior Notes. In April 2016, we received proceeds of $524.5 million under our 2016 Credit Agreement and repaid $521.4 million outstanding under our 2012 Credit Agreement. In May 2016, we received gross proceeds of $600.0 million prior to the underwriting discount, from the issuance of our 2026 Senior Notes and, in June 2016, redeemed the 2020 Senior Notes for $375.0 million plus a call premium of $23.6 million. In connection with the 2016 Credit Agreement and 2026 Senior Notes, we paid $6.9 million in deferred financing costs and $7.8 million in fees and underwriting discounts to lenders. Additional borrowings to fund share repurchases and other financing and operating activities during the year ended December 31, 2016 were $1,108.8 million, offset by repayments of $971.3 million. Refer to Note 6, "Debt," in our Condensed Consolidated Financial Statements included in Part II, ITEM 8 for additional information.
Capital Expenditures
Capital expenditures totaled $62.4 million for the year ended December 31, 2016 and $65.9 million for the year ended December 31, 2015. We currently expect our 2017 capital expenditures to be approximately $60 to 70 million, which primarily relate to investments in our domestic manufacturing facilities and information technology.
Debt Service
On April 6, 2016, we entered into our 2016 Credit Agreement, which provides for (i) a $500.0 million revolving credit facility, (ii) a $500.0 million term loan facility and (iii) a $100.0 million delayed draw term loan facility. The Company used $500.0 million of the proceeds under the term loan facility and approximately $27.8 million of the proceeds under the revolving credit facility to repay in full the 2012 Credit Agreement and to pay certain transaction fees and expenses incurred in connection with the 2016 Credit Agreement. As of April 6, 2016, the 2016 Credit Agreement replaced the 2012 Credit Agreement.
37
In July 2016, the Company paid a total of approximately $115.0 million in cash to holders of the 8.0% Sealy Notes who properly converted their 8.0% Sealy Notes in advance of the maturity date, pursuant to the terms of the 8.0% Sealy Notes. In connection with the making of conversion payments with respect to, and the repayment of, the 8.0% Sealy Notes, on July 14, 2016, the Company also borrowed $100.0 million using the delayed draw term loan facility under the Company's 2016 Credit Agreement. The commitment to provide the delayed draw term loan facility terminated with its funding.
Our total debt increased to $1,901.0 million as of December 31, 2016 from $1,479.6 million as of December 31, 2015. As of December 31, 2016, we had a balance of $156.9 million under our revolving credit facility, and total availability under the revolver was $321.1 million after giving effect to letters of credit outstanding of $22.0 million. Refer to Note 6, “Debt,” in our Consolidated Financial Statements included in Part II, ITEM 8 for further discussion of our debt.
As of December 31, 2016, our ratio of consolidated funded debt less qualified cash to EBITDA, which is a non-GAAP financial measure, in accordance with the Company's 2016 Credit Agreement was 3.60 times, within the terms of the financial covenants for the maximum consolidated total net leverage ratio as set forth in the 2016 Credit Agreement, which limits this ratio to 5.00 times. As of December 31, 2016, we were in compliance with all of the financial covenants in our debt agreements.
Our debt agreements contain certain covenants that limit restricted payments, including share repurchases and dividends. The 2016 Credit Agreement, 2026 Senior Notes and 2023 Senior Notes contain similar limitations which, subject to other conditions, allow unlimited restricted payments at times when the ratio of consolidated funded debt less qualified cash to adjusted EBITDA remains below 3.5 times. In addition, both agreements permit limited restricted payments under certain conditions when the ratio of consolidated funded debt less qualified cash to adjusted EBITDA is above 3.5 times. The limit on restricted payments under the 2016 Credit Agreement, 2023 Senior Notes and 2026 Senior Notes is in part determined by a basket that grows at 50% of adjusted net income each quarter, reduced by restricted payments that are not otherwise permitted.
Our business continues to generate significant cash flows from operations. In the near term, we expect to use our cash flows from operations primarily for debt repayment. Our target ratio of consolidated funded debt less qualified cash to adjusted EBITDA is 3.5 times, but we expect that this ratio could typically range from 3.0 times to 4.0 times. Subject to market conditions, we also expect to continue repurchasing shares. On February 16, 2017, our Board of Directors increased our share repurchase authorization by $200 million. As of that date, we had approximately $227 million available under this amended share repurchase authorization.
For additional information, refer to "Non-GAAP Financial Information" below for the calculation of the ratio of consolidated funded debt less qualified cash to EBITDA in accordance with the Company's 2016 Credit Agreement. Both consolidated funded debt and EBITDA in accordance with the Company's 2016 Credit Agreement are terms that are not recognized under GAAP and do not purport to be alternatives to net income as a measure of operating performance or total debt.
Non-GAAP Financial Information
We provide information regarding adjusted net income, adjusted EPS, adjusted gross profit, adjusted gross margin, adjusted operating income (expense), adjusted operating margin, EBITDA, adjusted EBITDA, consolidated funded debt and consolidated funded debt less qualified cash, which are not recognized terms under GAAP and do not purport to be alternatives to net income and earnings per share as a measure of operating performance or total debt. We believe these non-GAAP measures provide investors with performance measures that better reflect our underlying operations and trends, including trends in changes in margin and operating expenses, providing a perspective not immediately apparent from net income and operating income. The adjustments we make to derive the non-GAAP measures include adjustments to exclude items that may cause short-term fluctuations in the nearest GAAP measure, but which we do not consider to be the fundamental attributes or primary drivers of its business, including restructuring costs associated with headcount reductions and store closures, stock compensation benefits representing changes in estimate to reduce accumulated performance based stock compensation amortization, costs associated with the completion of the 2016 Credit Agreement and 2026 Senior Notes offering in the second quarter of 2016, costs associated with our 2013 acquisition of Sealy Corporation and its subsidiaries ("Sealy Acquisition") and the exclusion of other costs associated with the 2015 Annual Meeting (including executive management transition and retention compensation), legal settlements, and other costs.
38
We believe that exclusion of these items assists in providing a more complete understanding of our underlying results from continuing operations and trends, and management uses these measures along with the corresponding GAAP financial measures to manage our business, to evaluate the Company's consolidated and segment performance compared to prior periods and the marketplace, to establish operational goals and to provide continuity to investors for comparability purposes. These non-GAAP measures should be considered supplemental in nature and should not be construed as more significant than comparable measures defined by GAAP. Limitations associated with the use of these non-GAAP measures include that these measures do not present all of the amounts associated with our results as determined in accordance with GAAP. Because not all companies use identical calculations, these presentations may not be comparable to other similarly titled measures of other companies. For more information about these non-GAAP measures and a reconciliation to the nearest GAAP measure, please refer to the reconciliations on the following pages.
Key Highlights
Year Ended December 31, | |||||||||||||
(in millions, except percentages and per common share amounts) | 2016 | 2015 | % Change | % Change Constant Currency (1) | |||||||||
Net sales | $ | 3,127.3 | $ | 3,151.2 | (0.8 | )% | 0.7 | % | |||||
Net income | 202.1 | 73.5 | 175.0 | % | 184.4 | % | |||||||
EPS | 3.38 | 1.17 | 188.9 | % | 199.1 | % | |||||||
Adjusted EPS (1) | 4.05 | 3.19 | 27.0 | % | 30.7 | % | |||||||
EBITDA (1) | 510.8 | 388.9 | 31.3 | % | 34.1 | % | |||||||
Adjusted EBITDA (1) | 521.6 | 455.8 | 14.4 | % | 16.8 | % | |||||||
(1) | Non-GAAP financial measure. Please refer to the reconciliations in the following tables. | |
Adjusted Net Income and Adjusted EPS
A reconciliation of net income to adjusted net income and a calculation of adjusted EPS is provided below. We believe that the use of these non-GAAP financial measures provides investors with additional useful information with respect to the impact of various adjustments as described in the footnotes below. The following table sets forth the reconciliation of our reported net income to the calculation of adjusted net income for the year ended December 31, 2016 and 2015, respectively.
Year Ended | |||||||
(in millions, except per share amounts) | December 31, 2016 | December 31, 2015 | |||||
GAAP net income | $ | 202.1 | $ | 73.5 | |||
Integration costs (1) | 2.0 | 28.7 | |||||
German legal settlement (2) | — | 17.6 | |||||
Executive management transition and retention compensation (3) | 3.0 | 16.2 | |||||
Restructuring costs (4) | 8.3 | 13.5 | |||||
Stock compensation benefit (5) | (3.8 | ) | — | ||||
Interest expense and financing costs (6) | 2.1 | 12.0 | |||||
Other income (7) | — | (9.5 | ) | ||||
2015 Annual Meeting costs (8) | — | 6.3 | |||||
Pension settlement (9) | — | 1.3 | |||||
Loss on extinguishment of debt (10) | 47.2 | — | |||||
Tax adjustments (11) | (18.5 | ) | 40.3 | ||||
Adjusted net income | $ | 242.4 | $ | 199.9 | |||
Adjusted earnings per share, diluted | $ | 4.05 | $ | 3.19 | |||
Diluted shares outstanding | 59.8 | 62.6 | |||||
39
(1) | Integration costs represents costs, including legal fees, professional fees, compensation costs and other charges related to the transition of manufacturing facilities, and other costs related to the continued alignment of the North America business segment related to the Sealy Acquisition. |
(2) | German legal settlement represents the previously announced €15.5 million ($17.6 million) settlement we reached in 2015 with the FCO to fully resolve the FCO's antitrust investigation, and related legal fees. |
(3) | Executive management transition and retention compensation represents certain costs associated with the transition of certain of the Company's executive officers following the 2015 Annual Meeting. |
(4) | Restructuring costs represent costs associated with headcount reduction and store closures. |
(5) | Stock compensation benefit represents the fourth quarter change in estimate to reduce accumulated performance based stock compensation amortization to actual cost based on financial results for the year ended December 31, 2016. |
(6) | Interest expense and financing costs in 2015 represents non-cash interest costs related to the accelerated amortization of deferred financing costs associated with the $493.8 million voluntary prepayment of our term loans, subsequent to our issuance of $450 million aggregate principal amount of 2023 Senior Notes. Interest expense in 2016 represents incremental interest incurred with respect to the 2026 Senior Notes sold in the second quarter of 2016 and 2020 Senior Notes, which were repaid with the proceeds of the new 2026 Senior Notes. |
(7) | Other income includes income from a partial settlement of a legal dispute. |
(8) | 2015 Annual Meeting costs represent additional costs related to our 2015 Annual Meeting and related issues. |
(9) | Pension settlement represents pension expense recorded in conjunction with a settlement offered to terminated, vested participants in a defined benefit pension plan. |
(10) | Loss on extinguishment of debt represents costs associated with the completion of the 2016 Credit Agreement and 2026 Senior Notes offering in the second quarter of 2016. |
(11) | Tax adjustments represent adjustments associated with the aforementioned items and other discrete income tax events. |
Adjusted Gross Profit and Gross Margin and Adjusted Operating Income (Expense) and Operating Margin
Reconciliations of GAAP gross profit and gross margin to adjusted gross profit and gross margin, respectively, and GAAP operating income (expense) and operating margin to adjusted operating income (expense) and operating margin, respectively, are provided below. We believe that the use of these non-GAAP financial measures provides investors with additional useful information with respect to the impact of various adjustments as described in the footnotes below. The following table sets forth the reconciliation of the Company's reported GAAP gross profit and operating income (expense) to the calculation of adjusted gross profit and operating income (expense) for the year ended December 31, 2016:
FULL YEAR 2016 | ||||||||||||||||||||||||
(in millions, except percentages) | Consolidated | Margin | North America (1) | Margin | International (2) | Margin | Corporate (3) | |||||||||||||||||
Net sales | $ | 3,127.3 | $ | 2,570.1 | $ | 557.2 | $ | — | ||||||||||||||||
Gross profit | $ | 1,309.4 | 41.9 | % | $ | 1,017.4 | 39.6 | % | $ | 292.0 | 52.4 | % | $ | — | ||||||||||
Adjustments | 2.1 | 1.0 | 1.1 | — | ||||||||||||||||||||
Adjusted gross profit | $ | 1,311.5 | 41.9 | % | $ | 1,018.4 | 39.6 | % | $ | 293.1 | 52.6 | % | $ | — | ||||||||||
Operating income (expense) | $ | 415.5 | 13.3 | % | $ | 411.8 | 16.0 | % | $ | 102.7 | 18.4 | % | $ | (99.0 | ) | |||||||||
Adjustments | 9.5 | 1.6 | 5.8 | 2.1 | ||||||||||||||||||||
Adjusted operating income (expense) | $ | 425.0 | 13.6 | % | $ | 413.4 | 16.1 | % | $ | 108.5 | 19.5 | % | $ | (96.9 | ) | |||||||||
(1) | Adjustments for the North America business segment represent integration costs, which include professional fees, compensation costs and other charges related to the transition of manufacturing facilities, and other costs to support the continued alignment of the North America business related to the Sealy Acquisition. In addition, restructuring costs were incurred for the early termination of certain leased facilities. |
(2) | Adjustments for the International business segment represent restructuring costs related to headcount reduction and store closures. |
(3) | Adjustments for Corporate represent executive management transition and retention costs, integration costs which include professional fees and other charges to align the business related to the Sealy Acquisition, and restructuring costs related to headcount reductions. In addition, we recognized a stock compensation benefit, which represents the reduction of performance based stock compensation amortization based on financial results for the year ended December 31, 2016. |
The following table sets forth the reconciliation of the Company's reported GAAP gross profit and operating income (expense) to the calculation of adjusted gross profit and operating income (expense) for the year ended December 31, 2015:
40
FULL YEAR 2015 | ||||||||||||||||||||||||
(in millions, except percentages) | Consolidated | Margin | North America (1) | Margin | International (2) | Margin | Corporate (3) | |||||||||||||||||
Net sales | $ | 3,151.2 | $ | 2,577.2 | $ | 574.0 | $ | — | ||||||||||||||||
Gross profit | $ | 1,248.9 | 39.6 | % | $ | 954.6 | 37.0 | % | $ | 294.3 | 51.3 | % | $ | — | ||||||||||
Adjustments | 15.4 | 12.6 | 2.8 | — | ||||||||||||||||||||
Adjusted gross profit | $ | 1,264.3 | 40.1 | % | $ | 967.2 | 37.5 | % | $ | 297.1 | 51.8 | % | $ | — | ||||||||||
Operating income (expense) | $ | 309.1 | 9.8 | % | $ | 335.6 | 13.0 | % | $ | 98.9 | 17.2 | % | $ | (125.4 | ) | |||||||||
Adjustments | 64.7 | 25.5 | 8.8 | 30.4 | ||||||||||||||||||||
Adjusted operating income (expense) | $ | 373.8 | 11.9 | % | $ | 361.1 | 14.0 | % | $ | 107.7 | 18.8 | % | $ | (95.0 | ) | |||||||||
(1) | Adjustments for the North America business segment represent integration costs, which include professional fees, compensation costs and other charges related to the transition of manufacturing facilities, and other costs to support the continued alignment of the North America business related to the Sealy Acquisition, certain restructuring costs, and pension settlement costs, as well as executive management transition and retention costs. |
(2) | Adjustments for the International business segment represent certain restructuring costs, as well as executive management transition and retention costs. |
(3) | Adjustments for Corporate represent executive management transition and retention costs, integration costs which include professional fees and other charges to align the business related to the Sealy Acquisition, and certain restructuring costs, as well as executive management transition and retention costs. |
EBITDA, Adjusted EBITDA and Consolidated funded debt less qualified cash
The following reconciliations are provided below:
• | Net income to EBITDA and adjusted EBITDA |
• | Total debt to consolidated funded debt less qualified cash |
• | Ratio of consolidated funded debt less qualified cash to adjusted EBITDA |
We believe that presenting these non-GAAP measures provides investors with useful information with respect to our operating performance and leverage and comparisons from period to period. The following table sets forth the reconciliation of net income to the calculation of EBITDA and adjusted EBITDA for the year ended December 31, 2016 and 2015.
41
Year Ended | ||||||||
(in millions) | December 31, 2016 | December 31, 2015 | ||||||
GAAP net income | $ | 202.1 | $ | 73.5 | ||||
Interest expense | 85.2 | 96.1 | ||||||
Loss on extinguishment of debt | 47.2 | — | ||||||
Income taxes | 86.8 | 125.4 | ||||||
Depreciation and amortization | 89.5 | 93.9 | ||||||
EBITDA | $ | 510.8 | $ | 388.9 | ||||
Adjustments: | ||||||||
Restructuring costs (1) | 7.8 | 11.9 | ||||||
Integration costs (2) | 2.0 | 28.6 | ||||||
Executive management transition and retention compensation (3) | 1.0 | 10.7 | ||||||
Pension settlement (4) | — | 1.3 | ||||||
Other income (5) | — | (9.5 | ) | |||||
German legal settlement (6) | — | 17.6 | ||||||
2015 Annual Meeting costs (7) | — | 6.3 | ||||||
Adjusted EBITDA | $ | 521.6 | $ | 455.8 | ||||
Consolidated funded debt less qualified cash | $ | 1,879.5 | $ | 1,358.3 | ||||
Ratio of consolidated funded debt less qualified cash to Adjusted EBITDA | 3.60 times | 2.98 times | ||||||
(1) | Restructuring costs represent costs associated with headcount reduction and store closures. |
(2) | Integration costs represents costs, including legal fees, professional fees, compensation costs and other charges related to the transition of manufacturing facilities, and other costs related to the continued alignment of the North America business segment related to the Sealy Acquisition. |
(3) | Executive management transition and retention compensation represents certain costs associated with the transition of certain of our executive officers following the 2015 Annual Meeting. |
(4) | Pension settlement represents pension expense recorded in conjunction with a settlement offered to terminated, vested participants in a defined benefit pension plan. |
(5) | Other income includes income from a partial settlement of a legal dispute. |
(6) | German legal settlement represents the previously announced €15.5 million ($17.6 million) settlement we reached in 2015 with the FCO to fully resolve the FCO's antitrust investigation, and related legal fees. |
(7) | 2015 Annual Meeting costs represent additional costs related to our 2015 Annual Meeting and related issues. |
Under the 2016 Credit Agreement, the definition of adjusted EBITDA contains certain restrictions that limit adjustments to GAAP net income when calculating adjusted EBITDA. For the year ended December 31, 2016 and 2015, adjustments to GAAP net income when calculating adjusted EBITDA did not exceed the allowable amount under the 2016 Credit Agreement.
The following table sets forth the reconciliation of our total debt in accordance with GAAP to the calculation of funded debt less qualified cash as of December 31, 2016 and 2015. "Consolidated funded debt" and "qualified cash" are terms used in our 2016 Credit Agreement for purposes of certain financial covenants.
42
(in millions) | December 31, 2016 | December 31, 2015 | |||||
Total debt, net | $ | 1,888.1 | $ | 1,454.8 | |||
Plus: Deferred financing costs (1) | 12.9 | 24.8 | |||||
Total debt | 1,901.0 | 1,479.6 | |||||
Plus: Letters of credit outstanding | 23.0 | 19.8 | |||||
Consolidated funded debt | $ | 1,924.0 | $ | 1,499.4 | |||
Less: | |||||||
Domestic qualified cash (2) | 12.7 | 121.8 | |||||
Foreign qualified cash (2) | 31.8 | 19.3 | |||||
Consolidated funded debt less qualified cash | $ | 1,879.5 | $ | 1,358.3 | |||
(1) | We present deferred financing costs as a direct reduction from the carrying amount of the related debt in the Consolidated Balance Sheets. For purposes of determining total debt for financial covenants, we added these costs back to total debt, net as calculated in the Consolidated Balance Sheets. |
(2) | Qualified cash as defined in the 2016 Credit Agreement and 2012 Credit Agreement equals 100.0% of unrestricted domestic cash plus 60.0% of unrestricted foreign cash. For purposes of calculating leverage ratios, qualified cash is capped at $150.0 million. |
Stockholders’ Equity
Share Repurchase Program
On February 1, 2016, our Board of Directors authorized a new share repurchase program of up to $200 million. During 2016, the Board of Directors increased the authorization under our share repurchase program to a total of $600.0 million. In 2016, we purchased 8.7 million shares of our common stock for a total cost of $533.0 million. As of December 31, 2016, we had approximately $67 million available under our existing share repurchase authorization. In February 2017, our Board of Directors increased this share repurchase authorization by $200 million, and at February 16, 2017 we had available approximately $227 million under this amended share repurchase authorization. Stock repurchases under this program may be made through open market transactions, negotiated purchases or otherwise, at times and in such amounts as management deems appropriate. These repurchases may be funded by operating cash flows and/or borrowings under our debt arrangements. The timing and actual number of shares repurchased will depend on a variety of factors including price, financing and regulatory requirements and other market conditions. The program is subject to certain limitations in certain of our debt agreements. The program does not require the purchase of any minimum number of shares and may be suspended, modified or discontinued at any time without prior notice. Repurchases may be made under a Rule 10b5-1 plan, which would permit shares to be repurchased when we might otherwise be precluded from doing so under federal securities laws.
Future Liquidity Sources and Uses
Our primary sources of liquidity are cash flows from operations and borrowings under our debt facilities. We expect that ongoing requirements for debt service and capital expenditures will be funded from these sources. As of December 31, 2016, we had $1,901.0 million in total debt outstanding, and our adjusted EBITDA, which is a non-GAAP financial measure, was $521.6 for the year ended December 31, 2016. Our debt service obligations could, under certain circumstances, have material consequences to our security holders. Principal uses of funds consist of payments of principal and interest on our debt facilities, share repurchases, capital expenditures and working capital needs. Total cash interest payments related to our borrowings are expected to be approximately $85.0 million in 2017. Interest expense in the periods presented also includes non-cash amortization of deferred financing costs and accretion on the 8.0% Sealy Notes that were retired in July 2016.
Our 2016 Credit Agreement provides for (i) a $500.0 million revolving credit facility, (ii) a $500.0 million term loan facility and (iii) a $100.0 million delayed draw term loan facility. In July 2016, we borrowed $100.0 million using the delayed draw term loan facility to repay the 8.0% Sealy Notes. At any time, we may also elect to request the establishment of one or more incremental term loan facilities and/or increase commitments under the revolving credit facility of up to $500.0 million. A portion of the revolving credit facility of up to $250.0 million is available in Canadian Dollars, Pounds Sterling, the Euro and any additional currencies determined by mutual agreement of the Company, the Agent and the lenders under the revolving credit facility. A portion of the revolving credit facility of up to $100.0 million is available for the issuance of letters of credit for the account of the Company and a portion of the revolving credit facility of up to $50.0 million is available for swing line loans to the Company. The Company expects to use the revolving credit facility from time to time to finance working capital needs and for general corporate purposes.
43
We have received income tax assessments from SKAT with respect to the tax years 2001 through 2008 relating to the royalty paid by a U.S. subsidiary of Tempur Sealy International to a Danish subsidiary. In July 2016, we put on deposit with SKAT an amount approximately equal to our estimate of the liability for Danish income tax and related interest, in order to mitigate additional interest and foreign exchange exposure related to this matter. For more information please refer to “Critical Accounting Policies and Estimates - Income Taxes” below and Note 12, “Income Taxes,” in our Consolidated Financial Statements included in Part II, ITEM 8 of this Report for further discussion of the matter.
Based upon the current level of operations, we believe that cash generated from operations and amounts available under our 2016 Credit Agreement will be adequate to meet our anticipated debt service requirements, share repurchases, capital expenditures, and working capital needs for the foreseeable future. There can be no assurance, however, that our business will generate sufficient cash flow from operations or that future borrowings will be available under our debt facilities or otherwise enable us to service our indebtedness or to make anticipated capital expenditures. In the near term, we expect to use our cash flows from operations for debt repayment. Our target ratio of consolidated funded debt less qualified cash to adjusted EBITDA is 3.5 times, but can typically range from 3.0 times to 4.0 times.
At December 31, 2016, total cash and cash equivalents were $65.7 million, of which $12.7 million was held in the U.S. and $52.9 million was held by subsidiaries outside of the U.S. The amount of cash and cash equivalents held by subsidiaries outside of the U.S. and not readily convertible into other major foreign currencies, or the U.S. Dollar, is not material to our overall liquidity or financial position.
Off-Balance Sheet Arrangements
We occupy premises and utilize equipment under operating leases that expire at various dates through 2043. In accordance with GAAP, the obligations under those leases are not recorded on our balance sheet. Many of these leases provide for payment of certain expenses and contain renewal and purchase options. During the year ended December 31, 2016, we recognized lease expense of $33.5 million.
Contractual Obligations
Our contractual obligations and other commercial commitments as of December 31, 2016 are summarized below:
(in millions) | Payment Due By Period | |||||||||||||||||||||||||||
Contractual Obligations | 2017 | 2018 | 2019 | 2020 | 2021 | After 2021 | Total Obligations | |||||||||||||||||||||
Debt (1) | $ | 30.0 | $ | 30.0 | $ | 37.5 | $ | 52.5 | $ | 591.9 | $ | 1,050.0 | $ | 1,791.9 | ||||||||||||||
Letters of credit | 23.0 | — | — | — | — | — | 23.0 | |||||||||||||||||||||
Interest payments (2) | 75.0 | 70.7 | 70.0 | 68.4 | 60.8 | 190.4 | 535.3 | |||||||||||||||||||||
Operating leases | 24.6 | 18.8 | 15.1 | 9.6 | 8.2 | 12.3 | 88.6 | |||||||||||||||||||||
Capital lease obligations and other | 40.3 | 4.9 | 5.4 | 6.0 | 6.7 | 45.8 | 109.1 | |||||||||||||||||||||
Pension obligations | 1.0 | 1.0 | 1.0 | 1.0 | 1.1 | 22.9 | 28.0 | |||||||||||||||||||||
Total (3) | $ | 193.9 | $ | 125.4 | $ | 129.0 | $ | 137.5 | $ | 668.7 | $ | 1,321.4 | $ | 2,575.9 | ||||||||||||||
(1) | Debt excludes capital lease obligations and other and deferred financing costs. |
(2) | Interest payments represent obligations under our debt outstanding as of December 31, 2016, applying December 31, 2016 interest rates and assuming scheduled payments are paid as contractually required through maturity. |
(3) | Uncertain tax positions are excluded from this table given the timing of payments cannot be reasonably estimated. |
Critical Accounting Policies and Estimates
Our management is responsible for our financial statements and has evaluated the accounting policies to be used in their preparation. Our management believes these policies are reasonable and appropriate. The following discussion identifies those accounting policies that we believe are critical in the preparation of our financial statements, the judgments and uncertainties affecting the application of those policies and the possibility that materially different amounts will be reported under different conditions or using different assumptions.
44
The preparation of financial statements in conformity with GAAP requires that management make estimates and assumptions that affect the reported amounts of assets and liabilities and disclosure of commitments and contingencies at the date of the financial statements and the reported amounts of revenues and expenses during the reporting period. Our actual results could differ from those estimates.
Revenue Recognition. See Note 1, "Summary of Significant Accounting Policies," in our Consolidated Financial Statements, included in Part II, ITEM 8 of this Report, for a complete discussion of our revenue recognition policies. Sales of product are recognized when persuasive evidence of an arrangement exists, title passes to customers and the risks and rewards of ownership are transferred, the sales price is fixed or determinable, and collectability is reasonably assured. We extend volume discounts to certain customers and reflect these amounts as a reduction of net sales.
We recognize revenue, net of estimated returns, when the risks and rewards of ownership are transferred to our customers. We estimate the liability for sales returns at the time of sale, based on our level of historical sales returns. We allow returns following a sale, depending on the channel and promotion. Our level of sales returns differs by channel, with our Direct channel typically experiencing the highest rate of returns.
We record an allowance for doubtful accounts receivable for amounts due from third parties that we do not expect to collect. We estimate the allowance based on historical write-off experience and current economic conditions and also consider factors such as customer credit, past transaction history with the customer and changes in customer payment terms when determining whether the collection of a receivable is reasonably assured. Historically, less than 1.0% of net sales ultimately prove to be uncollectible.
Our revenue recognition accounting methodology contains uncertainties because it requires management to make assumptions and to apply judgment to estimate the amount and timing of future sales returns and uncollectible accounts. Our estimate of the amount and timing of sales returns and uncollectible accounts is based primarily on historical transaction experience.
We have not made any material changes in the accounting methodology we use to measure the estimated liability for sales returns and exchanges or doubtful accounts during the past three fiscal years. We do not believe there is a reasonable likelihood that there will be a material change in the future estimates or assumptions we use to establish the liability for sales returns and exchanges and doubtful accounts. However, if actual results are not consistent with our estimates or assumptions, we may be exposed to losses or gains that could be material.
Cooperative Advertising, Rebate and Other Promotional Programs. See Note 1, "Summary of Significant Accounting Policies," in our Consolidated Financial Statements, included in Part II, ITEM 8 of this Report, for a complete discussion of our cooperative advertising, rebate and other promotional program policies. We enter into agreements with our customers to provide funds for advertising and promotion of our products. We also enter into volume and other rebate programs with our customers. When sales are made to these customers, we record liabilities pursuant to these agreements. We periodically assess these liabilities based on actual sales and claims to determine whether all of the cooperative advertising earned will be used by the customer or whether the customer will meet the requirements to receive rebate funds. We generally negotiate these agreements on a customer-by-customer basis. Some of these agreements extend over several periods. Estimates are required at any point in time with regard to the ultimate reimbursement to be claimed. Subsequent revisions to such estimates are recorded and charged to earnings in the period in which they are identified.
Our estimate of the liability for cooperative advertising, rebate, and promotional programs could be adversely affected if our net sales to customers differ materially from our expectations. We have not made any material changes in the accounting methodology we use to measure the estimated liability for cooperative advertising, rebate, and promotional programs during the past three fiscal years. We do not believe there is a reasonable likelihood that there will be a material change in the future estimates or assumptions we use to establish the liability for cooperative advertising, rebate, and promotional programs. However, if actual customer sales are not consistent with our estimates or assumptions, we may be exposed to losses or gains that could be material.
Warranties. See Note 1, "Summary of Significant Accounting Policies," in our Consolidated Financial Statements, included in Part II, ITEM 8 of this Report, for a complete discussion of our policies to account for product warranties. We provide warranties ranging from 5 to 25 years for mattresses and 3 years for pillows. Estimated future obligations related to these products are provided by charges to operations in the period in which the related revenue is recognized.
45
Our estimate of the liability for product warranties is based on our historical claims experience and extensive product testing that we perform from time to time. Because the majority of our products have not been in use by our customers for the full warranty period, we rely on the combination of historical experience and product testing for the development of our estimate for warranty claims.
Our estimate of the liability for product warranties could be adversely affected if our historical experience differs materially from the performance of the product in our product testing. We have not made any material changes in the accounting methodology we use to measure the estimated liability for product warranty claims during the past three fiscal years. We do not believe there is a reasonable likelihood that there will be a material change in the future estimates or assumptions we use to establish the liability for product warranty claims. However, if actual warranty claims are not consistent with our estimates or assumptions, we may be exposed to losses or gains that could be material.
Goodwill and Indefinite-Lived Intangible Assets. Goodwill and indefinite-lived intangible assets are evaluated for impairment annually as of October 1 and whenever events or circumstances make it more likely than not that impairment may have occurred.
We test goodwill for impairment by comparing the book values to the fair value at the reporting unit level. Historically, we identified three reporting units for purposes of evaluating goodwill impairment: Tempur Sealy U.S. and Tempur Sealy Canada reporting units within the North America segment and one reporting unit comprising the International segment. During the fourth quarter of 2016, we revised how our reporting units are managed and we determined our reporting units to be our North America and International segments. We tested goodwill for impairment for both the historical reporting units as well as the new reporting units, noting no impairment at October 1, 2016. We test individual indefinite-lived intangible assets by comparing the book values of each asset to the estimated fair value. If the fair value exceeds the carrying amount, then no impairment exists. If the carrying amount exceeds the fair value, further analysis is performed to measure the impairment loss.
The fair value of each reporting unit is determined by using an income approach, which uses a discounted cash flow approach and a market approach. The fair value of each indefinite-lived intangible asset is determined using an income approach. Significant management judgment is necessary to evaluate the impact of operating and macroeconomic changes on each reporting unit. The significant estimates and assumptions include projected sales growth, gross profit rates, selling, general and administrative rates, working capital requirements, capital expenditures and terminal growth rates, discount rates per reporting unit, and the selection of peer company multiples. We determine discount rates separately for each reporting unit using the weighted average cost of capital, which includes a calculation of cost of equity, which is developed using the capital asset pricing model and comparable company betas (a measure of systemic risk), and cost of debt. We also use comparable market earnings multiple data and our market capitalization to corroborate our reporting unit valuations.
Other than revising our reporting units in 2016, we have not made any material changes in the accounting methodology we use to assess impairment loss on goodwill and indefinite-lived intangible assets during the past three years.
The most recent annual impairment tests performed as of October 1, 2016, indicated that the fair values of each of our reporting units and indefinite-lived intangible assets were substantially in excess of their carrying values. Despite that excess, however, impairment charges could still be required if a divestiture decision were made or other significant economic event were made or occurred with respect to one of our reporting units. Subsequent to our October 1, 2016 annual impairment test, no indications of impairment were identified. Subsequent to December 31, 2016, we terminated our commercial relationship with Mattress Firm. The events giving rise to this termination occurred in January 2017. As a result, indicators of impairment may exist in our first quarter of 2017 and we will conduct the required impairment analysis during the first quarter of 2017. There can be no assurances that an impairment of intangible assets has not occurred in 2017.
Income Taxes. Accounting for income taxes requires recognition of deferred tax liabilities and assets for the expected future tax consequences of events that have been included in the financial statements or tax returns. Under this method, deferred tax assets and liabilities are determined based on the difference between the financial statement and tax bases of assets and liabilities. These deferred taxes are measured by applying the provisions of tax laws in effect at the balance sheet date.
46
We recognize deferred tax assets in our Consolidated Balance Sheets, and these deferred tax assets typically represent items deducted currently from operating income in the financial statements that will be deducted in future periods in tax returns. A valuation allowance is recorded against certain deferred tax assets to reduce the consolidated deferred tax asset to an amount that will, more likely than not, be realized in future periods. The valuation allowance is based, in part, on our estimate of future taxable income, the expected utilization of foreign and state tax loss carryforwards, and credits and the expiration dates of such tax loss carryforwards. Significant assumptions are used in developing the analysis of future taxable income for purposes of determining the valuation allowance for deferred tax assets which, in our opinion, are reasonable under the circumstances.
Our consolidated effective tax rate and related tax reserves are subject to uncertainties in the application of complex tax regulations from numerous tax jurisdictions around the world. We recognize liabilities for anticipated taxes in the U.S. and other tax jurisdictions based on our estimate of whether, and the extent to which, taxes are and could be due. This liability is estimated based on a prescribed recognition threshold and measurement attributes for the financial statement recognition and measurements of a tax position taken or expected to be taken in a tax return. The resolution of tax matters for an amount that is different than the amount reserved would be recognized in our effective tax rate during the period in which such resolution occurs.
Our effective income tax rate is also affected by changes in tax law, the tax jurisdiction of new stores or business ventures, the level of earnings and the results of tax audits. Our liability for unrecognized tax benefits contains uncertainties because management is required to make assumptions and to apply judgment to estimate the exposures associated with our various filing positions. Although we believe that the judgments and estimates discussed herein are reasonable, actual results could differ, and we may be exposed to losses or gains that could be material.
We have received income tax assessments from SKAT with respect to the tax years 2001 through 2008 relating to the royalty paid by a U.S. subsidiary of Tempur Sealy International to a Danish subsidiary (the "Danish Assessments"). In July 2016, we put on deposit with SKAT an amount approximately equal to our estimate of the liability for Danish income tax and related interest, in order to mitigate additional interest and foreign exchange exposure related to this matter. We believe the process to reach a final resolution of this matter could potentially extend over a number of years. If we are not successful in defending our position that we owe no additional taxes, we could be required to pay a significant amount to SKAT. In addition, we are pursuing a settlement with SKAT, which could also require us to pay a significant amount to SKAT in excess of any related reserve. Each of these outcomes could have a material adverse impact on our results of operations and cash flows. In addition, prior to any ultimate resolution of this issue before the Tribunal or the Danish courts, or a settlement of the matter with SKAT, based on a change in facts and circumstances, we may be required to further increase our uncertain tax liability associated with this matter, which could have a material impact on our reported earnings.
We maintain an uncertain tax liability associated with the Danish Assessments, as well as for unassessed years 2009 through 2016 (collectively the years 2001 through 2016 are referred to as the "Danish Tax Matter"). It is reasonably possible the amount of unrecognized tax benefits may change in the next twelve months. An estimate of the amount of such change cannot be made at this time. If we are not successful in defending our position before the Tribunal or in the Danish courts, or in negotiating a mutually acceptable settlement, we could be required to pay a significant amount to SKAT. Refer to Note 12, “Income Taxes,” in our Consolidated Financial Statements included in Part II, ITEM 8 of this Report for further information associated with this tax assessment.
To the extent we prevail in matters for which a liability has been established, or are required to pay amounts in excess of our estimated liability, our effective income tax rate in a given financial statement period could be materially affected. An unfavorable tax settlement generally would require use of our cash and may result in an increase in our effective income tax rate in the period of resolution. A favorable tax settlement would be recognized as a reduction in our effective income tax rate in the period of resolution.
Impact of Recently Issued Accounting Pronouncements
Refer to Note 2, "Recently Issued Accounting Pronouncements," in our Consolidated Financial Statements included in Part II, ITEM 8 of this Report for a full description of recent accounting pronouncements, including the expected dates of adoption and estimated effects on results of operations and financial condition, which is incorporated herein by reference.
47
ITEM 7A. QUANTITATIVE AND QUALITATIVE DISCLOSURES ABOUT MARKET RISK
Foreign Currency Exchange Rate Risk
We manage a portion of our exposure in foreign currency transactions through the use of foreign exchange forward contracts. Refer to Note 1(f), "Derivative Financial Instruments," to the accompanying Consolidated Financial Statements for a summary of our foreign exchange forward contracts as of December 31, 2016.
As a result of our global operations, our earnings are exposed to changes in foreign currency exchange rates. Many of our foreign businesses operate in functional currencies other than the U.S. dollar. As the U.S. dollar strengthens relative to the Euro or other foreign currencies where we have operations, there will be a negative impact on our operating results upon translation of those foreign operating results into the U.S. dollar. Foreign currency exchange rate changes negatively impacted our adjusted EBITDA, which is a non-GAAP financial measure, by approximately 2.0% in the year ended December 31, 2016. We do not hedge the translation of foreign currency operating results into the U.S. dollar.
We hedge a portion of our currency exchange exposure relating to foreign currency transactions with foreign exchange forward contracts. A sensitivity analysis indicates the potential loss in fair value on foreign exchange forward contracts outstanding at December 31, 2016, resulting from a hypothetical 10.0% adverse change in all foreign currency exchange rates against the U.S. dollar, is approximately $17.0 million. Such losses would be largely offset by gains from the revaluation or settlement of the underlying assets and liabilities that are being protected by the foreign exchange forward contracts.
Interest Rate Risk
On December 31, 2016, we had variable-rate debt of $741.9 million. Holding other variables constant, including levels of indebtedness, a one hundred basis point increase in interest rates on our variable-rate debt would cause an estimated reduction in income before income taxes of $7.4 million. In light of the continued favorable interest rate environment, we will evaluate opportunities to improve our debt structure and minimize our interest rate risk through the issuance of fixed rate debt. We do not have interest rate swap agreements in effect to hedge interest rate risk in our variable rate debt.
ITEM 8. FINANCIAL STATEMENTS AND SUPPLEMENTARY DATA
INDEX TO HISTORICAL FINANCIAL STATEMENTS | |
48
Report of Independent Registered Public Accounting Firm
The Board of Directors and Stockholders of Tempur Sealy International, Inc. and Subsidiaries
We have audited the accompanying consolidated balance sheets of Tempur Sealy International, Inc. and Subsidiaries as of December 31, 2016 and 2015, and the related consolidated statements of income, comprehensive income, stockholders' equity, and cash flows for each of the three years in the period ended December 31, 2016. Our audits also included the financial statement schedule listed in the Index at Item 15(a). These financial statements and schedule are the responsibility of the Company's management. Our responsibility is to express an opinion on these financial statements based on our audits.
We conducted our audits in accordance with the standards of the Public Company Accounting Oversight Board (United States). Those standards require that we plan and perform the audit to obtain reasonable assurance about whether the financial statements are free of material misstatement. An audit includes examining, on a test basis, evidence supporting the amounts and disclosures in the financial statements. An audit also includes assessing the accounting principles used and significant estimates made by management, as well as evaluating the overall financial statement presentation. We believe that our audits provide a reasonable basis for our opinion.
In our opinion, the financial statements referred to above present fairly, in all material respects, the consolidated financial position of Tempur Sealy International, Inc. and Subsidiaries at December 31, 2016 and 2015, and the consolidated results of their operations and their cash flows for each of the three years in the period ended December 31, 2016, in conformity with U.S. generally accepted accounting principles. Also, in our opinion, the related financial statement schedule, when considered in relation to the basic financial statements taken as a whole, presents fairly in all material respects the information set forth therein.
We also have audited, in accordance with the standards of the Public Company Accounting Oversight Board (United States), Tempur Sealy International, Inc. and Subsidiaries' internal control over financial reporting as of December 31, 2016, based on criteria established in Internal Control-Integrated Framework issued by the Committee of Sponsoring Organizations of the Treadway Commission (2013 Framework) and our report dated February 24, 2017, expressed an unqualified opinion thereon.
/s/ Ernst & Young LLP
Louisville, Kentucky
February 24, 2017
49
TEMPUR SEALY INTERNATIONAL, INC. AND SUBSIDIARIES
CONSOLIDATED STATEMENTS OF INCOME
(in millions, except per common share amounts)
Year Ended December 31, | |||||||||||
2016 | 2015 | 2014 | |||||||||
Net sales | $ | 3,127.3 | $ | 3,151.2 | $ | 2,989.8 | |||||
Cost of sales | 1,817.9 | 1,902.3 | 1,839.4 | ||||||||
Gross profit | 1,309.4 | 1,248.9 | 1,150.4 | ||||||||
Selling and marketing expenses | 648.5 | 648.0 | 619.9 | ||||||||
General, administrative and other expenses | 278.2 | 322.0 | 280.6 | ||||||||
Equity income in earnings of unconsolidated affiliates | (13.3 | ) | (11.9 | ) | (8.3 | ) | |||||
Royalty income, net of royalty expense | (19.5 | ) | (18.3 | ) | (18.1 | ) | |||||
Operating income | 415.5 | 309.1 | 276.3 | ||||||||
Other expense, net: | |||||||||||
Interest expense, net | 85.2 | 96.1 | 91.9 | ||||||||
Loss on extinguishment of debt | 47.2 | — | — | ||||||||
Loss on disposal, net | — | — | 23.2 | ||||||||
Other (income) expense, net | (0.2 | ) | 12.9 | (13.7 | ) | ||||||
Total other expense | 132.2 | 109.0 | 101.4 | ||||||||
Income before income taxes | 283.3 | 200.1 | 174.9 | ||||||||
Income tax provision | (86.8 | ) | (125.4 | ) | (64.9 | ) | |||||
Net income before non-controlling interests | 196.5 | 74.7 | 110.0 | ||||||||
Less: net (loss) income attributable to non-controlling interests | (5.6 | ) | 1.2 | 1.1 | |||||||
Net income attributable to Tempur Sealy International, Inc. | $ | 202.1 | $ | 73.5 | $ | 108.9 | |||||
Earnings per common share: | |||||||||||
Basic | $ | 3.43 | $ | 1.19 | $ | 1.79 | |||||
Diluted | $ | 3.38 | $ | 1.17 | $ | 1.75 | |||||
Weighted average common shares outstanding: | |||||||||||
Basic | 59.0 | 61.7 | 60.8 | ||||||||
Diluted | 59.8 | 62.6 | 62.1 | ||||||||
The accompanying Notes to the Consolidated Financial Statements are an integral part of these statements.
50
TEMPUR SEALY INTERNATIONAL, INC. AND SUBSIDIARIES
CONSOLIDATED STATEMENTS OF COMPREHENSIVE INCOME
(in millions)
Year Ended December 31, | |||||||||||
2016 | 2015 | 2014 | |||||||||
Net income before non-controlling interests | $ | 196.5 | $ | 74.7 | $ | 110.0 | |||||
Other comprehensive (loss) income, net of tax: | |||||||||||
Foreign currency translation adjustments, net of tax | (4.5 | ) | (61.4 | ) | (38.4 | ) | |||||
Net change in unrecognized gain on interest rate swap, net of tax | — | 0.7 | 0.7 | ||||||||
Net change in pension benefits, net of tax | (0.8 | ) | 1.0 | (5.6 | ) | ||||||
Unrealized (loss) income on cash flow hedging derivatives, net of tax | (6.0 | ) | 5.3 | 1.3 | |||||||
Other comprehensive loss, net of tax | (11.3 | ) | (54.4 | ) | (42.0 | ) | |||||
Comprehensive income | 185.2 | 20.3 | 68.0 | ||||||||
Less: Comprehensive (loss) income attributable to non-controlling interests | (5.6 | ) | 1.2 | 1.1 | |||||||
Comprehensive income attributable to Tempur Sealy International, Inc. | $ | 190.8 | $ | 19.1 | $ | 66.9 | |||||
The accompanying Notes to the Consolidated Financial Statements are an integral part of these statements.
51
TEMPUR SEALY INTERNATIONAL, INC. AND SUBSIDIARIES
CONSOLIDATED BALANCE SHEETS
(in millions)
December 31, 2016 | December 31, 2015 | ||||||
ASSETS | |||||||
Current Assets: | |||||||
Cash and cash equivalents | $ | 65.7 | $ | 153.9 | |||
Accounts receivable, net | 345.1 | 379.4 | |||||
Inventories | 196.8 | 199.2 | |||||
Prepaid expenses and other current assets | 63.9 | 76.6 | |||||
Total Current Assets | 671.5 | 809.1 | |||||
Property, plant and equipment, net | 422.2 | 361.7 | |||||
Goodwill | 722.5 | 709.4 | |||||
Other intangible assets, net | 678.7 | 695.4 | |||||
Deferred income taxes | 22.5 | 12.2 | |||||
Other non-current assets | 185.2 | 67.7 | |||||
Total Assets | $ | 2,702.6 | $ | 2,655.5 | |||
LIABILITIES AND STOCKHOLDERS’ EQUITY | |||||||
Current Liabilities: | |||||||
Accounts payable | $ | 219.3 | $ | 266.3 | |||
Accrued expenses and other current liabilities | 250.1 | 254.0 | |||||
Income taxes payable | 5.8 | 11.2 | |||||
Current portion of long-term debt | 70.3 | 181.5 | |||||
Total Current Liabilities | 545.5 | 713.0 | |||||
Long-term debt, net | 1,817.8 | 1,273.3 | |||||
Deferred income taxes | 174.6 | 195.4 | |||||
Other non-current liabilities | 169.3 | 171.2 | |||||
Total Liabilities | 2,707.2 | 2,352.9 | |||||
Redeemable non-controlling interest | 7.6 | 12.4 | |||||
Stockholders' (Deficit) Equity: | |||||||
Common stock, $0.01 par value, 300.0 million shares authorized; 99.2 million shares issued as of December 31, 2016 and 2015 | 1.0 | 1.0 | |||||
Additional paid in capital | 492.8 | 463.4 | |||||
Retained earnings | 1,312.4 | 1,110.3 | |||||
Accumulated other comprehensive loss | (121.4 | ) | (110.1 | ) | |||
Treasury stock at cost; 44.8 million and 36.8 million shares as of December 31, 2016 and 2015, respectively | (1,700.0 | ) | (1,174.4 | ) | |||
Total stockholders' (deficit) equity, net of non-controlling interests in subsidiaries | (15.2 | ) | 290.2 | ||||
Non-controlling interest in subsidiaries | 3.0 | — | |||||
Total Stockholders' (Deficit) Equity | (12.2 | ) | 290.2 | ||||
Total Liabilities, Redeemable Non-Controlling Interest and Stockholders' (Deficit) Equity | $ | 2,702.6 | $ | 2,655.5 | |||
The accompanying Notes to the Consolidated Financial Statements are an integral part of these statements.
52
TEMPUR SEALY INTERNATIONAL, INC. AND SUBSIDIARIES
CONSOLIDATED STATEMENTS OF STOCKHOLDERS’ (DEFICIT) EQUITY
(in millions)
Tempur Sealy International, Inc. Stockholders' Equity (Deficit) | |||||||||||||||||||||||||||||||||||||
Redeemable Non-controlling Interest | Common Stock | Treasury Stock | Accumulated Other Comprehensive (Loss) Income | Non-controlling Interest in Subsidiaries | Total Stockholders' Equity (Deficit) | ||||||||||||||||||||||||||||||||
Shares Issued | At Par | Shares Issued | At Cost | Additional Paid in Capital | Retained Earnings | ||||||||||||||||||||||||||||||||
Balance, December 31, 2013 | $ | 11.5 | 99.2 | $ | 1.0 | 38.6 | $ | (1,193.1 | ) | $ | 396.5 | $ | 927.9 | $ | (13.7 | ) | $ | — | $ | 118.6 | |||||||||||||||||
Net income | 108.9 | 108.9 | |||||||||||||||||||||||||||||||||||
Net income attributable to non-controlling interest | 1.1 | ||||||||||||||||||||||||||||||||||||
Adjustment to pension liability, net of tax of $(3.4) | (5.6 | ) | (5.6 | ) | |||||||||||||||||||||||||||||||||
Derivative instruments accounted for as hedges, net of tax of $(0.9) | 2.0 | 2.0 | |||||||||||||||||||||||||||||||||||
Foreign currency adjustments | (38.4 | ) | (38.4 | ) | |||||||||||||||||||||||||||||||||
Exercise of stock options | (0.2 | ) | 2.5 | 1.8 | 4.3 | ||||||||||||||||||||||||||||||||
Issuances of PRSUs, RSUs, and DSUs | (0.1 | ) | 1.5 | (1.5 | ) | — | |||||||||||||||||||||||||||||||
Tax adjustments related to stock compensation | 1.7 | 1.7 | |||||||||||||||||||||||||||||||||||
Treasury stock repurchased | (2.2 | ) | (2.2 | ) | |||||||||||||||||||||||||||||||||
Amortization of unearned stock-based compensation | 13.4 | 13.4 | |||||||||||||||||||||||||||||||||||
Balance, December 31, 2014 | $ | 12.6 | 99.2 | $ | 1.0 | 38.3 | $ | (1,191.3 | ) | $ | 411.9 | $ | 1,036.8 | $ | (55.7 | ) | $ | — | $ | 202.7 | |||||||||||||||||
Net income | 73.5 | 73.5 | |||||||||||||||||||||||||||||||||||
Net income attributable to non-controlling interest | 1.2 | ||||||||||||||||||||||||||||||||||||
Distributions paid to non-controlling interest | (1.4 | ) | |||||||||||||||||||||||||||||||||||
Adjustment to pension liability, net of tax of $0.5 | 1.0 | 1.0 | |||||||||||||||||||||||||||||||||||
Derivative instruments accounted for as hedges, net of tax of $(2.4) | 6.0 | 6.0 | |||||||||||||||||||||||||||||||||||
Foreign currency adjustments | (61.4 | ) | (61.4 | ) | |||||||||||||||||||||||||||||||||
Exercise of stock options | (1.3 | ) | 16.5 | 3.9 | 20.4 | ||||||||||||||||||||||||||||||||
Treasury stock issued to CEO | (0.1 | ) | 0.9 | 4.1 | 5.0 | ||||||||||||||||||||||||||||||||
Issuances of PRSUs, RSUs, and DSUs | (0.1 | ) | 0.8 | (0.8 | ) | — | |||||||||||||||||||||||||||||||
Tax adjustments related to stock compensation | 21.8 | 21.8 | |||||||||||||||||||||||||||||||||||
Treasury stock repurchased | (1.3 | ) | (1.3 | ) | |||||||||||||||||||||||||||||||||
Amortization of unearned stock-based compensation | 22.5 | 22.5 | |||||||||||||||||||||||||||||||||||
Balance, December 31, 2015 | $ | 12.4 | 99.2 | $ | 1.0 | 36.8 | $ | (1,174.4 | ) | $ | 463.4 | $ | 1,110.3 | $ | (110.1 | ) | $ | — | $ | 290.2 | |||||||||||||||||
Net income | 202.1 | 202.1 | |||||||||||||||||||||||||||||||||||
Net loss attributable to non-controlling interests | (4.8 | ) | (0.8 | ) | (0.8 | ) | |||||||||||||||||||||||||||||||
Acquisition of non-controlling interest in subsidiary | 3.8 | 3.8 | |||||||||||||||||||||||||||||||||||
Adjustment to pension liability, net of tax of $(0.5) | (0.8 | ) | (0.8 | ) | |||||||||||||||||||||||||||||||||
Derivative instruments accounted for as hedges, net of tax of $(2.2) | (6.0 | ) | (6.0 | ) | |||||||||||||||||||||||||||||||||
Foreign currency adjustments | (4.5 | ) | (4.5 | ) | |||||||||||||||||||||||||||||||||
Exercise of stock options | (0.6 | ) | 7.9 | 7.8 | 15.7 | ||||||||||||||||||||||||||||||||
Issuances of PRSUs, RSUs, and DSUs | (0.1 | ) | 1.5 | (1.6 | ) | (0.1 | ) | ||||||||||||||||||||||||||||||
Tax adjustments related to stock compensation | 7.0 | 7.0 | |||||||||||||||||||||||||||||||||||
Treasury stock repurchased | 8.7 | (533.0 | ) | (533.0 | ) | ||||||||||||||||||||||||||||||||
Treasury stock repurchased - PRSU/RSU/DSU releases | — | (2.0 | ) | (2.0 | ) | ||||||||||||||||||||||||||||||||
Amortization of unearned stock-based compensation | 16.2 | 16.2 | |||||||||||||||||||||||||||||||||||
Balance, December 31, 2016 | $ | 7.6 | 99.2 | $ | 1.0 | 44.8 | $ | (1,700.0 | ) | $ | 492.8 | $ | 1,312.4 | $ | (121.4 | ) | $ | 3.0 | $ | (12.2 | ) | ||||||||||||||||
53
The accompanying Notes to the Consolidated Financial Statements are an integral part of these statements.
54
TEMPUR SEALY INTERNATIONAL, INC. AND SUBSIDIARIES
CONSOLIDATED STATEMENTS OF CASH FLOWS
(in millions)
Year Ended December 31, | |||||||||||
2016 | 2015 | 2014 | |||||||||
CASH FLOWS FROM OPERATING ACTIVITIES: | |||||||||||
Net income before non-controlling interests | $ | 196.5 | $ | 74.7 | $ | 110.0 | |||||
Adjustments to reconcile net income to net cash provided by operating activities: | |||||||||||
Depreciation and amortization | 73.3 | 71.4 | 76.3 | ||||||||
Amortization of stock-based compensation | 16.2 | 22.5 | 13.4 | ||||||||
Amortization of deferred financing costs | 3.5 | 20.3 | 12.5 | ||||||||
Bad debt expense | 4.2 | 6.9 | 4.9 | ||||||||
Deferred income taxes | (31.1 | ) | (21.3 | ) | (27.2 | ) | |||||
Dividends received from unconsolidated affiliates | 10.8 | 9.1 | 2.0 | ||||||||
Equity income in earnings of unconsolidated affiliates | (13.3 | ) | (11.9 | ) | (8.3 | ) | |||||
Non-cash interest expense on 8.0% Sealy Notes | 4.0 | 6.3 | 5.1 | ||||||||
Loss on extinguishment of debt | 47.2 | — | — | ||||||||
Loss on sale of assets | 1.3 | 1.5 | 3.9 | ||||||||
Loss on disposal of business | — | — | 23.2 | ||||||||
Foreign currency adjustments and other | (0.5 | ) | 5.5 | 1.8 | |||||||
Changes in operating assets and liabilities, net of effect of business acquisitions: | |||||||||||
Accounts receivable | 17.3 | (35.3 | ) | (58.8 | ) | ||||||
Inventories | 1.5 | 10.7 | (34.0 | ) | |||||||
Prepaid expenses and other assets | (124.4 | ) | (58.7 | ) | (14.9 | ) | |||||
Accounts payable | (47.8 | ) | 46.1 | 47.8 | |||||||
Accrued expenses and other | 3.5 | 90.3 | 56.7 | ||||||||
Income taxes | 3.3 | (3.9 | ) | 10.8 | |||||||
Net cash provided by operating activities | 165.5 | 234.2 | 225.2 | ||||||||
CASH FLOWS FROM INVESTING ACTIVITIES: | |||||||||||
Acquisition of businesses, net of cash acquired | — | — | (8.5 | ) | |||||||
Proceeds from disposition of business | — | 7.2 | 43.5 | ||||||||
Purchases of property, plant and equipment | (62.4 | ) | (65.9 | ) | (47.5 | ) | |||||
Other | — | (1.0 | ) | 2.1 | |||||||
Net cash used in investing activities | (62.4 | ) | (59.7 | ) | (10.4 | ) | |||||
CASH FLOWS FROM FINANCING ACTIVITIES: | |||||||||||
Proceeds from borrowings under long-term debt obligations | 2,233.3 | 863.5 | 271.5 | ||||||||
Repayments of borrowings under long-term debt obligations | (1,867.7 | ) | (988.3 | ) | (510.9 | ) | |||||
Proceeds from exercise of stock options | 15.7 | 20.4 | 4.3 | ||||||||
Excess tax benefit from stock-based compensation | 7.0 | 21.8 | 1.7 | ||||||||
Treasury stock repurchased | (535.0 | ) | (1.3 | ) | (2.2 | ) | |||||
Payment of deferred financing costs | (6.9 | ) | (8.0 | ) | (3.1 | ) | |||||
Fees paid to lenders | (7.8 | ) | — | — | |||||||
Call premium on 2020 Senior Notes | (23.6 | ) | — | — | |||||||
Proceeds from purchase of treasury shares by CEO | — | 5.0 | — | ||||||||
Other | (0.1 | ) | (3.8 | ) | 0.6 | ||||||
Net cash used in financing activities | (185.1 | ) | (90.7 | ) | (238.1 | ) | |||||
NET EFFECT OF EXCHANGE RATE CHANGES ON CASH AND CASH EQUIVALENTS | (6.2 | ) | 7.6 | 4.8 | |||||||
(Decrease) increase in cash and cash equivalents | (88.2 | ) | 91.4 | (18.5 | ) | ||||||
CASH AND CASH EQUIVALENTS, beginning of period | 153.9 | 62.5 | 81.0 | ||||||||
CASH AND CASH EQUIVALENTS, end of period | $ | 65.7 | $ | 153.9 | $ | 62.5 | |||||
Supplemental cash flow information: | |||||||||||
Cash paid during the period for: | |||||||||||
Interest | $ | 76.8 | $ | 59.9 | $ | 73.5 | |||||
Income taxes, net of refunds | $ | 81.3 | $ | 94.9 | $ | 56.3 | |||||
The accompanying Notes to the Consolidated Financial Statements are an integral part of these statements.
55
TEMPUR SEALY INTERNATIONAL, INC. AND CONSOLIDATED SUBSIDIARIES
NOTES TO THE CONSOLIDATED FINANCIAL STATEMENTS (CONTINUED)
(1) Summary of Significant Accounting Policies
(a) Basis of Presentation and Description of Business. Tempur Sealy International, Inc., a Delaware corporation, together with its subsidiaries, is a U.S. based, multinational company. The term “Tempur Sealy International” refers to Tempur Sealy International, Inc. only, and the term “Company” refers to Tempur Sealy International, Inc. and its consolidated subsidiaries.
The Company develops, manufactures, markets and sells bedding products, which include mattresses, foundations and adjustable bases, and other products, which include pillows and other accessories. The Company also derives income from royalties by licensing Sealy® and Stearns & Foster® brands, technology and trademarks to other manufacturers. The Company sells its products through two sales channels: Retail and Other.
(b) Basis of Consolidation. The accompanying financial statements include the accounts of Tempur Sealy International and its controlled subsidiaries and the results of Comfort Revolution, LLC ("Comfort Revolution"). Intercompany balances and transactions have been eliminated.
Comfort Revolution is a 45.0% owned joint venture. Comfort Revolution constitutes a variable interest entity (“VIE”) for which the Company is considered to be the primary beneficiary due to the Company's disproportionate share of the economic risk associated with its equity contribution, debt financing and other factors that were considered in the related-party analysis surrounding the identification of the primary beneficiary. The Company is party to put and call arrangements with respect to the common securities that represent the 55.0% non-controlling interest in Comfort Revolution not owned by the Company. The operations of Comfort Revolution are not material to the Company’s Consolidated Financial Statements.
The Company also has ownership interests in a group of Asia-Pacific joint ventures to develop markets for Sealy® branded products in those regions. The equity method of accounting is used for these joint ventures, over which the Company has significant influence but does not have effective control, and consolidation is not otherwise required. The Company’s equity in the net income and losses of these investments is reported in equity income in earnings of unconsolidated affiliates in the accompanying Consolidated Statements of Income. The Company’s Asia-Pacific joint ventures are more fully described in Note 5, "Unconsolidated Affiliate Companies."
(c) Use of Estimates. The preparation of financial statements in conformity with U.S. Generally Accepted Accounting Principles (“GAAP”) requires management to make estimates and assumptions that affect the reported amounts of assets and liabilities and disclosure of contingent assets and liabilities at the date of the Consolidated Financial Statements and the reported amounts of revenue and expenses during the reporting period. Actual results could differ from those estimates. The Company’s results are affected by economic, political, legislative, regulatory and legal actions. Economic conditions, such as recessionary trends, inflation, interest and monetary exchange rates, government fiscal policies and changes in the prices of raw materials, can have a significant effect on operations.
(d) Fair Value Measurements. The Company applies fair value accounting for all financial assets and liabilities and non-financial assets and liabilities that are recognized or disclosed at fair value in the Consolidated Financial Statements on a recurring basis. The Company defines fair value as the price that would be received from selling an asset or paid to transfer a liability in an orderly transaction between market participants at the measurement date. When determining the fair value measurements for assets and liabilities, the Company considers the principal or most advantageous market in which the Company would transact and the market-based risk measurements or assumptions that market participants would use in pricing the asset or liability, such as inherent risk, transfer restrictions and credit risk.
The Company estimates fair value of its financial instruments utilizing an established three-level hierarchy. The hierarchy is based upon the transparency of inputs to the valuation of an asset or liability as of the measurement date as follows:
• | Level 1 – Valuation is based upon unadjusted quoted prices for identical assets or liabilities in active markets. |
• | Level 2 – Valuation is based upon quoted prices for similar assets and liabilities in active markets, or other inputs that are observable for the asset or liability, either directly or indirectly, for substantially the full term of the financial instruments. |
• | Level 3 – Valuation is based upon other unobservable inputs that are significant to the fair value measurements. |
56
TEMPUR SEALY INTERNATIONAL, INC. AND CONSOLIDATED SUBSIDIARIES
NOTES TO THE CONSOLIDATED FINANCIAL STATEMENTS (CONTINUED)
The classification of fair value measurements within the established three-level hierarchy is based upon the lowest level of input that is significant to the measurements. There were no transfers between levels for the years ended December 31, 2016 or 2015. The carrying value of cash and cash equivalents, accounts receivable and accounts payable approximate fair value because of the short-term maturity of those instruments.The fair value of the Company's financial instruments that are recorded on a recurring basis at fair value are not material.
(e) Foreign Currency. Assets and liabilities of non-U.S. subsidiaries, whose functional currency is the local currency, are translated into U.S. dollars at period-end exchange rates. Income and expense items are translated at the average rates of exchange prevailing during the period. The adjustments resulting from translating the financial statements of foreign subsidiaries are included in accumulated other comprehensive loss (“AOCL”), a component of stockholders’ (deficit) equity, and included in net earnings only upon sale or liquidation of the underlying foreign subsidiary or affiliated company. Foreign currency transaction gains and losses are recognized in net earnings based on differences between foreign exchange rates on the transaction date and on the settlement date. These amounts are not considered material to the Consolidated Financial Statements.
(f) Derivative Financial Instruments. Derivative financial instruments are used in the normal course of business to manage interest rate and foreign currency exchange risks. The financial instruments used by the Company are straight-forward, non-leveraged instruments. The counterparties to these financial instruments are financial institutions with strong credit ratings. The Company maintains control over the size of positions entered into with any one counterparty and regularly monitors the credit ratings of these institutions. For all transactions designated as hedges, the hedging relationships are formally documented at the inception and on an ongoing basis in offsetting changes in cash flows of the hedged transaction.
The Company records derivative financial instruments on the Consolidated Balance Sheets as either an asset or liability measured at its fair value. Changes in a derivative's fair value (i.e. unrealized gains or losses) are recorded each period in earnings or other comprehensive income ("OCI"), depending on whether the derivative is designated and is effective as a hedged transaction, and on the type of hedging relationship.
For derivative financial instruments that are designated as a hedge, unrealized gains and losses related to the effective portion are either recognized in income immediately to offset the realized gain or loss on the hedged item, or are deferred and reported as a component of AOCL in stockholders' (deficit) equity and subsequently recognized in net income when the hedged item affects net income. The change in fair value of the ineffective portion of a derivative financial instrument is recognized in net income immediately. For derivative instruments that are not designated as hedges, the gain or loss related to the change in fair value is also recorded to net income immediately.
The Company manages a portion of the risk associated with fluctuations in foreign currencies related to intercompany and third party inventory purchases denominated in foreign currencies through foreign exchange forward contracts designated as cash flow hedges. As of December 31, 2016, the Company had foreign exchange forward contracts designated as cash flow hedges to buy U.S. dollars and to sell Canadian dollars with a notional amount outstanding of $25.4 million. These foreign exchange forward contracts have maturities ranging from January 2017 to September 2017. The effectiveness of the cash flow hedge contracts, including time value, is assessed prospectively and retrospectively on a monthly basis using regression analysis, as well as other timing and probability criteria. The effective portion of the cash flow hedge contracts' gains or losses resulting from changes in the fair value of these hedges is initially reported, net of tax, as a component of AOCL until the underlying hedged item is reflected in the Company's accompanying Consolidated Statements of Income, at which time the effective amount in AOCL is reclassified to cost of sales in the accompanying Consolidated Statements of Income. The Company expects to reclassify a gain of approximately $0.6 million, net of tax, over the next 12 months based on December 31, 2016 exchange rates. The fair value of foreign exchange forward contract assets was $1.7 million and $12.5 million as of December 31, 2016 and 2015, respectively. There was no forward exchange liability as of December 31, 2016. The fair value of foreign exchange forward contract liabilities was $1.2 million as of December 31, 2015. The fair value of these financial instruments were based on Level 2 inputs.
The Company is also exposed to foreign currency risk related to intercompany debt and associated interest payments and certain intercompany accounts receivable and accounts payable. To manage the risk associated with fluctuations in foreign currencies related to these assets and liabilities, the Company enters into foreign exchange forward contracts. The Company considers these contracts to be economic hedges. Accordingly, changes in the fair value of these instruments affect earnings during the current period. These foreign exchange forward contracts protect against the reduction in value of forecasted foreign currency cash flows resulting from payments in foreign currencies.
57
TEMPUR SEALY INTERNATIONAL, INC. AND CONSOLIDATED SUBSIDIARIES
NOTES TO THE CONSOLIDATED FINANCIAL STATEMENTS (CONTINUED)
(g) Cash and Cash Equivalents. Cash and cash equivalents consist of all highly liquid investments with initial maturities of three months or less. The carrying value of cash and cash equivalents approximates fair value because of the short-term maturity of those instruments.
(h) Inventories. Inventories are stated at the lower of cost or market, determined by the first-in, first-out method and consist of the following:
December 31, | |||||||
(in millions) | 2016 | 2015 | |||||
Finished goods | $ | 130.1 | $ | 126.7 | |||
Work-in-process | 10.7 | 14.0 | |||||
Raw materials and supplies | 56.0 | 58.5 | |||||
$ | 196.8 | $ | 199.2 | ||||
(i) Property, Plant and Equipment. Property, plant and equipment are carried at cost at acquisition date and are depreciated using the straight-line method over their estimated useful lives as follows:
Estimated Useful Lives (in years) | |
Buildings | 25-30 |
Computer equipment and software | 3-5 |
Leasehold improvements | 4-7 |
Machinery and equipment | 3-7 |
Office furniture and fixtures | 5-7 |
The Company records depreciation and amortization in cost of sales for long-lived assets used in the manufacturing process, and within each line item of operating expenses for all other long-lived assets. Leasehold improvements are amortized over the shorter of the life of the lease or seven years. Assets under capital lease are included within property, plant and equipment and represent non-cash investing activities.
Property, plant and equipment, net consisted of the following:
December 31, | |||||||
(in millions) | 2016 | 2015 | |||||
Machinery and equipment | $ | 283.9 | $ | 257.0 | |||
Land and buildings | 302.6 | 243.7 | |||||
Computer equipment and software | 97.2 | 78.2 | |||||
Furniture and fixtures | 50.4 | 52.3 | |||||
Construction in progress | 52.9 | 57.4 | |||||
Total property, plant, and equipment | 787.0 | 688.6 | |||||
Accumulated depreciation | (364.8 | ) | (326.9 | ) | |||
Total property, plant and equipment, net | $ | 422.2 | $ | 361.7 | |||
Depreciation expense, which includes depreciation expense for capital lease assets, for the Company was $56.1 million, $53.5 million and $57.7 million for the years ended December 31, 2016, 2015 and 2014, respectively.
58
TEMPUR SEALY INTERNATIONAL, INC. AND CONSOLIDATED SUBSIDIARIES
NOTES TO THE CONSOLIDATED FINANCIAL STATEMENTS (CONTINUED)
(j) Long-Lived Assets. Long-lived assets are reviewed for impairment whenever events or changes in circumstances indicate that the carrying amount of an asset may not be recoverable. Recoverability of long-lived assets is assessed by a comparison of the carrying amount of the asset to the estimated future undiscounted net cash flows expected to be generated by the asset or group of assets. If estimated future undiscounted net cash flows are less than the carrying amount of the asset or group of assets, the asset is considered impaired and an expense is recorded in an amount required to reduce the carrying amount of the asset to its then fair value. Fair value generally is determined from estimated discounted future net cash flows (for assets held for use) or net realizable value (for assets held for sale). The Company did not identify any indicators of impairment for the years ended December 31, 2016, 2015, and 2014.
(k) Goodwill and Other Intangible Assets. Intangible assets with finite useful lives are amortized over their respective estimated useful lives to their estimated residual values and reviewed for impairment whenever events or changes in circumstances indicate impairment may have occurred. The Company performs an annual impairment test on goodwill and indefinite lived intangible assets on October 1 of each year and whenever events or circumstances make it more likely than not that impairment may have occurred. The Company reviewed goodwill for impairment based on its identified reporting units. During 2016, the Company revised how its reporting units are managed and determined its reporting units to be the North America and International segments. The Company tested goodwill for impairment for both the historical reporting units, as well as the new reporting units, noting no impairment at October 1, 2016. In conducting the impairment test for these reporting units, the fair value of each of the Company's reporting units is compared to its respective carrying amount including goodwill. If the fair value exceeds the carrying amount, then no impairment exists. If the carrying amount exceeds the fair value, further analysis is performed to assess impairment. The Company’s determination of fair value of the reporting units is based on a discounted cash flow approach, with an appropriate risk adjusted discount rate, and a market approach. Any identified impairment would result in an adjustment to the Company’s results of operations.
The Company also tests its indefinite-lived intangible assets, principally the Tempur and Sealy trade names. The Company tested both trade names for impairment using a “relief-from-royalty” method. Significant assumptions inherent in the methodologies are employed and include such estimates as royalty and discount rates.
The Company performed its annual impairment test of goodwill and indefinite-lived intangible assets in 2016, 2015 and 2014, none of which resulted in the recognition of impairment charges. The most recent annual impairment tests performed as of October 1, 2016, indicated that the fair values of each of the Company's reporting units and indefinite-lived intangible assets were substantially in excess of their carrying values. For further information on goodwill and other intangible assets, refer to Note 4, “Goodwill and Other Intangible Assets.”
(l) Accrued Sales Returns. The Company allows product returns through certain sales channels and on certain products. Estimated sales returns are provided at the time of sale based on historical sales channel return rates. Estimated future obligations related to these products are provided by a reduction of sales in the period in which the revenue is recognized. The Company considers the impact of recoverable salvage value on sales returns by segment in determining its estimate of future sales returns. Accrued sales returns are included in accrued expenses and other current liabilities in the accompanying Consolidated Balance Sheets.
The Company had the following activity for accrued sales returns from December 31, 2014 to December 31, 2016:
(in millions) | |||
Balance as of December 31, 2014 | $ | 32.3 | |
Amounts accrued | 123.0 | ||
Returns charged to accrual | (126.8 | ) | |
Balance as of December 31, 2015 | $ | 28.5 | |
Amounts accrued | 130.6 | ||
Returns charged to accrual | (128.8 | ) | |
Balance as of December 31, 2016 | $ | 30.3 | |
(m) Warranties. The Company provides warranties on certain products, which vary based by segment, product and brand. Estimates of warranty expenses are based primarily on historical claims experience and product testing. Estimated future obligations related to these products are charged to cost of sales in the period in which the related revenue is recognized. In estimating its warranty obligations, the Company considers the impact of recoverable salvage value on warranty costs by segment in determining its estimate of future warranty obligations.
59
TEMPUR SEALY INTERNATIONAL, INC. AND CONSOLIDATED SUBSIDIARIES
NOTES TO THE CONSOLIDATED FINANCIAL STATEMENTS (CONTINUED)
The Company provides warranties on mattresses with varying warranty terms. Tempur mattresses sold in the North America segment and all Sealy mattresses have warranty terms ranging from 10 to 25 years, generally non-prorated for the first 10 to 15 years and then prorated for the balance of the warranty term. Tempur mattresses sold in the International segment have warranty terms ranging from 5 to 15 years, non-prorated for the first 5 years and then prorated on a straight-line basis for the last 10 years of the warranty term. Tempur pillows have a warranty term of 3 years, non-prorated.
The Company had the following activity for warranties from December 31, 2014 to December 31, 2016:
(in millions) | |||
Balance as of December 31, 2014 | $ | 31.3 | |
Amounts accrued | 28.8 | ||
Warranties charged to accrual | (30.5 | ) | |
Balance as of December 31, 2015 | $ | 29.6 | |
Amounts accrued | 33.3 | ||
Warranties charged to accrual | (33.0 | ) | |
Balance as of December 31, 2016 | $ | 29.9 | |
As of December 31, 2016 and 2015, $14.3 million and $14.9 million of accrued warranty expense is included as a component of accrued expenses and other current liabilities and $15.6 million and $14.7 million of accrued warranty expense is included in other non-current liabilities on the Company’s accompanying Consolidated Balance Sheets, respectively.
(n) Income Taxes. Deferred tax assets and liabilities are recognized for the future tax consequences attributable to temporary differences between the financial statement carrying amounts of existing assets and liabilities and their respective tax bases. Deferred tax assets and liabilities are measured using enacted tax rates expected to apply to taxable income in the years in which those temporary differences are expected to be recovered or settled. Deferred tax assets are also recognized for the estimated future effects of tax loss carry forwards. The effect of changes in tax rates on deferred taxes is recognized in the period in which the enactment dates change. Valuation allowances are established when necessary on a jurisdictional basis to reduce deferred tax assets to the amounts expected to be realized. The Company accounts for uncertain foreign and domestic tax positions utilizing a proscribed recognition threshold and measurement attributes for the financial statement recognition and measurement of a tax position taken or expected to be taken in a tax return.
(o) Revenue Recognition. Sales of products are recognized when persuasive evidence of an arrangement exists, title passes to customers and the risks and rewards of ownership are transferred, the sales price is fixed or determinable, and collectability is reasonably assured. The Company extends volume discounts to certain customers, as well as promotional allowances, floor sample discounts, commissions paid to retail associates and slotting fees, and reflects these amounts as a reduction of sales at the time revenue is recognized based on historical experience. The Company also reports sales net of tax assessed by qualifying governmental authorities. The Company extends credit based on the creditworthiness of its customers. No collateral is required on sales made in the normal course of business.
The allowance for doubtful accounts is the Company’s best estimate of the amount of probable credit losses in the Company’s existing accounts receivable. The Company regularly reviews the adequacy of its allowance for doubtful accounts. The Company determines the allowance for doubtful accounts based on historical write-off experience and current economic conditions and also considers factors such as customer credit, past transaction history with the customer and changes in customer payment terms when determining whether the collection of a customer receivable is reasonably assured. Account balances are charged off against the allowance after all reasonable means of collection have been exhausted and the potential for recovery is considered remote. The allowance for doubtful accounts included in accounts receivable, net in the accompanying Consolidated Balance Sheets was $22.1 million and $23.3 million as of December 31, 2016 and 2015, respectively.
The Company reflects all amounts billed to customers for shipping and handling in net sales and the costs incurred from shipping and handling product in cost of sales. Amounts included in net sales for shipping and handling were $11.7 million, $11.1 million and $14.7 million for the years ended December 31, 2016, 2015 and 2014, respectively. Amounts included in cost of sales for shipping and handling were $155.1 million, $161.6 million and $169.2 million for the years ended December 31, 2016, 2015 and 2014, respectively.
60
TEMPUR SEALY INTERNATIONAL, INC. AND CONSOLIDATED SUBSIDIARIES
NOTES TO THE CONSOLIDATED FINANCIAL STATEMENTS (CONTINUED)
During the years ended December 31, 2015 and 2014, the Company recognized other income, net of expense, of $9.5 million and $15.6 million, respectively, from certain other non-recurring items, including the partial settlement of a legal dispute.
(p) Cost of Sales. Costs associated with net sales are recorded in cost of sales. Cost of sales includes the costs of receiving, producing, inspecting, warehousing, insuring, and shipping goods during the period, as well as depreciation and amortization of long-lived assets used in these processes. Cost of sales also includes shipping and handling costs associated with the delivery of goods to customers and costs associated with internal transfers between plant locations.
(q) Cooperative Advertising, Rebate and Other Promotional Programs. The Company enters into programs with customers to provide funds for advertising and promotions. The Company also enters into volume and other rebate programs with customers. When sales are made to these customers, the Company records liabilities pursuant to these programs. The Company periodically assesses these liabilities based on actual sales and claims to determine whether all of the cooperative advertising earned will be used by the customer or whether the customer will meet the requirements to receive rebate funds. The Company generally negotiates these programs on a customer-by-customer basis. Some of these agreements extend over several years. Significant estimates are required at any point in time with regard to the ultimate reimbursement to be claimed by the customers. Subsequent revisions to the estimates are recorded and charged to earnings in the period in which they are identified. Rebates and cooperative advertising are classified as a reduction of revenue and presented within net sales in the accompanying Consolidated Statements of Income. Certain cooperative advertising expenses are reported as components of selling and marketing expenses in the accompanying Consolidated Statements of Income because the Company receives an identifiable benefit and the fair value of the advertising benefit can be reasonably estimated.
(r) Advertising Costs. The Company expenses advertising costs as incurred except for production costs and advance payments, which are deferred and expensed when advertisements run for the first time. Direct response advance payments are deferred and amortized over the life of the program. Advertising costs are included in selling and marketing expenses in the accompanying Consolidated Statements of Income. Advertising costs charged to expense were $352.7 million, $360.5 million and $326.7 million for the years ended December 31, 2016, 2015 and 2014, respectively. Advertising costs include expenditures for shared advertising costs that the Company reimburses to customers under its integrated and cooperative advertising programs. Cooperative advertising costs paid to customers are recorded as a component of selling and marketing expenses within the Consolidated Statements of Income to the extent of the estimated fair value of the customer's underlying advertisement when the customer provides proof of advertising. The Company periodically assesses the liabilities recorded for cooperative advertising based on actual sales and claims to determine whether all of the cooperative advertising earned will be used by the customer. Advertising costs deferred and included in prepaid expenses and other current assets in the accompanying Consolidated Balance Sheets were $7.4 million and $13.7 million as of December 31, 2016 and 2015, respectively.
(s) Research and Development Expenses. Research and development expenses for new products are expensed as they are incurred and are included in general, administrative and other expenses in the accompanying Consolidated Statements of Income. Research and development costs charged to expense were $26.7 million, $28.7 million and $21.6 million for the years ended December 31, 2016, 2015 and 2014, respectively.
(t) Royalty Income and Expense. The Company recognizes royalty income based on sales of Sealy® and Stearns & Foster® branded products by various licensees. The Company also pays royalties to other entities for the use of their names on products produced by the Company. Royalty income, net of royalty expense, was $19.5 million, $18.3 million and $18.1 million for the years ended December 31, 2016, 2015 and 2014, respectively.
(u) Stock-based Compensation. The Company accounts for stock-based payment transactions in which the Company receives employee services in exchange for equity instruments of the Company. Stock-based compensation cost for restricted stock units (“RSUs”), performance restricted stock units (“PRSUs”) and deferred stock units (“DSUs”) is measured based on the closing fair market value of the Company’s common stock on the date of grant. Stock-based compensation cost for stock options is estimated at the grant date based on each option’s fair value as calculated by the Black-Scholes option-pricing model. The Company recognizes stock-based compensation cost as expense for awards other than its PRSUs ratably on a straight-line basis over the requisite service period. The Company recognizes stock-based compensation cost associated with its PRSUs over the requisite service period if it is probable that the performance conditions will be satisfied. The Company will recognize a benefit from stock-based compensation in additional paid in capital if an incremental tax benefit is realized pursuant to the Internal Revenue Code of 1986, as amended (the "Code"). Further information regarding stock-based compensation can be found in Note 10, “Stock-based Compensation.”
61
TEMPUR SEALY INTERNATIONAL, INC. AND CONSOLIDATED SUBSIDIARIES
NOTES TO THE CONSOLIDATED FINANCIAL STATEMENTS (CONTINUED)
(v) Treasury Stock. Subject to Delaware law, and the limitations in the Company's 2016 Credit Agreement (as defined in Note 6, "Debt") and the Company's other debt agreements, the Board of Directors may authorize share repurchases of the Company’s common stock (“Stock Repurchase Authorizations”). Purchases made pursuant to Stock Repurchase Authorizations may be carried out through open market transactions, negotiated purchases or otherwise, at times and in such amounts as the Company deems appropriate. Stock repurchased under Stock Repurchase Authorizations is held in treasury for general corporate purposes, including issuances under various employee stock-based award plans. On February 1, 2016, the Board of Directors authorized a new share repurchase authorization of up to $200.0 million of Tempur Sealy International's common stock. On both June 7, 2016 and July 27, 2016, the Board of Directors increased the authorization under the Company's share repurchase program by an additional $200.0 million. As of December 31, 2016, the Company had repurchased 8.7 million shares for approximately $533.0 million under the share repurchase authorization. As of December 31, 2016, the Company had approximately $67.0 million remaining under the existing share repurchase authorization.
In addition, the Company acquired 0.0 million shares upon the vesting of certain PRSUs, which were withheld to satisfy tax withholding obligations during the year ended December 31, 2016 and 2015, respectively. The shares withheld were valued at the closing price of the common stock on the New York Stock Exchange on the vesting date or last business day prior to, resulting in approximately $2.0 million and $1.3 million in treasury stock acquired during the year ended December 31, 2016 and 2015, respectively.
Treasury stock is accounted for under the cost method and reported as a reduction of stockholders’ (deficit) equity. Stock Repurchase Authorizations may be suspended, limited or terminated at any time without notice.
(w) Self-Insurance. The Company is self-insured up to $0.8 million per claim per year for certain losses related to medical claims with excess loss coverage. The Company also utilizes large deductible policies to insure claims related to general liability, product liability, automobile, and workers’ compensation. The Company’s recorded liability for workers’ compensation represents an estimate of the ultimate cost of claims incurred as of the Consolidated Balance Sheet date. The estimated workers' compensation liability is undiscounted and is established based upon analysis of historical and actuarial estimates, and is reviewed by the Company and third party actuaries on a quarterly basis to ensure that the liability is appropriate. As of December 31, 2016 and 2015, $8.6 million and $6.6 million, respectively, of the recorded undiscounted liability is included in accrued expenses and other current liabilities and $12.3 million and $11.5 million, respectively, is included in other non-current liabilities within the accompanying Consolidated Balance Sheets. During 2016, the Company entered into a retroactive insurance policy to limit exposure on historical worker's compensation claims. As of December 31, 2016, $14.2 million is included in other non-current assets within the accompanying Consolidated Balance Sheets, which represents the value of expected recoveries related to the underlying insured events. The related liabilities for the Company's worker's compensation exposure are included in other non-current liabilities within the accompanying Consolidated Balance Sheets.
(x) Pension Obligations. The Company has a noncontributory, defined benefit pension plan covering current and former hourly employees at two of its active Sealy plants and ten previously closed Sealy U.S. facilities. Sealy Canada, Ltd. (a 100.0% owned subsidiary of the Company) also sponsors a noncontributory, defined benefit pension plan covering hourly employees at one of its facilities. Both plans provide retirement and survivorship benefits based on the employees' credited years of service. The Company's funding policy provides for contributions of an amount between the minimum required and maximum amount that can be deducted for federal income tax purposes. The funded status is measured as the difference between the fair value of plan assets and the benefit obligation at December 31, the measurement date. The benefit obligation is the projected benefit obligation (“PBO”). The PBO represents the actuarial present value of benefits expected to be paid upon retirement based on estimated future compensation levels. The measurement of the PBO is based on the Company’s estimates and actuarial valuations. The fair value of plan assets represents the current market value of assets held by an irrevocable trust fund for the sole benefit of participants. These valuations reflect the terms of the plans and use participant-specific information such as compensation, age and years of service, as well as certain assumptions that require significant judgment, including estimates of discount rates, expected return on plan assets, rate of compensation increases, interest crediting rates and mortality rates.
(y) Restructuring Activities. For the years ended December 31, 2016 and 2015, the Company initiated certain restructuring activities, which included headcount reductions and store closures. As a result, the Company recognized $8.3 million and $13.5 million of restructuring expenses, respectively, consisting primarily of severance benefits and costs associated with store closures, which are recorded in cost of sales, selling and marketing expenses, and general, administrative and other expenses.
62
TEMPUR SEALY INTERNATIONAL, INC. AND CONSOLIDATED SUBSIDIARIES
NOTES TO THE CONSOLIDATED FINANCIAL STATEMENTS (CONTINUED)
(z) Subsequent Events. The Company announced that during the week of January 23, 2017, senior management of Mattress Firm Inc. (“Mattress Firm”) and representatives of its parent, Steinhoff International Holdings N.V. (“Steinhoff”), unexpectedly notified the Company of Mattress Firm's intent to terminate all of Mattress Firm's contracts with the Company in the U.S., if the Company did not agree to considerable changes to the agreements with Mattress Firm, including significant economic concessions. The Company engaged in discussions to facilitate a mutually agreeable supply arrangement with Mattress Firm. However, the parties were unable to reach an agreement, and the Company issued formal termination notices for all of the Company’s brands to Mattress Firm as of January 27, 2017. The Company expects to wind down its business with Mattress Firm over the first quarter of 2017. In the first quarter of 2017, due to the termination, there will be some restructuring charges and non-cash write offs related to certain prepaid items and intangible assets associated with the Mattress Firm relationship. In addition, indicators of impairment with respect to intangible assets may exist that will require further analysis in the first quarter of 2017.
(2) Recently Issued Accounting Pronouncements
In May 2014, the FASB issued Accounting Standards Update (“ASU”) No. 2014-09, Revenue From Contracts With Customers, that outlines a single comprehensive model for entities to use in accounting for revenue arising from contracts with customers and supersedes most current revenue recognition guidance, including industry-specific guidance. This ASU is based on the core principle that an entity should recognize revenue to depict the transfer of promised goods or services to customers in an amount that reflects the consideration to which the entity expects to be entitled in exchange for those goods or services. This ASU also requires disclosures sufficient to enable users to understand the nature, amount, timing, and uncertainty of revenue and cash flows arising from contracts with customers, including qualitative and quantitative disclosures about contracts with customers, significant judgments and changes in judgments, and assets recognized from the costs to obtain or fulfill a contract. The new standard is effective for the Company beginning January 1, 2018. The guidance permits two methods of adoption: retrospectively to each prior reporting period presented (full retrospective method), or retrospectively with the cumulative effect of initially applying the guidance recognized at the date of initial application (modified retrospective method). The Company currently anticipates adopting the standard using the modified retrospective method as of January 1, 2018. The Company is evaluating the effect of the adoption of this standard on our financial position and results of operations.
In May 2015, the FASB issued ASU No. 2015-07, Disclosures for Investments in Certain Entities That Calculate Net Asset Value per Share (or Its Equivalent), which removes the requirement to categorize within the fair value hierarchy all investments for which fair value is measured using the net asset value per share practical expedient. The Company adopted this ASU as of December 31, 2016. Accordingly, the fair value hierarchy of pension plan assets, which are measured using the net asset value per share practical expedient, is removed from Note 7, "Retirement Plans."
In February 2016, the FASB issued ASU No. 2016-02, Leases, that requires lessees to recognize most leases on the balance sheet and provides for expanded disclosures on key information about leasing arrangements. This ASU is effective for interim and the Company on January 1, 2019, however early adoption is permitted. In transition, entities are required to use a modified retrospective approach for the adoption of this ASU. The Company is currently evaluating this ASU to determine the impact it will have on the Company's Consolidated Financial Statements.
In March 2016, the FASB issued ASU No. 2016-09, Improvements to Employee Share-Based Payment Accounting, that simplifies several aspects of the accounting for share-based payment transactions, including the income tax consequences, classification of awards as either equity or liabilities, and the classification on the statement of cash flows. Entities should use a modified retrospective approach when adopting amendments related to the timing of excess tax benefit recognition, minimum statutory withholding requirements and forfeitures, and a retrospective approach when adopting amendments related to recognition of excess tax benefits and tax deficiencies in the income statement. In addition, entities have the option of using a prospective or a retrospective transition approach when adopting amendments related to the presentation of excess tax benefits on the statement of cash flows. This ASU is effective for the Company on January 1, 2017. The Company currently anticipates adopting the provisions of the presentation of excess tax benefits on the statement of cash flows using the retrospective transition approach. Further, the Company anticipates most of the simplification initiatives will not have a material impact on the Company’s Consolidated Financial Statements; however, upon adoption, the Company expects increased volatility in income tax expense. If adopted in the current period, the income tax benefit associated with excess tax benefits would have been $7.0 million for the year ended December 31, 2016.
63
TEMPUR SEALY INTERNATIONAL, INC. AND CONSOLIDATED SUBSIDIARIES
NOTES TO THE CONSOLIDATED FINANCIAL STATEMENTS (CONTINUED)
(3) Acquisitions and Divestitures
On October 3, 2016, the Company acquired 51% of the outstanding equity of an entity included in the North American segment. The remaining 49% of the outstanding equity represents a non-controlling interest, which is presented as a separate component of total equity. The acquisition was valued at $7.7 million, and the purchase price allocation primarily included inventory, goodwill and non-controlling interest. The results of operations were not material to the Company’s Consolidated Financial Statements.
Effective June 30, 2014, the Company completed the sale of its three U.S. innerspring component production facilities and equipment, along with associated working capital, to Leggett & Platt (“L&P”) for total consideration of approximately $47.8 million, which included $1.5 million of other non-cash consideration. The working capital adjustment period ended during the quarter ended September 30, 2014 and resulted in a cash payment to L&P of $2.8 million, which reduced the total consideration received to $45.0 million. The carrying amount of the net assets sold in this transaction was approximately $66.8 million, including an allocation of goodwill within the historical Sealy segment which was determined using the relative fair value method. As a result, a loss on disposal of business was recorded of $23.2 million for the year ended December 31, 2014, which included $1.4 million of transaction costs and the $2.8 million working capital adjustment discussed above.
(4) Goodwill and Other Intangible Assets
The following summarizes the Company's goodwill by reportable segment:
(in millions) | North America | International | Consolidated | ||||||||
Balance as of January 1, 2015 | $ | 574.5 | $ | 162.0 | $ | 736.5 | |||||
Foreign currency translation adjustments and other | (11.7 | ) | (15.4 | ) | (27.1 | ) | |||||
Balance as of December 31, 2015 | $ | 562.8 | $ | 146.6 | $ | 709.4 | |||||
Goodwill resulting from acquisition | 7.4 | — | 7.4 | ||||||||
Foreign currency translation adjustments and other | 1.8 | 3.9 | 5.7 | ||||||||
Balance as of December 31, 2016 | $ | 572.0 | $ | 150.5 | $ | 722.5 | |||||
The following table summarizes information relating to the Company’s other intangible assets, net:
($ in millions) | December 31, 2016 | December 31, 2015 | |||||||||||||||||||||||
Useful Lives (Years) | Gross Carrying Amount | Accumulated Amortization | Net Carrying Amount | Carrying Amount | Accumulated Amortization | Net Carrying Amount | |||||||||||||||||||
Unamortized indefinite life intangible assets: | |||||||||||||||||||||||||
Trade names | $ | 559.8 | $ | — | $ | 559.8 | $ | 558.1 | $ | — | $ | 558.1 | |||||||||||||
Amortized intangible assets: | |||||||||||||||||||||||||
Contractual distributor relationships | 15 | $ | 85.0 | $ | 21.5 | $ | 63.5 | $ | 84.8 | $ | 15.8 | $ | 69.0 | ||||||||||||
Technology and other | 4-10 | 90.4 | 46.5 | 43.9 | 90.8 | 39.2 | 51.6 | ||||||||||||||||||
Patents, other trademarks and other trade names | 5-20 | 27.1 | 19.2 | 7.9 | 27.2 | 16.9 | 10.3 | ||||||||||||||||||
Customer databases, relationships and reacquired rights | 2-5 | 24.2 | 20.6 | 3.6 | 24.5 | 18.1 | 6.4 | ||||||||||||||||||
Total | $ | 786.5 | $ | 107.8 | $ | 678.7 | $ | 785.4 | $ | 90.0 | $ | 695.4 | |||||||||||||
Amortization expense relating to intangible assets for the Company was $17.2 million, $17.9 million and $18.5 million for the years ended December 31, 2016, 2015 and 2014, respectively, and is recorded in general, administrative and other expenses in the Company's Consolidated Statements of Income. No impairments of goodwill or other intangible assets have adjusted the gross carrying amount of these assets in any period.
64
TEMPUR SEALY INTERNATIONAL, INC. AND CONSOLIDATED SUBSIDIARIES
NOTES TO THE CONSOLIDATED FINANCIAL STATEMENTS (CONTINUED)
Estimated annual amortization of intangible assets is expected to be as follows for the years ending December 31:
(in millions) | |||
2017 | $ | 18.7 | |
2018 | 16.1 | ||
2019 | 14.3 | ||
2020 | 14.6 | ||
2021 | 11.9 | ||
(5) Unconsolidated Affiliate Companies
The Company has ownership interests in a group of Asia-Pacific joint ventures to develop markets for Sealy® branded products in those regions. The Company’s ownership interest in these joint ventures is 50.0% and is accounted for under the equity method. The Company’s investment of $15.5 million and $13.6 million at December 31, 2016 and 2015, respectively, is recorded in other non-current assets in the accompanying Consolidated Balance Sheets. The Company’s share of earnings for the year ended December 31, 2016 and 2015 is recorded in equity income in earnings of unconsolidated affiliates in the accompanying Consolidated Statements of Income.
The tables below present summarized financial information for joint ventures as of and for the years ended December 31:
(in millions) | 2016 | 2015 | |||||
Current assets | $ | 58.6 | $ | 50.0 | |||
Non-current assets | 14.2 | 15.7 | |||||
Current liabilities | 41.8 | 37.3 | |||||
Equity | 31.0 | 28.4 | |||||
(in millions) | 2016 | 2015 | 2014 | ||||||||
Revenue | $ | 155.2 | $ | 131.6 | $ | 99.2 | |||||
Gross profit | 101.7 | 85.0 | 62.1 | ||||||||
Income from operations | 32.2 | 26.2 | 16.8 | ||||||||
Net income | 24.8 | 20.1 | 13.1 | ||||||||
(6) Debt
Debt for the Company consists of the following:
65
TEMPUR SEALY INTERNATIONAL, INC. AND CONSOLIDATED SUBSIDIARIES
NOTES TO THE CONSOLIDATED FINANCIAL STATEMENTS (CONTINUED)
(in millions) | December 31, 2016 | December 31, 2015 | |||||||||||
Debt: | Amount | Rate | Amount | Rate | Maturity Date | ||||||||
2016 Credit Agreement: | |||||||||||||
Term A Facility | $ | 585.0 | (1) | $ | — | N/A | April 6, 2021 | ||||||
Revolving Credit Facility | 156.9 | (1) | — | N/A | April 6, 2021 | ||||||||
2012 Credit Agreement: | |||||||||||||
Term A Facility | — | N/A | 409.4 | (2) | |||||||||
Term B Facility | — | N/A | 100.1 | (3) | |||||||||
2026 Senior Notes | 600.0 | 5.500% | — | N/A | June 15, 2026 | ||||||||
2023 Senior Notes | 450.0 | 5.625% | 450.0 | 5.625% | October 15, 2023 | ||||||||
2020 Senior Notes | — | N/A | 375.0 | 6.875% | |||||||||
8.0% Sealy Notes | — | 8.0% | 111.1 | 8.0% | |||||||||
Capital lease obligations (4) | 73.3 | 21.2 | Various | ||||||||||
Other | 35.8 | 12.8 | |||||||||||
Total debt | 1,901.0 | 1,479.6 | |||||||||||
Less: deferred financing costs | (12.9 | ) | (24.8 | ) | |||||||||
Total debt, net | 1,888.1 | 1,454.8 | |||||||||||
Less: current portion | (70.3 | ) | (181.5 | ) | |||||||||
Total long term debt, net | $ | 1,817.8 | $ | 1,273.3 | |||||||||
(1) | Interest at LIBOR plus applicable margin of 1.50% as of December 31, 2016. |
(2) | Interest at LIBOR plus applicable margin of 2.00% as of December 31, 2015. |
(3) | Interest at LIBOR, subject to a 0.75% floor plus applicable margin of 2.75% as of December 31, 2015. |
(4) | Capital lease obligations are a non-cash financing activity. |
2016 Credit Agreement
On April 6, 2016, the Company entered into a senior secured credit agreement ("2016 Credit Agreement") with a syndicate of banks. The 2016 Credit Agreement replaced the Company’s 2012 Senior Secured Credit Agreement ("2012 Credit Agreement"). The 2016 Credit Agreement provides for a $500.0 million revolving credit facility, a $500.0 million initial term loan facility and a $100.0 million delayed draw term loan facility. At any time, the Company may also elect to request the establishment of one or more incremental term loan facilities and/or increase commitments under the revolving credit facility in an aggregate amount of up to $500.0 million. A portion of the revolving credit facility of up to $250.0 million is available in Canadian Dollars, Pounds Sterling, the Euro and any additional currencies determined by mutual agreement of the Company, the Agent and the lenders under the revolving credit facility. A portion of the revolving credit facility of up to $100.0 million is available for the issuance of letters of credit for the account of the Company and a portion of the revolving credit facility of up to $50.0 million is available for swing line loans to the Company.
Borrowings under the 2016 Credit Agreement will generally bear interest, at the election of Tempur Sealy International and the other subsidiary borrowers, at either (i) LIBOR plus the applicable margin or (ii) Base Rate plus the applicable margin. The applicable margins are determined by a pricing grid based on the consolidated total net leverage ratio of the Company following the delivery of the Consolidated Financial Statements of the Company for the most recent quarter. The delayed draw term loan facility has identical pricing to the revolving credit facility and initial term loan facility. For the period ended December 31, 2016, the margin was either (i) LIBOR plus 1.50% per annum, or (ii) Base Rate plus 0.50%.
66
TEMPUR SEALY INTERNATIONAL, INC. AND CONSOLIDATED SUBSIDIARIES
NOTES TO THE CONSOLIDATED FINANCIAL STATEMENTS (CONTINUED)
Obligations under the 2016 Credit Agreement are guaranteed by the Company’s existing and future direct and indirect wholly-owned domestic subsidiaries, subject to certain exceptions. The 2016 Credit Agreement is secured by a security interest in substantially all of Tempur Sealy International’s and the other subsidiary borrowers’ domestic assets and the domestic assets of each subsidiary guarantor, whether owned as of the closing or thereafter acquired, including a pledge of 100.0% of the equity interests of each subsidiary guarantor that is a domestic entity (subject to certain limited exceptions) and 65.0% of the voting equity interests of any direct first tier foreign entity owned by a subsidiary guarantor. The 2016 Credit Agreement requires compliance with certain financial covenants providing for maintenance of a minimum consolidated interest coverage ratio, maintenance of a maximum consolidated total net leverage ratio, and maintenance of a maximum consolidated secured net leverage ratio. The consolidated total net leverage ratio is calculated using consolidated funded debt less qualified cash. Consolidated funded debt includes debt recorded on the Consolidated Balance Sheets as of the reporting date, plus letters of credit outstanding and other short-term debt. The Company is allowed to subtract from consolidated funded debt an amount equal to 100.0% of domestic qualified cash and 60.0% of foreign qualified cash, the aggregate of which cannot exceed $150.0 million at the end of the reporting period. As of December 31, 2016, domestic qualified cash was $12.7 million and foreign qualified cash was $31.8 million. As of December 31, 2016, the Company's consolidated total net leverage ratio was 3.60 times, within the covenant in our debt agreements which limits this ratio to 5.00 times for the year ended December 31, 2016.
The 2016 Credit Agreement contains certain customary negative covenants, which include limitations on liens, investments, indebtedness, dispositions, mergers and acquisitions, the making of restricted payments, changes in the nature of business, changes in fiscal year, transactions with affiliates, use of proceeds, prepayments of certain indebtedness, entry into burdensome agreements and changes to governing documents and other junior financing documents. The 2016 Credit Agreement also contains certain customary affirmative covenants and events of default, including upon a change of control.
The Company is in compliance with all applicable covenants in the 2016 Credit Agreement at December 31, 2016.
The Company is required to pay a commitment fee on the unused portion of the revolving credit facility. The commitment fee rate is determined by a pricing grid based on the consolidated total net leverage ratio of the Company. The commitment fee is payable quarterly in arrears following the delivery of Consolidated Financial Statements for the most recent quarter and on the date of termination or expiration of the commitments under the revolving credit facility. The Company and the other borrowers also pay customary letter of credit issuance and other fees under the 2016 Credit Agreement. For the period ended December 31, 2016, the Company's commitment fee rate was 0.25%.
The Company also borrowed $100.0 million using the delayed draw term loan facility under the Company's 2016 Credit Agreement in connection with the repayment of the 8.0% Sealy Notes. The commitment to provide the delayed draw term loan facility terminated with its funding.
As a result of the Company’s 2016 Credit Agreement, $3.6 million of deferred financing costs were capitalized in the second quarter of 2016 and will be amortized as interest expense over the respective debt instrument period, 5 years, using the effective interest method. In addition, the Company expensed $1.9 million of lender fees associated with this transaction in the second quarter of 2016, which is included in loss on extinguishment of debt in the Consolidated Statements of Income.
2012 Credit Agreement
The Company used the proceeds from the 2016 Credit Agreement to repay in full and terminate the 2012 Credit Agreement. The 2012 Credit Agreement initially provided for (i) a revolving credit facility of $350.0 million, (ii) a term A facility of $550.0 million and (iii) a term B facility of $870.0 million. In conjunction with the repayment of all outstanding borrowings on the 2012 Credit Agreement, the Company expensed approximately $11.0 million of deferred financing costs in the second quarter of 2016, which is included in loss on extinguishment of debt in the Consolidated Statements of Income.
67
TEMPUR SEALY INTERNATIONAL, INC. AND CONSOLIDATED SUBSIDIARIES
NOTES TO THE CONSOLIDATED FINANCIAL STATEMENTS (CONTINUED)
Senior Notes
2026 Senior Notes
On May 24, 2016, Tempur Sealy International issued $600.0 million aggregate principal amount of 5.500% 2026 Senior Notes in a private offering to qualified institutional buyers pursuant to Rule 144A of the Securities Act of 1933, as amended (the "Securities Act"), and to certain non-U.S. persons in accordance with Regulation S under the Securities Act. The 2026 Senior Notes were issued pursuant to an indenture, dated as of May 24, 2016 (the "2026 Indenture"), among Tempur Sealy International, certain subsidiaries of Tempur Sealy International as guarantors (the "Combined Guarantor Subsidiaries"), and The Bank of New York Mellon Trust Company, N.A., as trustee. The 2026 Senior Notes are general unsecured senior obligations of Tempur Sealy International and are guaranteed on a senior unsecured basis by the Combined Guarantor Subsidiaries. The 2026 Senior Notes mature on June 15, 2026, and interest is payable semi-annually in arrears on each June 15 and December 15, beginning on December 15, 2016. The gross proceeds from the 2026 Senior Notes were used to refinance the $375.0 million aggregate principal amount of 6.875% 2020 Senior Notes and to pay related fees and expenses, and the remaining funds were used for share repurchases and general corporate purposes.
Tempur Sealy International has the option to redeem all or a portion of the 2026 Senior Notes at any time on or after June 15, 2021. The initial redemption price is 102.750% of the principal amount, plus accrued and unpaid interest, if any. The redemption price will decline each year after 2021 until it becomes 100.0% of the principal amount beginning on June 15, 2024. In addition, Tempur Sealy International has the option at any time prior to June 15, 2021 to redeem some or all of the 2026 Senior Notes at 100.0% of the original principal amount plus a “make-whole” premium and accrued and unpaid interest, if any. Tempur Sealy International may also redeem up to 35.0% of the 2026 Senior Notes prior to June 15, 2019, under certain circumstances with the net cash proceeds from certain equity offerings, at 105.500% of the principal amount plus accrued and unpaid interest, if any. Tempur Sealy International may make such redemptions as described in the preceding sentence only if, after any such redemption, at least 65.0% of the original aggregate principal amount of the 2026 Senior Notes issued remains outstanding.
The 2026 Indenture restricts the ability of Tempur Sealy International and the ability of certain of its subsidiaries to, among other things: (i) incur, directly or indirectly, debt; (ii) make, directly or indirectly, certain investments and restricted payments; (iii) incur or suffer to exist, directly or indirectly, liens on its properties or assets; (iv) sell or otherwise dispose of assets, directly or indirectly; (v) create or otherwise cause or suffer to exist any consensual restriction on the right of certain of the subsidiaries of Tempur Sealy International to pay dividends or make any other distributions on or in respect of their capital stock; (vi) enter into transactions with affiliates; (vii) engage in sale-leaseback transactions; (viii) purchase or redeem capital stock or subordinated indebtedness; (ix) issue or sell stock of restricted subsidiaries; and (x) effect a consolidation or merger. These covenants are subject to a number of exceptions and qualifications.
In conjunction with the issuance and sale of the 2026 Senior Notes, Tempur Sealy International and the Combined Guarantor Subsidiaries agreed through a Registration Rights Agreement to exchange the 2026 Senior Notes for a new issue of substantially identical senior notes registered under the Securities Act (the "Exchange Offer"). On October 18, 2016, Tempur Sealy International completed the Exchange Offer, with 100% of the outstanding notes tendered and received for new 2026 Senior Notes registered under the Securities Act.
As a result of the issuance of the 2026 Senior Notes, $3.1 million of deferred financing costs were capitalized in the second quarter of 2016 and will be amortized as interest expense over the respective debt instrument period, 10 years, using the effective interest method. In addition, the Company expensed $5.9 million of lender fees associated with this transaction in the second quarter of 2016, which is included in loss on extinguishment of debt in the Consolidated Statements of Income.
68
TEMPUR SEALY INTERNATIONAL, INC. AND CONSOLIDATED SUBSIDIARIES
NOTES TO THE CONSOLIDATED FINANCIAL STATEMENTS (CONTINUED)
2023 Senior Notes
On September 24, 2015, Tempur Sealy International issued $450.0 million aggregate principal amount of 5.625% 2023 Senior Notes in a private offering to qualified institutional buyers pursuant to Rule 144A of the Securities Act, and to certain non-U.S. persons in accordance with Regulation S under the Securities Act. The 2023 Senior Notes were issued pursuant to an indenture, dated as of September 24, 2015 (the “2023 Indenture”), among Tempur Sealy International, the Combined Guarantor Subsidiaries (the Combined Guarantor Subsidiaries are the same under the 2026 Indenture, the 2023 Indenture and the 2020 Indenture), and The Bank of New York Mellon Trust Company, N.A., as trustee. The 2023 Senior Notes are general unsecured senior obligations of Tempur Sealy International and are guaranteed on a senior unsecured basis by the Combined Guarantor Subsidiaries. The 2023 Senior Notes mature on October 15, 2023, and interest is payable semi-annually in arrears on each April 15 and October 15, beginning on April 15, 2016. The gross proceeds from the 2023 Senior Notes were used to refinance a portion of the term loan debt under the 2012 Credit Agreement and to pay related fees and expenses.
Tempur Sealy International has the option to redeem all or a portion of the 2023 Senior Notes at any time on or after October 15, 2018. The initial redemption price is 104.219% of the principal amount, plus accrued and unpaid interest, if any. The redemption price will decline each year after 2018 until it becomes 100.0% of the principal amount beginning on October 15, 2021. In addition, Tempur Sealy International has the option at any time prior to October 15, 2018 to redeem some or all of the 2023 Senior Notes at 100.0% of the original principal amount plus a “make-whole” premium and accrued and unpaid interest, if any. Tempur Sealy International may also redeem up to 35.0% of the 2023 Senior Notes prior to October 15, 2018, under certain circumstances with the net cash proceeds from certain equity offerings, at 105.625% of the principal amount plus accrued and unpaid interest, if any. Tempur Sealy International may make such redemptions as described in the preceding sentence only if, after any such redemption, at least 65.0% of the original aggregate principal amount of the 2023 Senior Notes issued remains outstanding.
The 2023 Indenture restricts the ability of Tempur Sealy International and the ability of certain of its subsidiaries to, among other things: (i) incur, directly or indirectly, debt; (ii) make, directly or indirectly, certain investments and restricted payments; (iii) incur or suffer to exist, directly or indirectly, liens on its properties or assets; (iv) sell or otherwise dispose of, directly or indirectly, assets; (v) create or otherwise cause or suffer to exist any consensual restriction on the right of certain of the subsidiaries of Tempur Sealy International to pay dividends or make any other distributions on or in respect of their capital stock; (vi) enter into transactions with affiliates; (vii) engage in sale-leaseback transactions; (viii) purchase or redeem capital stock or subordinated indebtedness; (ix) issue or sell stock of restricted subsidiaries; and (x) effect a consolidation or merger. These covenants are subject to a number of exceptions and qualifications.
In conjunction with the issuance and sale of the 2023 Senior Notes, Tempur Sealy International and the Combined Guarantor Subsidiaries agreed through a Registration Rights Agreement to exchange the 2023 Senior Notes for a new issue of substantially identical senior notes registered under the Securities Act (the "2023 Exchange Offer"). On April 4, 2016, Tempur Sealy International completed the 2023 Exchange Offer, with 100% of the outstanding notes tendered and received for new 2023 Senior Notes registered under the Securities Act.
2020 Senior Notes
On December 19, 2012, Tempur Sealy International issued $375.0 million aggregate principal amount of 6.875% 2020 Senior Notes to qualified institutional buyers pursuant to Rule 144A of the Securities Act and to certain non-U.S. persons in accordance with Regulation S under the Securities Act. The 2020 Senior Notes were issued pursuant to an indenture, dated as of December 19, 2012 (the “2020 Indenture” and together with the 2026 Indenture and the 2023 Indenture, the "Indentures"), among the Company, the Combined Guarantor Subsidiaries (the Combined Guarantor Subsidiaries are the same under all the Indentures, and The Bank of New York Mellon Trust Company, N.A., as trustee. The 2020 Senior Notes are general unsecured senior obligations of Tempur Sealy International and are guaranteed on a senior unsecured basis by the Combined Guarantor Subsidiaries. The 2020 Senior Notes mature on December 15, 2020, and interest is payable semi-annually in arrears on each June 15 and December 15, beginning on June 15, 2013. The gross proceeds from the 2020 Senior Notes were funded into escrow and these funds were released from escrow on March 18, 2013 and used as part of the funding of the Sealy Acquisition. Following the completion of the Sealy Acquisition, Sealy and certain of its subsidiaries became Combined Guarantor Subsidiaries of the 2020 Senior Notes.
69
TEMPUR SEALY INTERNATIONAL, INC. AND CONSOLIDATED SUBSIDIARIES
NOTES TO THE CONSOLIDATED FINANCIAL STATEMENTS (CONTINUED)
The Company used the proceeds from the 2026 Senior Notes to refinance the 2020 Senior Notes and to pay related fees and expenses. The 2020 Senior Notes were redeemed at a price equal to the principal amount thereof and the applicable "make-whole" premium, $23.6 million, which is included in loss on extinguishment of debt in the Consolidated Statements of Income. In conjunction with the refinancing of the 2020 Senior Notes, the Company wrote off approximately $4.8 million of deferred financing costs in the second quarter of 2016, which is included in loss on extinguishment of debt in the Consolidated Statements of Income.
8.0% Sealy Notes
In July 2016, the Company retired the 8.0% Senior Secured Third Lien Convertible Notes issued by Sealy Corporation and Sealy Mattress Company (the “8.0% Sealy Notes”) by paying a total of $115.0 million in cash to holders of the 8.0% Sealy Notes who properly converted their 8.0% Sealy Notes in advance of the maturity date, pursuant to the terms of the 8.0% Sealy Notes.
In connection with the repayment of the 8.0% Sealy Notes, on July 14, 2016, the Company also borrowed $100.0 million using the delayed draw term loan facility under the Company's 2016 Credit Agreement. The commitment to provide the delayed draw term loan facility terminated with its funding.
Fair Value
Borrowings under the 2016 Credit Agreement and 2012 Credit Agreement are at variable interest rates and accordingly their carrying amounts approximate fair value. The fair value of the following material financial instruments were based on Level 2 inputs estimated using discounted cash flows and market-based expectations for interest rates, credit risk, and the contractual terms of debt instruments. The fair values of material financial instruments are as follows:
Fair Value | ||||||||
(in millions) | December 31, 2016 | December 31, 2015 | ||||||
2020 Senior Notes | $ | — | $ | 393.8 | ||||
2023 Senior Notes | 468.5 | 453.4 | ||||||
2026 Senior Notes | 606.8 | — | ||||||
8.0% Sealy Notes | — | 112.7 | ||||||
Capital Leases
The Company is party to capital leases as of December 31, 2016 and 2015. The approximate remaining life of the leases ranges from 2 to 15 years as of December 31, 2016, with several including an option to extend the contract term.
Deferred Financing Costs
The Company capitalizes costs associated with the issuance of debt and amortizes these costs as additional interest expense over the lives of the debt instruments using the effective interest method. These costs are recorded as deferred financing costs as a direct reduction from the carrying amount of the corresponding debt liability in the accompanying Consolidated Balance Sheets and the related amortization is included in interest expense, net in the accompanying Consolidated Statements of Income. Upon the prepayment of the related debt, the Company accelerates the recognition of an appropriate amount of the costs.
Future Obligations
As of December 31, 2016, the scheduled maturities of long-term debt outstanding, including capital lease obligations, for each of the next five years and thereafter are as follows:
70
TEMPUR SEALY INTERNATIONAL, INC. AND CONSOLIDATED SUBSIDIARIES
NOTES TO THE CONSOLIDATED FINANCIAL STATEMENTS (CONTINUED)
(in millions) | ||||
2017 | $ | 70.3 | ||
2018 | 34.9 | |||
2019 | 42.9 | |||
2020 | 58.5 | |||
2021 | 598.6 | |||
Thereafter | 1,095.8 | |||
Total | $ | 1,901.0 | ||
(7) Retirement Plans
401(k) Plan
The Company has a defined contribution plan ("the 401(k) Plan") whereby eligible employees may contribute up to 85.0% of their pay subject to certain limitations as defined by the 401(k) Plan. Employees are eligible to participate in the 401(k) Plan upon hire and are eligible to receive matching contributions upon six months of continuous employment with the Company. The 401(k) Plan provides a 100.0% match of the first 3.0% and 50.0% of the next 2.0% of eligible employee contributions. The match for union employees is based on the applicable collective bargaining arrangement. All matching contributions vest immediately. The Company incurred $6.7 million, $7.3 million and $5.0 million of expenses associated with the 401(k) Plan for the years ended December 31, 2016, 2015 and 2014, respectively, which are included in the Consolidated Statements of Income.
Company Defined Benefit Pension Plans
The Company has a noncontributory, defined benefit pension plan covering current and former hourly employees at only two of its active Sealy plants and ten previously closed Sealy U.S. facilities. Sealy Canada, Ltd. (a 100.0% owned subsidiary of the Company) also sponsors a noncontributory, defined benefit pension plan covering hourly employees at one of its facilities (collectively, referred to as the "Plans"). The Plans provide retirement and survivorship benefits based on the employees’ credited years of service. The Company’s funding policy provides for contributions of an amount between the minimum required and maximum amount that can be deducted for federal income tax purposes.
The Plans' assets consist of investments in various common/collective trusts with equity investment strategies diversified across multiple industry sectors and company market capitalization within specific geographical investment strategies, fixed income common/collective trusts, which invest primarily in investment-grade and high-yield corporate bonds and U.S. treasury securities, as well as money market mutual funds. The fixed income investments are diversified as to ratings, maturities, industries and other factors. The Plans' assets contain no significant concentrations of risk related to individual securities or industry sectors. The Plans have no direct investment in the Company's common stock.
The long-term rate of return for the Plans is based on the weighted average of the Plans’ investment allocation and the historical returns for those asset categories. Because future compensation levels are not a factor in these Plans’ benefit formulas, the accumulated benefit obligation is equal to the projected benefit obligation as reported below. The discount rate is based on the returns on long-term bonds in the private sector and incorporates a long-term inflation rate. Summarized information for the Plans follows:
71
TEMPUR SEALY INTERNATIONAL, INC. AND CONSOLIDATED SUBSIDIARIES
NOTES TO THE CONSOLIDATED FINANCIAL STATEMENTS (CONTINUED)
Expenses and Status
Components of net periodic pension cost which is included in general, administrative and other expenses included in the accompanying Consolidated Statements of Income for the years ended December 31 were as follows:
(in millions) | 2016 | 2015 | 2014 | ||||||||
Service cost | $ | 0.8 | $ | 0.8 | $ | 0.9 | |||||
Interest cost | 1.2 | 1.9 | 1.8 | ||||||||
Expected return on assets | (1.3 | ) | (2.2 | ) | (2.1 | ) | |||||
Curtailment loss | — | — | 0.1 | ||||||||
Amortization of net gain | — | — | (0.1 | ) | |||||||
Settlement loss | 0.2 | 1.3 | — | ||||||||
Net periodic pension cost | $ | 0.9 | $ | 1.8 | $ | 0.6 | |||||
The other changes in plan assets and benefit obligations recognized in other comprehensive loss (income) for the years ended December 31 were:
(in millions) | 2016 | 2015 | 2014 | ||||||||
Net loss | $ | 1.5 | $ | 0.2 | $ | 9.0 | |||||
Amortization of prior service cost | — | — | (0.2 | ) | |||||||
Amortization or settlement recognition of net (loss) gain | (0.2 | ) | (1.3 | ) | 0.1 | ||||||
New prior service cost | — | 0.1 | 0.1 | ||||||||
Total recognized in other comprehensive loss (income) | $ | 1.3 | $ | (1.0 | ) | $ | 9.0 | ||||
The following assumptions, calculated on a weighted-average basis, were used to determine net periodic pension cost for the Company’s Plans for the years ended December 31:
2016 | 2015 | 2014 | ||||||
Discount rate (a) | 4.27 | % | 4.12 | % | 4.01 | % | ||
Expected long-term return on plan assets | 6.71 | % | 7.05 | % | 7.00 | % | ||
(a) | The discount rates used in 2016 to determine the expenses for the U.S. retirement plan and Canadian retirement plan were 4.26% and 4.30%, respectively. The discount rates used in 2015 to determine the expenses for the U.S. retirement plan and Canadian retirement plan were 3.94% and 4.20%, respectively. The discount rates used in 2014 to determine the expenses for the U.S. retirement plan and Canadian retirement plan were 3.94% and 5.00%, respectively. |
72
TEMPUR SEALY INTERNATIONAL, INC. AND CONSOLIDATED SUBSIDIARIES
NOTES TO THE CONSOLIDATED FINANCIAL STATEMENTS (CONTINUED)
Obligations and Funded Status
The measurement date for the Company's Plans is December 31. The funded status of the Plans as of December 31 was as follows:
(in millions) | 2016 | 2015 | |||||
Change in Benefit Obligation: | |||||||
Projected benefit obligation at beginning of year | $ | 28.2 | $ | 47.1 | |||
Service cost | 0.8 | 0.8 | |||||
Interest cost | 1.2 | 1.9 | |||||
Plan amendments | — | 0.1 | |||||
Actuarial loss (gain) | 0.8 | (3.3 | ) | ||||
Settlements | (2.0 | ) | (16.9 | ) | |||
Benefits paid | (1.1 | ) | (0.8 | ) | |||
Expenses paid | — | (0.1 | ) | ||||
Foreign currency exchange rate changes | 0.1 | (0.6 | ) | ||||
Projected benefit obligation at end of year | $ | 28.0 | $ | 28.2 | |||
Change in Plan Assets: | |||||||
Fair value of plan assets at beginning of year | $ | 13.9 | $ | 32.5 | |||
Actual return (loss) on assets | 0.6 | (1.3 | ) | ||||
Employer contribution | 10.2 | 1.1 | |||||
Settlements | (2.0 | ) | (16.9 | ) | |||
Benefits paid | (1.1 | ) | (0.8 | ) | |||
Expenses paid | — | (0.1 | ) | ||||
Foreign currency exchange rate changes | 0.1 | (0.6 | ) | ||||
Fair value of plan assets at end of year | $ | 21.7 | $ | 13.9 | |||
Funded status | $ | (6.3 | ) | $ | (14.3 | ) | |
The Company’s defined benefit pension plan for U.S. Sealy employees is underfunded. As of December 31, 2016, the projected benefit obligation and fair value of plan assets were $24.9 million and $18.6 million, respectively. As of December 31, 2015, the projected benefit obligation and fair value of plan assets were $25.3 million and $10.8 million, respectively. As of December 31, 2016, the projected benefit obligation and fair value of plan assets for the Sealy Canada Ltd. pension plan were $3.1 million and $3.1 million, respectively. As of December 31, 2015, the projected benefit obligation and fair value of plan assets for the Sealy Canada Ltd. pension plan were $2.9 million and $3.1 million, respectively. During 2016, the Company contributed $10.0 million to the defined benefit pension plan for U.S. employees.
During the fourth quarter of 2015, the Company offered a lump-sum settlement to terminated, vested participants in the defined benefit pension plan for U.S. Sealy employees, which resulted in the recognition of a settlement loss of approximately $1.3 million and reduction of the benefit obligation and plan assets of approximately $17.0 million.
The accumulated benefit obligation for all pension plans was $28.0 million at December 31, 2016 and $28.2 million at December 31, 2015.
The following table represents amounts recorded in the Consolidated Balance Sheets:
December 31, | |||||||
(in millions) | 2016 | 2015 | |||||
Amounts recognized in the Consolidated Balance Sheets: | |||||||
Non-current benefit liability | $ | 6.3 | $ | 14.5 | |||
Non-current benefit asset | — | 0.2 | |||||
The following assumption, calculated on a weighted-average basis, was used to determine benefit obligations for the Company’s defined benefit pension plans as of December 31:
73
TEMPUR SEALY INTERNATIONAL, INC. AND CONSOLIDATED SUBSIDIARIES
NOTES TO THE CONSOLIDATED FINANCIAL STATEMENTS (CONTINUED)
2016 | 2015 | ||||
Discount rate (a) | 4.06 | % | 4.44 | % | |
(a) | The discount rates used in 2016 to determine the expenses for the U.S. retirement plan and Canadian retirement plan were 4.06% and 4.10%, respectively. The discount rates used in 2015 to determine the benefit obligations for the U.S. and Canadian defined benefit pension plans were 4.26% and 4.30%, respectively. |
No material amounts are expected to be reclassified from AOCL to be recognized as components of net income during 2017.
Plan Contributions and Expected Benefit Payments
During 2017, the Company expects to contribute $0.5 million to the Company's Plans from available cash and cash equivalents.
The following table presents estimated future benefit payments:
(in millions) | |||
Fiscal 2017 | $ | 1.0 | |
Fiscal 2018 | 1.0 | ||
Fiscal 2019 | 1.0 | ||
Fiscal 2020 | 1.0 | ||
Fiscal 2021 | 1.1 | ||
Fiscal 2022 ‑ Fiscal 2026 | 6.6 | ||
Pension Plan Asset Information
Investment Objective and Strategies
The Company's investment objectives are to minimize the volatility of the value of the Company's pension assets relative to pension liabilities and to ensure assets are sufficient to pay plan benefits. Target and actual asset allocations are as follows:
2016 Target | 2016 Actual | ||||
Common/collective trust consisting primarily of: | |||||
Equity securities | 60.00 | % | 74.51 | % | |
Debt securities | 40.00 | % | 22.53 | % | |
Other | — | % | 2.96 | % | |
Total plan assets | 100.00 | % | 100.00 | % | |
Investment strategies and policies reflect a balance of risk-reducing and return-seeking considerations. The objective of minimizing the volatility of assets relative to liabilities is addressed primarily through asset diversification. Assets are broadly diversified across many asset classes to achieve risk-adjusted returns that, in total, lower asset volatility relative to liabilities. The Company's policy to rebalance the Company's investment regularly ensures that actual allocations are in line with target allocations as appropriate.
Strategies to address the goal of ensuring sufficient assets to pay benefits include target allocations to a broad array of asset classes that provide return, diversification and liquidity.
The plan investment fiduciaries are responsible for setting asset allocation targets, and monitoring asset allocation and investment performance. The Company’s pension investment manager has discretion to manage assets to ensure compliance with the asset allocations approved by the plan fiduciaries.
74
TEMPUR SEALY INTERNATIONAL, INC. AND CONSOLIDATED SUBSIDIARIES
NOTES TO THE CONSOLIDATED FINANCIAL STATEMENTS (CONTINUED)
Significant Concentrations of Risk
Significant concentrations of risk in the Company's plan assets relate to equity, interest rate, and operating risk. In order to ensure assets are sufficient to pay benefits, a portion of plan assets is allocated to equity investments that are expected, over time, to earn higher returns with more volatility than fixed income investments which more closely match pension liabilities. Within the common/collective trusts, the plan assets contain no significant concentrations of risk related to individual securities or industry sectors.
In order to minimize asset volatility relative to the liabilities, a portion of the plan assets are allocated to fixed income investments that are exposed to interest rate risk. Rate increases will generally result in a decline in fixed income assets while reducing the present value of the liabilities. Conversely, rate decreases will increase fixed income assets, partially offsetting the related increase in the liabilities.
Operating risks primarily include the risks of inadequate diversification and insufficient oversight. To mitigate this risk, investments are diversified across and within asset classes in support of investment objectives. Policies and practices to address operating risks include ongoing oversight, plan and asset class investment guidelines, and periodic reviews against these guidelines to ensure adherence.
Expected Long-Term Return on Plan Assets
The expected long-term return assumption at December 31, 2016 was 7.00% for the defined benefit pension plan for U.S. Sealy Employees and 5.50% for the defined benefit pension plan for Sealy Canada, Ltd. The expected long-term return assumption is based on historical and projected rates of return for current and planned asset classes in the plan’s investment portfolio. The assumption considers various sources, primarily inputs from advisors for long-term capital market returns, inflation, bond yields, and other variables, adjusted for specific aspects of the Company's investment strategy by plan.
The investments in plan assets primarily consist of common collective trusts and money market funds. Investments in common collective trusts and money market funds are valued at the net asset value ("NAV") per share or unit multiplied by the number of shares or units held as of the measurement date. Common/collective trusts are valued at the NAV per share multiplied by the number of shares held as of the measurement date. The determination of NAV for the common/collective trusts includes market pricing of the underlying assets as well as broker quotes and other valuation techniques that represent fair value as determined by the respective administrator of the common/collective trust. Management has determined that the NAV is an appropriate estimate of the fair value of the common collective trusts at December 31, 2016 and 2015, based on the fact that the common/collective trusts are audited and accounted for at fair value by the administrators of the respective common/collective trusts. The methods described above may produce a fair value that may not be indicative of net realizable value or reflective of future fair value. Furthermore, while the Company believes its valuation methods are appropriate and consistent with other market participants, the use of different methodologies or assumptions to determine the fair value of certain financial instruments could result in a different estimate of fair value at the Consolidated Balance Sheet dates.
The fair value of the Company’s plan assets at December 31 by asset category was as follows:
(in millions) | 2016 | 2015 | |||||
Asset Category | |||||||
Common/collective trust | |||||||
U.S. equity | $ | 12.5 | $ | 7.7 | |||
International equity | 3.7 | 2.7 | |||||
Total equity based funds | 16.2 | 10.4 | |||||
Common/collective trust - fixed income | 4.9 | 2.9 | |||||
Money market funds | 0.6 | 0.6 | |||||
Total | $ | 21.7 | $ | 13.9 | |||
75
TEMPUR SEALY INTERNATIONAL, INC. AND CONSOLIDATED SUBSIDIARIES
NOTES TO THE CONSOLIDATED FINANCIAL STATEMENTS (CONTINUED)
Multi‑Employer Benefit Plans
Approximately 32.0% of the Company’s domestic employees are represented by various labor unions with separate collective bargaining agreements. Hourly employees working at nine of the Company’s domestic manufacturing facilities are covered by union sponsored retirement plans. Further, employees working at three of the Company’s domestic manufacturing facilities are covered by union sponsored health and welfare plans. These plans cover both active employees and retirees. Through the health and welfare plans, employees receive medical, dental, vision, prescription and disability coverage. The Company’s cost associated with these plans consists of periodic contributions to these plans based upon employee participation. The expense recognized by the Company for such contributions for the years ended December 31 was follows:
(in millions) | 2016 | 2015 | 2014 | ||||||||
Multi‑employer retirement plan expense | $ | 4.9 | $ | 5.0 | $ | 4.7 | |||||
Multi‑employer health and welfare plan expense | 2.8 | 2.4 | 2.2 | ||||||||
The risks of participating in multi‑employer pension plans are different from the risks of participating in single‑employer pension plans in the following respects: 1) contributions to the multi‑employer plan by one employer may be used to provide benefits to employees of other participating employers; 2) if a participating employer ceases its contributions to the plan, the unfunded obligations of the plan allocable to the withdrawing employer may be borne by the remaining participant employers; and 3) if the Company withdraws from the multi‑employer pension plans in which it participates, the Company may be required to pay those plans an amount based on its allocable share of the underfunded status of the plan.
The following table presents information regarding the multi‑employer pension plans that are significant to the Company for the years ended December 31, 2016 and 2015, respectively:
(in millions) | ||||||||||||||||||||
Pension Fund | EIN/Pension Plan Number | Date of Plan Year-End | Pension Protection Act Zone Status(1) 2016 | FIP/RP Status Pending/Implemented(2) | Contributions of the Company 2016 | Surcharge Imposed(3) | Expiration Date of Collective Bargaining Agreement | Year Contributions to Plan Exceeded More than 5 Percent of Total Contributions | ||||||||||||
United Furniture Workers Pension Fund A(4) | 13-5511877-001 | 2/29/16 | Red | Implemented | $ | 1.2 | Yes, 10.0% | 2017 | 2014, 2015, 2016 | |||||||||||
Pension Plan of the National Retirement Fund | 13-6130178-001 | 12/31/15 | Red | Implemented | $ | 1.3 | Yes, 10.0% | 2019 | N/A | |||||||||||
Central States, Southeast & Southwest Areas Pension Plan | 36-6044243-001 | 12/31/15 | Red | Implemented | $ | 0.3 | Yes, 10.0% | 2018 | N/A | |||||||||||
(in millions) | ||||||||||||||||||||
Pension Fund | EIN/Pension Plan Number | Date of Plan Year-End | Pension Protection Act Zone Status(1) 2015 | FIP/RP Status Pending/Implemented(2) | Contributions of the Company 2015 | Surcharge Imposed(3) | Expiration Date of Collective Bargaining Agreement | Year Contributions to Plan Exceeded More than 5 Percent of Total Contributions | ||||||||||||
United Furniture Workers Pension Fund A(4) | 13-5511877-001 | 2/28/15 | Red | Implemented | $ | 1.1 | Yes, 10.0% | 2016 | 2013, 2014, 2015 | |||||||||||
Pension Plan of the National Retirement Fund | 13-6130178-001 | 12/31/14 | Red | Implemented | $ | 1.2 | Yes, 10.0% | 2016 | N/A | |||||||||||
Central States, Southeast & Southwest Areas Pension Plan | 36-6044243-001 | 12/31/14 | Red | Implemented | $ | 0.5 | Yes, 10.0% | 2016 | N/A | |||||||||||
76
TEMPUR SEALY INTERNATIONAL, INC. AND CONSOLIDATED SUBSIDIARIES
NOTES TO THE CONSOLIDATED FINANCIAL STATEMENTS (CONTINUED)
(1) | The Pension Protection Act of 2006 ranks the funded status of multi-employer pension plans depending upon a plan’s current and projected funding. A plan is in the Red Zone (Critical) if it has a current funded percentage of less than 65.0%. A plan is in the Yellow Zone (Endangered) if it has a current funded percentage of less than 80.0%, or projects a credit balance deficit within seven years. A plan is in the Green Zone (Healthy) if it has a current funded percentage greater than 80.0% and does not have a projected credit balance deficit within seven years. The zone status is based on the plan’s year end rather than the Company’s. The zone status listed for each plan is based on information that the Company received from that plan and is certified by that plan’s actuary for the most recent year available. |
(2) | Funding Improvement Plan or Rehabilitation Plan as defined in the Employee Retirement Income Security Act of 1974 has been implemented or is pending. |
(3) | Indicates whether the Company paid a surcharge to the plan in the most current year due to funding shortfalls and the amount of the surcharge. |
(4) | The Company represented more than 5.0% of the total contributions for the most recent plan year available. For year ended December 31, 2014, the Company contributed $0.9 million to the plan. |
(8) Stockholders' (Deficit) Equity
(a) Common Stock. Tempur Sealy International has 300.0 million authorized shares of common stock with $0.01 per share par value and 0.01 million authorized shares of preferred stock with $0.01 per share par value. The holders of the common stock are entitled to one vote for each share held of record on all matters submitted to a vote of stockholders. Subject to preferences that may be applicable to any outstanding preferred stock, holders of common stock are entitled to receive ratably such dividends as may be declared from time to time by the Board of Directors out of funds legally available for that purpose. In the event of liquidation, dissolution or winding up, the holders of common stock are entitled to share ratably in all assets remaining after payment of liabilities, subject to prior distribution rights of preferred stock, if any, then outstanding.
The Board of Directors is authorized, subject to any limitations prescribed by law, without further vote or action by the stockholders, to issue from time to time shares of preferred stock in one or more series. Each such series of preferred stock will have such number of shares, designations, preferences, voting powers, qualifications, and special or relative rights or privileges as determined by the Board of Directors, which may include, among others, dividend rights, voting rights, redemption and sinking fund provisions, liquidation preferences, conversion rights and preemptive rights.
(b) Shareholder Rights Agreement. On February 8, 2017, the Board of Directors of the Company authorized and declared a dividend distribution of one right (a “Right”) for each outstanding share of common stock, par value $0.01 per share (the “Common Shares”), of the Company to stockholders of record at the close of business on February 20, 2017 (the “Record Date”). Each Right entitles the registered holder to purchase from the Company one one-thousandth of a share of Series A Junior Participating Preferred Stock, par value $0.01 per share (the “Preferred Shares”), of the Company at an exercise price of $90 per one one-thousandth of a Preferred Share, subject to adjustment (the “Exercise Price”). Generally, the Rights become exercisable in the event any person or group (including a group of persons that are acting in concert with each other) acquires 20% or more of the Common Shares without the approval of the Board of Directors, and until such time are inseparable from and trade with the Company's common stock. The Rights have a de minimus fair value. The Rights are issued pursuant to the Rights Agreement dated as of February 8, 2017, between the Company and American Stock Transfer & Trust Company, LLC, the Company's rights agent. These Rights expire February 7, 2018 or upon an earlier redemption or exchange as provided in the Rights Agreement.
(c) AOCL. AOCL consisted of the following:
Year Ended December 31, | |||||||||||
(in millions) | 2016 | 2015 | 2014 | ||||||||
Foreign Currency Translation | |||||||||||
Balance at beginning of period | $ | (115.4 | ) | $ | (54.0 | ) | $ | (15.6 | ) | ||
Other comprehensive loss: | |||||||||||
Foreign currency translation adjustments (1) | (4.5 | ) | (61.4 | ) | (38.4 | ) | |||||
Tax benefit (1) | — | — | — | ||||||||
Balance at end of period | $ | (119.9 | ) | $ | (115.4 | ) | $ | (54.0 | ) | ||
Interest Rate Swap Agreement | |||||||||||
Balance at beginning of period | $ | — | $ | (0.7 | ) | $ | (1.4 | ) | |||
Other comprehensive income: | |||||||||||
Net change from period revaluation: | — | 3.1 | 3.0 | ||||||||
Tax expense (2) | — | (1.2 | ) | (1.2 | ) | ||||||
Total other comprehensive income before reclassifications, net of tax | — | 1.9 | 1.8 | ||||||||
Net amount reclassified to earnings (3) | — | (1.9 | ) | (1.9 | ) | ||||||
Tax benefit (2) | — | 0.7 | 0.8 | ||||||||
Total amount reclassified from accumulated other comprehensive loss, net of tax | — | (1.2 | ) | (1.1 | ) | ||||||
Total other comprehensive income | — | 0.7 | 0.7 | ||||||||
Balance at end of period | $ | — | $ | — | $ | (0.7 | ) | ||||
Pension Benefits | |||||||||||
Balance at beginning of period | $ | (1.4 | ) | $ | (2.4 | ) | $ | 3.2 | |||
Other comprehensive (loss) income: | |||||||||||
Net change from period revaluation: | (1.5 | ) | 0.2 | (9.0 | ) | ||||||
Tax benefit (2) | 0.6 | — | 3.4 | ||||||||
Total other comprehensive (loss) income before reclassifications, net of tax | (0.9 | ) | 0.2 | (5.6 | ) | ||||||
Net amount reclassified to earnings | 0.2 | 1.3 | — | ||||||||
Tax expense (2) | (0.1 | ) | (0.5 | ) | — | ||||||
Total amount reclassified from accumulated other comprehensive loss, net of tax | 0.1 | 0.8 | — | ||||||||
Total other comprehensive (loss) income | (0.8 | ) | 1.0 | (5.6 | ) | ||||||
Balance at end of period | $ | (2.2 | ) | $ | (1.4 | ) | $ | (2.4 | ) | ||
Foreign Exchange Forward Contracts | |||||||||||
Balance at beginning of period | $ | 6.6 | $ | 1.3 | $ | — | |||||
Other comprehensive (loss) income: | |||||||||||
Net change from period revaluation: | (3.6 | ) | 14.6 | 3.4 | |||||||
Tax benefit (expense) (2) | 1.0 | (3.8 | ) | (0.9 | ) | ||||||
Total other comprehensive (loss) income before reclassifications, net of tax | (2.6 | ) | 10.8 | 2.5 | |||||||
Net amount reclassified to earnings (4) | (4.6 | ) | (7.4 | ) | (1.6 | ) | |||||
Tax benefit (2) | 1.2 | 1.9 | 0.4 | ||||||||
Total amount reclassified from accumulated other comprehensive loss, net of tax | (3.4 | ) | (5.5 | ) | (1.2 | ) | |||||
Total other comprehensive (loss) income | (6.0 | ) | 5.3 | 1.3 | |||||||
Balance at end of period | $ | 0.6 | $ | 6.6 | $ | 1.3 | |||||
(1) | In 2016, 2015 and 2014, there were no tax impacts related to foreign currency translation adjustments and no amounts were reclassified to earnings. |
(2) | These amounts were included in the income tax provision in the accompanying Consolidated Statements of Income. |
(3) | This amount was included in interest expense, net in the accompanying Consolidated Statements of Income. |
(4) | This amount was included in cost of sales, net in the accompanying Consolidated Statements of Income. |
77
TEMPUR SEALY INTERNATIONAL, INC. AND CONSOLIDATED SUBSIDIARIES
NOTES TO THE CONSOLIDATED FINANCIAL STATEMENTS (CONTINUED)
(9) Other Items
Accrued expenses and other current liabilities
Accrued expenses and other current liabilities consisted of the following:
December 31, | December 31, | ||||||
(in millions) | 2016 | 2015 | |||||
Wages and benefits | $ | 65.5 | $ | 72.4 | |||
Advertising | 48.6 | 48.4 | |||||
Sales returns | 30.3 | 28.5 | |||||
Rebates | 8.4 | 11.5 | |||||
Warranty | 14.3 | 14.9 | |||||
Other | 83.0 | 78.3 | |||||
$ | 250.1 | $ | 254.0 | ||||
(10) Stock-based Compensation
Tempur Sealy International has two stock-based compensation plans which provide for grants of non-qualified and incentive stock options, stock appreciation rights, restricted stock and stock unit awards, performance shares, stock grants and performance based awards to employees, non-employee directors, consultants and Company advisors. The plan under which equity awards may be granted in the future is the 2013 Equity Incentive Plan (the "2013 Plan"). It is the policy of the Company to issue stock out of treasury shares upon issuance or exercise of share-based awards. The Company believes that awards and purchases made under these plans better align the interests of the plan participants with those of its stockholders.
The 2013 Plan was adopted on May 22, 2013 by the Company’s Board of Directors, and provides for grants of stock options to purchase shares of common stock to employees and directors of the Company. The 2013 Plan may be administered by the Compensation Committee of the Board of Directors, by the Board of Directors directly, or, in certain cases, by an executive officer or officers of the Company designated by the Compensation Committee. The shares issued or to be issued under the 2013 Plan may be either authorized but unissued shares of the Company’s common stock or shares held by the Company in its treasury. Tempur Sealy International may issue a maximum of 5.1 million shares of common stock under the 2013 Plan, subject to certain adjustment provisions.
The Amended and Restated 2003 Equity Incentive Plan, as amended (the “2003 Plan”), was administered by the Compensation Committee of the Board of Directors, which, together with the Board of Directors, had the exclusive authority to administer the 2003 Plan, including the power to determine eligibility to receive awards, the types and number of shares of stock subject to the awards, the price and timing of awards and the acceleration or waiver of any vesting and performance of forfeiture restrictions, in each case subject to the terms of the 2003 Plan. Any of the Company’s employees, non-employee directors, consultants and Company advisors, as determined by the Compensation Committee, were eligible to be selected to participate in the 2003 Plan. Tempur Sealy International allowed a maximum of 11.5 million shares of its common stock under the 2003 Plan to be issued. In May 2013, the Company's Board of Directors adopted a resolution that prohibited further grants under the 2003 Plan.
In 2010, the Board of Directors approved the terms of a Long-Term Incentive Plan established under the 2003 Plan. In 2013, the Board of Directors approved the terms of another Long-Term Incentive Plan established under the 2013 Plan. Awards under both Long-Term Incentive Plans have typically consisted primarily of a mix of stock options, RSUs and PRSUs. Shares with respect to the PRSUs will be granted and vest following the end of the applicable performance period and achievement of applicable performance metrics as determined by the Compensation Committee of the Board of Directors.
The Company’s stock-based compensation expense for the year ended December 31, 2016 included PRSUs, stock options, RSUs and DSUs. A summary of the Company’s stock-based compensation expense is presented below:
78
TEMPUR SEALY INTERNATIONAL, INC. AND CONSOLIDATED SUBSIDIARIES
NOTES TO THE CONSOLIDATED FINANCIAL STATEMENTS (CONTINUED)
Year Ended December 31, | |||||||||||
(in millions) | 2016 | 2015 | 2014 | ||||||||
PRSU expense | $ | 3.9 | $ | 13.7 | $ | 3.5 | |||||
Stock option expense | 5.3 | 6.6 | 7.0 | ||||||||
RSU/DSU expense | 7.0 | 2.2 | 2.9 | ||||||||
Total stock-based compensation expense | $ | 16.2 | $ | 22.5 | $ | 13.4 | |||||
The Company granted PRSUs during the years ended December 31, 2016, 2015 and 2014. Actual payout under the PRSUs is dependent upon the achievement of certain financial goals. The Company recorded a benefit in the accompanying Consolidated Statements of Income of $3.8 million for the year ended December 31, 2016 after the change in estimate to reduce accumulated performance based stock compensation amortization to actual cost based on final financial results. The Company did not record any similar benefits in 2015. The Company recorded a benefit in the accompanying Consolidated Statements of Income of $3.0 million for the year ended December 31, 2014 after re-evaluation of the probability of meeting certain required performance goals and determining that the performance goals would not be met.
A summary of the Company’s PRSU activity and related information for the years ended December 31, 2016 and 2015 is presented below:
(shares in millions) | Shares | Weighted Average Grant Date Fair Value | ||||
Awards unvested at December 31, 2014 | 0.3 | $ | 53.45 | |||
Granted | 1.7 | 70.43 | ||||
Vested | — | — | ||||
Forfeited | (0.1 | ) | 56.74 | |||
Awards unvested at December 31, 2015 | 1.9 | 68.17 | ||||
Granted | 0.2 | 60.78 | ||||
Vested | (0.1 | ) | 51.87 | |||
Forfeited | (0.3 | ) | 70.43 | |||
Awards unvested at December 31, 2016 | 1.7 | $ | 68.02 | |||
In addition to the PRSUs noted above, during 2015, the Company granted the CEO and certain other senior executives and key employees a total of 1,390,000 PRSUs that vest if the Company achieves more than $650 million in Adjusted EBITDA for 2017 (the "2017 Aspirational Plan PRSUs"). All of the 2017 Aspirational Plan PRSUs will vest in full if the Company achieves Adjusted EBITDA in 2017 greater than $650 million. In addition, if this target is not met in 2017 but the Company achieves more than $650 million in Adjusted EBITDA for 2018, then one-third of the total 2017 Aspirational Plan PRSUs will vest, and the remaining 2017 Aspirational Plan PRSUs will be forfeited. If the Company does not achieve more than $650 million of Adjusted EBITDA in either 2017 or 2018, then all of the 2017 Aspirational Plan PRSUs will be forfeited. Adjusted EBITDA is defined as the Company’s “Consolidated EBITDA” as such term is defined in the Company’s 2012 Credit Agreement. Based on the price of the Company’s common stock on the respective grant dates during 2015, the total unrecognized compensation expense related to these awards if the performance target is met for 2017 is $101.1 million, which would be expensed over the service period if it becomes probable of achieving the performance condition.
During 2016, the Company granted certain other senior executives and key employees a total of 72,000 2017 Aspirational Plan PRSUs with substantially the same terms as the 2017 Aspirational Plan PRSUs as described above. Based on the price of the Company’s common stock on the respective grant dates during 2016, the total unrecognized compensation expense related to these awards if the performance target is met for 2017 is $4.4 million, which would be expensed over the service period if it becomes probable of achieving the performance condition.
The Company has not recorded any stock-based compensation expense related to the 2017 Aspirational Plan PRSUs during the year ended December 31, 2016, as it is not considered probable as of this date that the Company will achieve the specified performance target as of December 31, 2017 or December 31, 2018. The Company will continue to evaluate the probability of achieving the performance condition going forward and record the appropriate expense when the awards are probable of vesting.
79
TEMPUR SEALY INTERNATIONAL, INC. AND CONSOLIDATED SUBSIDIARIES
NOTES TO THE CONSOLIDATED FINANCIAL STATEMENTS (CONTINUED)
The following table shows the PRSUs granted under the 2013 Plan and related Long-Term Incentive Plan, the maximum number of shares to be awarded under the PRSUs granted during the year ended December 31, 2016 and the performance date and vesting schedule of the PRSUs granted.
(shares in millions) | ||||||||
Number of Shares Granted | Maximum Number of Shares to be Awarded | Performance Date | Vesting Schedule | |||||
0.1 | 0.1 | December 31, 2017 (1) | December 31, 2017 (1) | |||||
0.1 | 0.1 | December 31, 2016 | Five annual installments beginning on each applicable grant date | |||||
(1) | These shares will vest in full if the Company achieves the performance metric per the award agreement in 2017. In addition, if this target is not met in 2017 but the Company achieves the performance metric in 2018, then one-third of the PRSUs will vest, and the remaining PRSUs shall be forfeited. |
During the year ended December 31, 2016, shares granted in 2014 with an aggregate intrinsic value of $5.6 million were paid out from treasury stock following the satisfaction of certain financial metrics over the two year performance period that ended December 31, 2015. The PRSUs were paid out from treasury stock at 79.0% of the target award, out of a maximum potential payout of 200%. During the year ended December 31, 2015, no shares were issued from treasury stock to satisfy payouts under the PRSUs. During the year ended December 31, 2014, shares of common stock with an aggregate intrinsic value of $1.4 million were issued from treasury stock to satisfy payouts under the PRSUs following the satisfaction of certain financial metrics over the one year performance period that ended December 31, 2013. The shares were issued from treasury stock to satisfy payouts under the PRSUs at 100.0% of the target award, the maximum payout. The aggregate intrinsic value of PRSUs outstanding as of December 31, 2016 was $121.2 million.
A summary of the Company’s unvested shares relating to stock options as of December 31, 2016 and 2015, and changes during the years ended December 31, 2016 and 2015, are presented below:
(shares in millions) | Shares | Weighted Average Grant Date Fair Value | ||||
Options unvested at December 31, 2014 | 0.5 | $ | 46.23 | |||
Granted | 0.8 | 63.55 | ||||
Vested | (0.4 | ) | 44.25 | |||
Forfeited | (0.1 | ) | 57.12 | |||
Options unvested at December 31, 2015 | 0.8 | $ | 62.34 | |||
Granted | — | — | ||||
Vested | (0.3 | ) | 61.28 | |||
Forfeited | 0.0 | 58.37 | ||||
Options unvested at December 31, 2016 | 0.5 | $ | 63.09 | |||
The Company uses the Black-Scholes option-pricing model to calculate the fair value of stock options granted. During the year ended December 31, 2016, no stock options were granted. The assumptions used in the Black-Scholes option-pricing model for the years ended December 31, 2015 and 2014 are set forth in the following table. Expected volatility is based on the unbiased standard deviation of Tempur Sealy International’s common stock over the option term. The expected life of the options represents the period of time that the Company expects the options granted to be outstanding. The risk-free rate is based on the U.S. Treasury yield curve in effect at the time of the grant of the option for the expected term of the instrument. The dividend yield reflects an estimate of dividend payouts over the term of the award. The Company uses historical data to determine these assumptions.
Year Ended December 31, | |||||
2016 | 2015 | 2014 | |||
Expected volatility range of stock | N/A | 34.0% - 36.2% | 56.7% - 66.5% | ||
Expected life of option, range in years | N/A | 3 - 5 | 2 - 4 | ||
Risk-free interest range rate | N/A | 0.9% - 1.5% | 0.4% - 1.4% | ||
Expected dividend yield on stock | N/A | 0.0% - 0.0% | 0.6% - 0.7% | ||
80
TEMPUR SEALY INTERNATIONAL, INC. AND CONSOLIDATED SUBSIDIARIES
NOTES TO THE CONSOLIDATED FINANCIAL STATEMENTS (CONTINUED)
A summary of the Company’s stock option activity under the 2003 Plan and 2013 Plan for the years ended December 31, 2016 and 2015 is presented below:
(in millions, except per share amounts) | Shares | Weighted Average Exercise Price | Weighted Average Remaining Contractual Term (Years) | Aggregate Intrinsic Value | ||||||||
Options outstanding at December 31, 2014 | 2.8 | $ | 24.18 | |||||||||
Granted | 0.8 | 63.55 | ||||||||||
Released | (1.4 | ) | 14.70 | |||||||||
Forfeited | (0.1 | ) | 57.12 | |||||||||
Options outstanding at December 31, 2015 | 2.1 | $ | 42.75 | |||||||||
Granted | — | — | ||||||||||
Released | (0.6 | ) | 24.72 | |||||||||
Forfeited | 0.0 | 58.37 | ||||||||||
Options outstanding at December 31, 2016 | 1.5 | $ | 50.46 | 6.71 | $ | 19.1 | ||||||
Options exercisable at December 31, 2016 | 1.0 | $ | 44.45 | 5.98 | $ | 23.6 | ||||||
The aggregate intrinsic value of options exercised during the years ended December 31, 2016, 2015 and 2014 was $23.9 million, $71.8 million and $6.7 million, respectively.
A summary of the Company's RSU and DSU activity and related information for the years ended December 31, 2016 and 2015 is presented below:
(in millions, except per share amounts) | Shares | Weighted Average Release Price | Aggregate Intrinsic Value | |||||||
Awards outstanding at December 31, 2014 | 0.1 | $ | 50.41 | |||||||
Granted | 0.1 | 70.44 | ||||||||
Vested | (0.1 | ) | 58.73 | |||||||
Terminated | 0.0 | 49.63 | ||||||||
Awards outstanding at December 31, 2015 | 0.1 | $ | 66.41 | |||||||
Granted | 0.3 | 53.77 | ||||||||
Vested | 0.0 | 60.17 | ||||||||
Terminated | 0.0 | 53.45 | ||||||||
Awards outstanding at December 31, 2016 | 0.4 | $ | 59.37 | $ | 27.1 | |||||
At December 31, 2016, the Company had 0.4 million of unvested DSUs/RSUs. The aggregate intrinsic value of RSUs and DSUs vested during the year ended December 31, 2016 was $0.7 million.
81
TEMPUR SEALY INTERNATIONAL, INC. AND CONSOLIDATED SUBSIDIARIES
NOTES TO THE CONSOLIDATED FINANCIAL STATEMENTS (CONTINUED)
Excluding the estimated compensation expense related to the 2017 Aspirational Plan PRSUs discussed above, a summary of total unrecognized stock-based compensation expense based on current performance estimates related to stock options, DSUs, RSUs and PRSUs for the year ended December 31, 2016 is presented below:
(in millions, except years) | December 31, 2016 | Weighted Average Remaining Vesting Period (Years) | |||
Unrecognized stock option expense | 5.3 | 1.51 | |||
Unrecognized DSU/RSU expense | 11.9 | 2.97 | |||
Unrecognized PRSU expense | 14.2 | 2.56 | |||
Total unrecognized stock-based compensation expense | $ | 31.4 | 2.54 | ||
Cash received from options exercised under all stock-based compensation plans, including cash received from options issued from treasury shares, for the years ended December 31, 2016, 2015 and 2014, was $15.7 million, $20.4 million, and $4.3 million, respectively.
(11) Commitments and Contingencies
(a) Lease Commitments. The Company has various operating leases that call for annual rental payments due in equal monthly installments and a lease with a rent free occupancy period. The Company’s policy is to recognize expense for lease payment, including those with escalating provisions and rent free periods, on a straight-line basis over the lease term. Operating lease expenses were $33.5 million, $41.4 million, and $32.3 million for the years ended December 31, 2016, 2015 and 2014, respectively.
Future minimum lease payments at December 31, 2016 under these non-cancelable leases are as follows:
(in millions) | |||
Year Ended December 31, | |||
2017 | $ | 24.6 | |
2018 | 18.8 | ||
2019 | 15.1 | ||
2020 | 9.6 | ||
2021 | 8.2 | ||
Thereafter | 12.3 | ||
$ | 88.6 | ||
The Company has the option to renew certain plant operating leases, with the longest renewal period extending through 2043. Certain of the operating leases provide for increased rent through increases in general price levels. The Company recognizes rent expense in these situations on a straight-line basis over the lease term.
(b) Purchase Commitments. The Company will, from time to time, enter into limited purchase commitments for the purchase of certain raw materials. Amounts committed under these programs are not significant to the Company as of December 31, 2016 and 2015.
(c) Alvin Todd, and Henry and Mary Thompson, individually and on behalf of all others similarly situated, Plaintiffs v. Tempur Sealy International, Inc., formerly known as Tempur-Pedic International, Inc. and Tempur-Pedic North America, LLC, Defendants; filed October 25, 2013.
On October 25, 2013, a suit was filed against Tempur Sealy International and one of its domestic subsidiaries in the U.S. District Court for the Northern District of California, purportedly on behalf of a proposed class of “consumers” as defined by Cal. Civ. Code § 1761(d) who purchased, not for resale, a Tempur-Pedic mattress or pillow in the State of California. On November 19, 2013, the Company was served for the first time in the case but with an amended petition adding additional class representatives for additional states. The purported classes seek certification of claims under applicable state laws.
82
TEMPUR SEALY INTERNATIONAL, INC. AND CONSOLIDATED SUBSIDIARIES
NOTES TO THE CONSOLIDATED FINANCIAL STATEMENTS (CONTINUED)
The complaint alleges that the Company engaged in unfair business practices, false advertising, and misrepresentations or omissions related to the sale of certain products. The plaintiffs seek restitution, injunctive relief and all other relief allowed under applicable state laws, interest, attorneys’ fees and costs. The purported classes do not seek damages for physical injuries. The Company believes the case lacks merit and intends to defend against the claims vigorously. The Court was scheduled to consider class certification motions in the fourth quarter of 2015; however, the Plaintiffs filed a Motion to Amend the Complaint, at which time the Company filed a Motion to Dismiss the Amended Complaint. A hearing on the Motion to Dismiss was held January 28, 2016 and the Court denied in part and granted in part the Company’s Motion to Dismiss allowing certain claims to proceed. The Court considered class certification motions in August 2016, and in September 2016 denied the Plaintiffs’ motion for class certification. In December 2016, the Ninth Circuit Court of Appeals affirmed the lower court’s decision. It is unclear what additional actions the Plaintiffs may take in light of the denial of class certification. As a result, the outcome of the case remains unclear, and the Company is unable to reasonably estimate the possible loss or range of losses, if any, arising from this litigation, or whether the Company’s applicable insurance policies will provide sufficient coverage for these claims. Accordingly, the Company can give no assurance that this matter will not have a material adverse effect on the Company’s financial position or results of operations.
(d) Other. The Company is involved in various other legal proceedings incidental to the operations of its business. The Company believes that the outcome of all such pending legal proceedings in the aggregate will not have a material adverse effect on its business, financial condition, liquidity, or operating results.
(12) Income Taxes
The following sets forth the amount of income before income taxes attributable to each of the Company’s geographies for the years ended December 31, 2016, 2015 and 2014:
Year Ended December 31, | |||||||||||
(in millions) | 2016 | 2015 | 2014 | ||||||||
Income before income taxes: | |||||||||||
United States | $ | 179.0 | $ | 120.2 | $ | 46.9 | |||||
Rest of the world | 104.3 | 79.9 | 128.0 | ||||||||
$ | 283.3 | $ | 200.1 | $ | 174.9 | ||||||
The Company’s effective income tax provision differs from the amount calculated using the statutory U.S. federal income tax rate, principally due to the following:
Year Ended December 31, | ||||||||||||||||||||
2016 | 2015 | 2014 | ||||||||||||||||||
(dollars in millions) | Amount | Percentage of Income Before Income Taxes | Amount | Percentage of Income Before Income Taxes | Amount | Percentage of Income Before Income Taxes | ||||||||||||||
Statutory U.S. federal income tax | $ | 99.2 | 35.0 | % | $ | 70.0 | 35.0 | % | $ | 61.2 | 35.0 | % | ||||||||
State income taxes, net of federal benefit | 8.0 | 2.8 | % | 1.1 | 0.6 | % | 1.1 | 0.6 | % | |||||||||||
Foreign repatriation, net of foreign tax credits | (4.3 | ) | (1.5 | )% | 0.0 | 0.0 | % | 13.5 | 7.7 | % | ||||||||||
Foreign tax differential | (11.9 | ) | (4.2 | )% | (10.0 | ) | (5.0 | )% | (12.6 | ) | (7.2 | )% | ||||||||
Change in valuation allowances | 20.2 | 7.1 | % | 2.5 | 1.2 | % | (17.7 | ) | (10.0 | )% | ||||||||||
Uncertain tax positions | (27.1 | ) | (9.6 | )% | 59.7 | 29.8 | % | 10.9 | 6.1 | % | ||||||||||
Subpart F income | 2.0 | 0.7 | % | 1.9 | 1.0 | % | 1.9 | 1.1 | % | |||||||||||
Manufacturing deduction | (4.2 | ) | (1.5 | )% | (1.6 | ) | (0.8 | )% | (3.7 | ) | (2.1 | )% | ||||||||
Goodwill on disposal of business | 0.0 | 0.0 | % | 0.0 | 0.0 | % | 7.5 | 4.2 | % | |||||||||||
Permanent and other | 4.9 | 1.8 | % | 1.8 | 0.9 | % | 2.8 | 1.7 | % | |||||||||||
Effective income tax provision | $ | 86.8 | 30.6 | % | $ | 125.4 | 62.7 | % | $ | 64.9 | 37.1 | % | ||||||||
83
TEMPUR SEALY INTERNATIONAL, INC. AND CONSOLIDATED SUBSIDIARIES
NOTES TO THE CONSOLIDATED FINANCIAL STATEMENTS (CONTINUED)
Subpart F income represents interest and royalties earned by a foreign subsidiary as well as sales made by certain foreign subsidiaries outside of their country of incorporation. Under the Internal Revenue Code of 1986, as amended (the "Code"), such income is taxable to Tempur Sealy International as if earned directly by Tempur Sealy International.
The income tax provision consisted of the following:
Year Ended December 31, | |||||||||||
(in millions) | 2016 | 2015 | 2014 | ||||||||
Current provision | |||||||||||
Federal | $ | 73.5 | $ | 107.1 | $ | 50.7 | |||||
State | 4.5 | 7.2 | 4.5 | ||||||||
Foreign | 39.9 | 32.4 | 36.9 | ||||||||
Total current | $ | 117.9 | $ | 146.7 | $ | 92.1 | |||||
Deferred provision | |||||||||||
Federal | $ | (21.4 | ) | $ | (12.3 | ) | $ | (25.2 | ) | ||
State | 1.6 | (3.7 | ) | (1.2 | ) | ||||||
Foreign | (11.3 | ) | (5.3 | ) | (0.8 | ) | |||||
Total deferred | (31.1 | ) | (21.3 | ) | (27.2 | ) | |||||
Total income tax provision | $ | 86.8 | $ | 125.4 | $ | 64.9 | |||||
The income tax provision includes federal, state, and foreign income taxes currently payable and those deferred or prepaid because of temporary differences between financial statement and tax bases of assets and liabilities. The Company records income taxes under the liability method. Under this method, deferred income taxes are recognized for the estimated future tax effects of differences between the tax bases of assets and liabilities and their financial reporting amounts based on enacted tax laws.
The net deferred tax assets and liabilities recognized in the accompanying Consolidated Balance Sheets consisted of the following:
December 31, | |||||||
(in millions) | 2016 | 2015 | |||||
Deferred tax assets: | |||||||
Stock-based compensation | $ | 18.4 | $ | 16.0 | |||
Accrued expenses and other | 49.9 | 57.6 | |||||
Net operating losses, foreign tax credits and other tax attribute carryforwards | 98.5 | 33.1 | |||||
Inventories | 7.2 | 5.1 | |||||
Transaction costs | 10.2 | 22.0 | |||||
Property, plant and equipment | 3.4 | 2.9 | |||||
Total deferred tax assets | 187.6 | 136.7 | |||||
Valuation allowances | (45.2 | ) | (24.2 | ) | |||
Total net deferred tax assets | $ | 142.4 | $ | 112.5 | |||
Deferred tax liabilities: | |||||||
Intangible assets | $ | (242.4 | ) | $ | (247.8 | ) | |
Property, plant and equipment | (42.4 | ) | (42.0 | ) | |||
Accrued expenses and other | (9.7 | ) | (5.9 | ) | |||
Total deferred tax liabilities | (294.5 | ) | (295.7 | ) | |||
Net deferred tax liabilities | $ | (152.1 | ) | $ | (183.2 | ) | |
84
TEMPUR SEALY INTERNATIONAL, INC. AND CONSOLIDATED SUBSIDIARIES
NOTES TO THE CONSOLIDATED FINANCIAL STATEMENTS (CONTINUED)
At December 31, 2016, the Company’s book tax basis in its top tier foreign subsidiary exceeded the Company’s tax basis in this subsidiary in the hands of the top tier foreign subsidiary's U.S. shareholder. It is the Company’s intent to permanently reinvest the earnings of this foreign subsidiary back into this subsidiary's operations. As such, no deferred tax liability has been recorded related to this basis difference. As it relates to the book to tax basis difference with respect to the stock of each of the Company’s lower tier foreign subsidiaries, as a general matter, the book basis exceeds the tax basis in the hands of such foreign subsidiaries' shareholders. By operation of the tax laws of the various countries in which these subsidiaries are domiciled, earnings of lower tier foreign subsidiaries are not subject to tax, in all material respects, when distributed to a foreign shareholder. It is the Company’s intent that the earnings of each lower tier foreign subsidiary, with the exception of its Danish subsidiary and one of its Canadian subsidiaries, will be permanently reinvested in each such foreign subsidiaries' own operations. As it relates to the Danish subsidiary, its earnings may be distributed without any income tax impact. Thus, no tax is provided for with respect to the book to tax basis difference of its stock. With respect to the Canadian subsidiary, Canadian income tax withholding applies to any distribution it makes to its foreign parent company. The Company has concluded that the Canadian subsidiary has accumulated earnings in excess of its operating needs. Consequently, the earnings in excess of the Canadian subsidiary's operating needs is not permanently reinvested in the Canadian subsidiary's operations, and as such the Company has provided for Canadian withholding tax on the excess amount (which would be available for distribution to its foreign parent). Any such distribution is not taxable to the recipient. Consequently, no further tax would result from the distribution by the Canadian subsidiary.
The Company has the following gross income tax attributes available at December 31, 2016 and 2015, respectively:
(in millions) | 2016 | 2015 | |||||
State net operating losses (“SNOLs”) | $ | 131.2 | $ | 128.8 | |||
U.S. federal foreign tax credits (“FTCs”) | 12.2 | 7.8 | |||||
U.S. state income tax credits ("SITCs") | 4.0 | 5.5 | |||||
Foreign net operating losses (“FNOLs”) | 34.1 | 38.0 | |||||
Charitable contribution carryover ("CCCs") | 38.4 | 23.7 | |||||
The SNOLs, FTCs, SITCs, FNOLs and CCCs generally expire in 2021, 2023, 2023, 2023 and 2019, respectively.
Management believes that, based on a number of factors, the available objective evidence creates sufficient uncertainty regarding the realizability of certain of the SNOLs, FTCs, SITCs, FNOLs, CCCs and certain other deferred tax assets related to certain foreign operations (together, the “Tax Attributes”). In assessing the realizability of deferred tax assets (including the Tax Attributes), management considers whether it is more likely than not that some portion of all of such deferred tax assets will not be realized. Accordingly, the Company has established a valuation allowance for certain Tax Attributes. The ultimate realization of deferred tax assets is dependent upon the generation of future taxable income during the periods in which the temporary differences become deductible or creditable. Management considers the scheduled reversal of deferred tax liabilities, projected future taxable income and tax planning strategies in making this assessment. The Company has recorded valuation allowances against approximately $118.9 million of the SNOLs, $12.2 million of the FTCs, and $3.5 million of SITCs. With respect to all other tax attributes above, based upon the level of historical taxable income and projections for future taxable income, management believes it is more likely than not the Company will realize the benefits of the underlying deferred tax assets. However, there can be no assurance that such assets will be realized if circumstances change.
GAAP prescribes a recognition threshold and measurement attribute for the accounting and financial statement disclosure of tax positions taken or expected to be taken in a tax return. The evaluation of a tax position is a two-step process. The first step requires the Company to determine whether it is more likely than not that a tax position will be sustained upon examination based on the technical merits of the position. The second step requires the Company to recognize in the financial statements each tax position that meets the more likely than not criteria, measured at the largest amount of benefit that has a greater than 50.0% likelihood of being realized. A reconciliation of the beginning and ending amount of unrecognized tax benefits is as follows:
85
TEMPUR SEALY INTERNATIONAL, INC. AND CONSOLIDATED SUBSIDIARIES
NOTES TO THE CONSOLIDATED FINANCIAL STATEMENTS (CONTINUED)
(in millions) | |||
Balance as of December 31, 2014 | $ | 47.6 | |
Additions based on tax positions related to 2015 | 0.9 | ||
Additions for tax positions of prior years | 25.7 | ||
Expiration of statutes of limitations | (2.1 | ) | |
Settlements of uncertain tax positions with tax authorities | (2.3 | ) | |
Balance as of December 31, 2015 | $ | 69.8 | |
Additions based on tax positions related to 2016 | 2.5 | ||
Additions for tax positions of prior years | 29.2 | ||
Expiration of statutes of limitations | (5.0 | ) | |
Settlements of uncertain tax positions with tax authorities | (24.8 | ) | |
Balance as of December 31, 2016 | $ | 71.7 | |
The amount of unrecognized tax benefits that would impact the effective tax rate if recognized at December 31, 2016, 2015 and 2014 would be $21.4 million, $67.7 million and $44.6 million, respectively. Interest and penalties related to unrecognized tax benefits are recorded in income tax expense. During the years ended December 31, 2016, 2015 and 2014, the Company recognized approximately $1.6 million, $33.5 million, and $1.9 million in interest and penalties, respectively, in income tax expense. The Company had approximately $52.3 million, $43.8 million, and $10.3 million of accrued interest and penalties at December 31, 2016, 2015, and 2014, respectively.
The Company has received income tax assessments from the Danish Tax Authority ("SKAT") with respect to the tax years 2001 through 2008 relating to the royalty paid by a U.S. subsidiary of Tempur Sealy International to a Danish subsidiary (the "Danish Assessments"). The royalty is paid by the U.S. subsidiary for the right to utilize certain intangible assets owned by the Danish subsidiary in the U.S. production process. In its assessment, SKAT asserts that the amount of royalty rate paid by the U.S. subsidiary to the Danish subsidiary is not reflective of an arms-length transaction. Accordingly, the tax assessment received from SKAT is based, in part, on a 20% royalty rate, which is substantially higher than that historically used or deemed appropriate by the Company.
The cumulative total tax assessment for the Danish Assessments at December 31, 2016 for all years for which an assessment has been received (2001 - 2008) is approximately Danish Krone ("DKK") 1,547.3 million, including interest and penalties ($219.3 million, based on the DKK to USD exchange rate on December 31, 2016). The cumulative total tax assessment at December 31, 2015 for all years for which an assessment had been received up through that date (2001 - 2008), including interest and penalties, was approximately DKK 1,363.1 million ($199.6 million, based on the DKK to USD exchange rate on December 31, 2015). If SKAT continues to issue assessments for each year not currently assessed, the Company expects the aggregate assessments for such years (2009 - 2016) to be in excess of the amounts described above as assessed for the years 2001 - 2008 (collectively the years 2001 through 2016 are referred to as the "Danish Tax Matter").
During 2015, the Company engaged third-party advisors to assist the Company in further evaluating the Danish Tax Matter to determine whether the Company should re-enter negotiations with SKAT. The additional analysis provided the Company with information to evaluate the options available to the Company to resolve this matter, through litigation or through a negotiated settlement, in light of SKAT’s view of this matter and the current tax litigation environment in Denmark. Upon evaluation of the advisor’s analysis, which was substantially completed in the fourth quarter of 2015, the Company concluded that it should discuss with SKAT the possibility of formally resuming negotiations on this matter. In November 2015, the Company and its advisors met with SKAT to discuss various matters relating to the assessment. During this meeting, the Company provided general information regarding the output of the analysis of the Company's advisor as well as additional analyses prepared by the Company as a framework for further discussions with SKAT. SKAT and the Company agreed to continue the dialogue regarding a potential negotiated settlement. In anticipation of continuing dialogue with SKAT on this matter, the Company continues to collect and analyze additional information with the assistance of the third-party advisors as well as discussing the tax litigation environment in Denmark with its Danish legal counsel. As the result of the negotiations, the analyses prepared by the Company and its third-party advisors, and the evaluation of the increased risk of tax litigation in Denmark, the Company recorded a change in estimate to increase the uncertain tax liability for the Danish Tax Matter by approximately $60.7 million in 2015.
86
TEMPUR SEALY INTERNATIONAL, INC. AND CONSOLIDATED SUBSIDIARIES
NOTES TO THE CONSOLIDATED FINANCIAL STATEMENTS (CONTINUED)
At December 31, 2016, the Company had accrued Danish tax and interest for the Danish Tax Matter of approximately DKK 850 million (approximately $120.6 million using the December 31, 2016 exchange rate) as an uncertain income tax liability. Approximately DKK 835 million (approximately $118.5 million using December 31, 2016 exchange rate) represents the amount that the Company and SKAT preliminarily agreed to in a non-binding proposed resolution for the years 2001 through 2011. The balance of approximately DKK 15 million (approximately $2.1 million using the December 31, 2016 exchange rate) may be subject to further negotiation in the future as part of an Advanced Pricing Agreement the Company may choose to pursue for years after 2011. The amount accrued is included in other non-current liabilities on the Company's Consolidated Balance Sheets. In addition, at December 31, 2016 the Company had recorded a deferred tax asset of approximately $43.5 million for the U.S. correlative benefit related to this matter. The Company has recorded a valuation allowance with respect to this benefit of approximately $17.6 million related to years for which relief may not be realized. Because the Company is in a net deferred tax liability position, the deferred tax asset referred to herein is netted with the Company’s deferred tax liabilities as reflected on the Consolidated Balance Sheets at December 31, 2016.
At December 31, 2015, the Company had accrued approximately DKK 856.0 million of Danish tax and interest for the Danish Tax Matter (approximately $125.6 million using the December 31, 2015 exchange rate) as well as approximately $46.0 million of U.S. correlative benefit related to this matter. Both were reflected in other non-current liabilities on the Consolidated Balance Sheets at December 31, 2015.
The Company’s uncertain tax liability associated with the Danish Tax Matter is derived using the cumulative probability analysis with possible outcomes based on the Company's updated evaluation of the facts and circumstances regarding this matter and applying the technical requirements applicable to U.S., Danish, and international transfer pricing standards as required by GAAP, taking into account both the U.S. and Danish income tax implications of such outcomes. Both the uncertain tax liability and the deferred tax asset discussed herein reflects the Company’s best judgment of the facts, circumstances and information available through December 31, 2016.
If the Company is not successful in defending its position before the Danish National Tax Tribunal (the "Tribunal"), the appeals division within SKAT, or in the Danish courts or in negotiating a mutually acceptable settlement, there is significant risk that the Company could be required to pay a significant amount to SKAT in excess of any related reserve. Such an outcome could have a material adverse impact on the Company’s profitability and liquidity. In addition, prior to any ultimate resolution of this issue before the Tribunal or the Danish courts, based on a change in facts and circumstances, the Company may be required to further increase its uncertain tax liability associated with this matter, which could have a material impact on the Company's reported earnings.
Interest and penalties related to unrecognized tax benefits are recorded in income tax expense. It is reasonably possible that there could be material changes to the amount of uncertain tax positions due to activities of the taxing authorities, settlement of audit issues, reassessment of existing uncertain tax positions, including the Danish tax matter, or the expiration of applicable statute of limitations; however, the Company is not able to estimate the impact of these items at this time.
From June 2012 through December 31, 2016, SKAT withheld Value Added Tax refunds otherwise owed to the Company, pending resolution of this matter. Total withheld refunds at December 31, 2016 and 2015 are approximately DKK 258.0 million (approximately $36.6 million) and DKK 176.4 million (approximately $26.0 million), respectively. In July 2016, the Company paid a deposit to SKAT in the amount of approximately DKK 615.2 (approximately $87.2 million using the exchange rate at December 31, 2016) (the “Tax Deposit”) and applied approximately DKK 224.6 million (approximately $31.8 million using the exchange rate at December 31, 2016) of its Value Added Tax refund (the “VAT Refund Applied”) to the aforementioned potential Danish income tax liability, consistent with the Company’s reserve position for this royalty matter. The deposit was made to mitigate additional interest and foreign exchange exposure. The Tax Deposit and the VAT Refund Applied are included within other non-current assets on the Consolidated Balance Sheets.
The Company or one of its subsidiaries files income tax returns in the U.S. federal jurisdiction, and various states and foreign jurisdictions. In the quarter ended September 30, 2015, the Company was advised by the IRS that the federal income tax return for 2013 would be examined. That examination was settled and finalized in the fourth quarter of 2016 commensurate with the Company’s expectations.
With few exceptions, the Company is no longer subject to tax examinations by the U.S. state and local municipalities for periods prior to 2011, and in non-U.S. jurisdictions for periods prior to 2001. Generally Sealy’s state and local jurisdiction income tax returns are no longer subject to examination for years prior to 2011.
87
TEMPUR SEALY INTERNATIONAL, INC. AND CONSOLIDATED SUBSIDIARIES
NOTES TO THE CONSOLIDATED FINANCIAL STATEMENTS (CONTINUED)
Additionally, the Company is currently under examination by various tax authorities around the world. The Company anticipates it is reasonably possible an increase or decrease in the amount of unrecognized tax benefits could be made in the next twelve months as a result of the statute of limitations expiring and/or the examinations being concluded on these returns. However, the Company does not presently anticipate that any increase or decrease in unrecognized tax benefits will be material to the Consolidated Financial Statements. Other than the changes discussed in the preceding paragraphs, particularly as it relates to the Danish royalty matter, there were no significant changes to the liability for unrecognized tax benefits during the year ended December 31, 2016.
(13) Major Customers
Mattress Firm, a customer within the North America segment, is our largest customer. In February 2016, Mattress Firm acquired all of the outstanding equity interests in HMK Mattress Holdings, LLC ("Sleepy’s"). Sleepy’s has historically been one of the Company's top five customers and, as a result of this acquisition, the combined companies represented approximately 20.2% and approximately 22.9% of the Company's sales for the three months ended December 31, 2016, and 2015, respectively. Sales for the combined companies represented 21.4% and 23.7% of the Company's sales for the year ended December 31, 2016, and 2015, respectively. Further information regarding the termination of the Company's commercial relationship with Mattress Firm in January 2017 can be found in Note 1, “Summary of Significant Accounting Policies.”
The top five customers, including the impact of the Mattress Firm acquisition of Sleepy's and its prior acquisitions, accounted for approximately 38.7% and 40.5% of the Company’s sales for the years ended December 31, 2016 and 2015, respectively. The top five customers, including the impact of the Mattress Firm acquisitions, accounted for approximately 28.9% and 35.6% of the Company's accounts receivable as of December 31, 2016 and 2015, respectively.
(14) Non-controlling Interests
The Company's call arrangement with Comfort Revolution may be exercised by the Company on June 12, 2017. The put arrangement may be exercised by Comfort Revolution on June 12, 2018. The redemption value for both the put and the call arrangement is equal to 7.5 times EBITDA, as defined in the related limited liability company ("LLC") agreement, of Comfort Revolution for the preceding 12 months, adjusted for net debt outstanding and multiplied by the 55.0% ownership interest not held by the Company. Due to the existing put and call arrangements, the non-controlling interest is considered to be redeemable and is recorded on the Consolidated Balance Sheets as a redeemable non-controlling interest outside of permanent equity. The redeemable non-controlling interest is recognized at the higher of 1) the accumulated earnings associated with the non-controlling interest or 2) the contractually-defined redemption value as of the balance sheet date. As of December 31, 2016 and 2015, the accumulated earnings exceeded the redemption value and, accordingly, a redemption value adjustment was not necessary.
During the year ended December 31, 2016, the Company acquired 51% of the outstanding equity of an entity included in the North America segment. The remaining 49% represents a non-controlling interest. The non-controlling interest was originally recorded at its acquisition date fair value in “Stockholders’ (deficit) equity” in the Consolidated Balance Sheets at December 31, 2016 as the non-controlling interest is not redeemable currently or in future periods.
88
TEMPUR SEALY INTERNATIONAL, INC. AND CONSOLIDATED SUBSIDIARIES
NOTES TO THE CONSOLIDATED FINANCIAL STATEMENTS (CONTINUED)
(15) Earnings Per Common Share
The following table sets forth the components of the numerator and denominator for the computation of basic and diluted earnings per share for net income attributable to Tempur Sealy International.
Year Ended December 31, | |||||||||||
(in millions, except per common share amounts) | 2016 | 2015 | 2014 | ||||||||
Numerator: | |||||||||||
Net income attributable to Tempur Sealy International, Inc. | $ | 202.1 | $ | 73.5 | $ | 108.9 | |||||
Denominator: | |||||||||||
Denominator for basic earnings per common share—weighted average shares | 59.0 | 61.7 | 60.8 | ||||||||
Effect of dilutive securities: | |||||||||||
Employee stock-based compensation | 0.8 | 0.9 | 1.3 | ||||||||
Denominator for diluted earnings per common share—adjusted weighted average shares | 59.8 | 62.6 | 62.1 | ||||||||
Basic earnings per common share | $ | 3.43 | $ | 1.19 | $ | 1.79 | |||||
Diluted earnings per common share | $ | 3.38 | $ | 1.17 | $ | 1.75 | |||||
The Company excluded 0.4 million, 0.2 million and 0.3 million shares issuable upon exercise of outstanding stock options for the years ended December 31, 2016, 2015, and 2014, respectively, from the diluted earnings per common share computation because their exercise price was greater than the average market price of Tempur Sealy International’s common stock or they were otherwise anti-dilutive. Holders of non-vested stock-based compensation awards do not have voting rights or rights to receive any dividends thereon.
(16) Business Segment Information
The Company operates in two segments: North America and International. Corporate operating expenses are not included in either of the segments and are presented separately as a reconciling item to consolidated results. These segments are strategic business units that are managed separately based on geography. The North America segment consists of Tempur and Sealy manufacturing and distribution subsidiaries, joint ventures and licensees located in the U.S. and Canada. The International segment consists of Tempur and Sealy manufacturing and distribution subsidiaries, joint ventures and licensees located in Europe, Asia-Pacific and Latin America. The Company evaluates segment performance based on net sales, gross profit and operating income.
The Company’s North America and International segment assets include investments in subsidiaries that are appropriately eliminated in the Company’s accompanying Consolidated Financial Statements. The remaining inter-segment eliminations are comprised of intercompany accounts receivable and payable.
The following table summarizes total assets by segment:
December 31, | December 31, | ||||||
(in millions) | 2016 | 2015 | |||||
North America | $ | 2,581.4 | $ | 2,533.1 | |||
International | 572.6 | 477.1 | |||||
Corporate | 658.7 | 775.0 | |||||
Inter-segment eliminations | (1,110.1 | ) | (1,129.7 | ) | |||
Total assets | $ | 2,702.6 | $ | 2,655.5 | |||
The following table summarizes property, plant and equipment, net by segment:
89
TEMPUR SEALY INTERNATIONAL, INC. AND CONSOLIDATED SUBSIDIARIES
NOTES TO THE CONSOLIDATED FINANCIAL STATEMENTS (CONTINUED)
December 31, | December 31, | ||||||
(in millions) | 2016 | 2015 | |||||
North America | $ | 297.4 | $ | 239.2 | |||
International | 54.9 | 54.8 | |||||
Corporate | 69.9 | 67.7 | |||||
Total property, plant and equipment, net | $ | 422.2 | $ | 361.7 | |||
The following table summarizes segment information for the year ended December 31, 2016:
(in millions) | North America | International | Corporate | Eliminations | Consolidated | ||||||||||||||
Bedding sales | $ | 2,447.8 | $ | 443.7 | $ | — | $ | — | $ | 2,891.5 | |||||||||
Other sales | 122.3 | 113.5 | — | — | 235.8 | ||||||||||||||
Net sales | 2,570.1 | 557.2 | — | — | 3,127.3 | ||||||||||||||
Inter-segment sales | $ | 4.6 | $ | 0.4 | $ | — | $ | (5.0 | ) | $ | — | ||||||||
Gross profit | 1,017.4 | 292.0 | — | — | 1,309.4 | ||||||||||||||
Inter-segment royalty expense (income) | 7.2 | (7.2 | ) | — | — | — | |||||||||||||
Operating income (loss) | 411.8 | 102.7 | (99.0 | ) | — | 415.5 | |||||||||||||
Income (loss) before income taxes | 406.8 | 94.0 | (217.5 | ) | — | 283.3 | |||||||||||||
Depreciation and amortization (1) | $ | 43.7 | $ | 15.6 | $ | 30.2 | $ | — | $ | 89.5 | |||||||||
Capital expenditures | 32.8 | 15.3 | 14.3 | — | 62.4 | ||||||||||||||
(1) | Depreciation and amortization includes stock-based compensation amortization expense. |
The following table summarizes segment information for the year ended December 31, 2015:
(in millions) | North America | International | Corporate | Eliminations | Consolidated | ||||||||||||||
Bedding sales | $ | 2,428.9 | $ | 458.3 | $ | — | $ | — | $ | 2,887.2 | |||||||||
Other sales | 148.3 | 115.7 | — | — | 264.0 | ||||||||||||||
Net sales | 2,577.2 | 574.0 | — | — | 3,151.2 | ||||||||||||||
Inter-segment sales | $ | 5.9 | $ | 0.7 | $ | — | $ | (6.6 | ) | $ | — | ||||||||
Gross profit | 954.6 | 294.3 | — | — | 1,248.9 | ||||||||||||||
Inter-segment royalty expense (income) | 7.1 | (7.1 | ) | — | — | — | |||||||||||||
Operating income (loss) | 335.6 | 98.9 | (125.4 | ) | — | 309.1 | |||||||||||||
Income (loss) before income taxes | 324.4 | 73.2 | (197.5 | ) | — | 200.1 | |||||||||||||
Depreciation and amortization (1) | $ | 43.3 | $ | 16.0 | $ | 34.6 | $ | — | $ | 93.9 | |||||||||
Capital expenditures | 28.9 | 14.8 | 22.2 | — | 65.9 | ||||||||||||||
(1) | Depreciation and amortization includes stock-based compensation amortization expense. |
90
TEMPUR SEALY INTERNATIONAL, INC. AND CONSOLIDATED SUBSIDIARIES
NOTES TO THE CONSOLIDATED FINANCIAL STATEMENTS (CONTINUED)
The following table summarizes segment information for the year ended December 31, 2014:
(in millions) | North America | International | Corporate | Eliminations | Consolidated | ||||||||||||||
Bedding sales | $ | 2,261.9 | $ | 464.6 | $ | — | $ | — | $ | 2,726.5 | |||||||||
Other sales | 143.0 | 120.3 | — | — | 263.3 | ||||||||||||||
Net sales | 2,404.9 | 584.9 | — | — | 2,989.8 | ||||||||||||||
Inter-segment sales | $ | 5.1 | $ | 0.3 | $ | — | $ | (5.4 | ) | $ | — | ||||||||
Gross profit | 834.8 | 315.6 | — | — | 1,150.4 | ||||||||||||||
Inter-segment royalty expense (income) | 6.1 | (6.1 | ) | — | — | — | |||||||||||||
Operating income (loss) | 255.0 | 118.8 | (97.5 | ) | — | 276.3 | |||||||||||||
Income (loss) before income taxes | 228.0 | 112.2 | (165.3 | ) | — | 174.9 | |||||||||||||
Depreciation and amortization (1) | $ | 47.9 | $ | 16.3 | $ | 25.5 | $ | — | $ | 89.7 | |||||||||
Capital expenditures | 17.8 | 15.6 | 14.1 | — | 47.5 | ||||||||||||||
(1) | Depreciation and amortization includes stock-based compensation amortization expense. |
The following table summarizes property, plant and equipment, net by geographic region:
December 31, | December 31, | ||||||
(in millions) | 2016 | 2015 | |||||
United States | $ | 360.7 | $ | 300.1 | |||
Canada | 6.6 | 6.8 | |||||
Other International | 54.9 | 54.8 | |||||
Total property, plant and equipment, net | $ | 422.2 | $ | 361.7 | |||
Total International | $ | 61.5 | $ | 61.6 | |||
The following table summarizes net sales by geographic region:
Year Ended December 31, | |||||||||||
(in millions) | 2016 | 2015 | 2014 | ||||||||
United States | $ | 2,361.8 | $ | 2,374.7 | $ | 2,188.8 | |||||
Canada | 208.3 | 202.5 | 216.1 | ||||||||
Other International | 557.2 | 574.0 | 584.9 | ||||||||
Total net sales | $ | 3,127.3 | $ | 3,151.2 | $ | 2,989.8 | |||||
Total International | $ | 765.5 | $ | 776.5 | $ | 801.0 | |||||
91
TEMPUR SEALY INTERNATIONAL, INC. AND CONSOLIDATED SUBSIDIARIES
NOTES TO THE CONSOLIDATED FINANCIAL STATEMENTS (CONTINUED)
(17) Quarterly Financial Data (unaudited)
Quarterly results of operations for the years ended December 31, 2016 and 2015 are summarized below:
(in millions, except per share amounts) | First Quarter | Second Quarter | Third Quarter | Fourth Quarter | |||||||||||
2016 | |||||||||||||||
Net sales | $ | 721.0 | $ | 804.4 | $ | 832.4 | $ | 769.5 | |||||||
Gross profit | 291.0 | 336.9 | 362.1 | 319.4 | |||||||||||
Operating income | 76.7 | 100.2 | 131.1 | 107.5 | |||||||||||
Net income | 39.6 | 21.3 | 77.8 | 63.4 | |||||||||||
Basic earnings per common share | $ | 0.64 | $ | 0.35 | $ | 1.34 | $ | 1.14 | |||||||
Diluted earnings per common share | $ | 0.63 | $ | 0.35 | $ | 1.32 | $ | 1.12 | |||||||
2015 | |||||||||||||||
Net sales | $ | 739.5 | $ | 764.4 | $ | 880.0 | $ | 767.3 | |||||||
Gross profit | 278.7 | 297.5 | 359.6 | 313.1 | |||||||||||
Operating income | 54.4 | 52.0 | 110.9 | 91.8 | |||||||||||
Net income (loss) | 23.4 | 21.2 | 40.2 | (11.3 | ) | ||||||||||
Basic earnings (loss) per common share | $ | 0.38 | $ | 0.35 | $ | 0.65 | $ | (0.18 | ) | ||||||
Diluted earnings (loss) per common share | $ | 0.38 | $ | 0.34 | $ | 0.64 | $ | (0.18 | ) | ||||||
In the second quarter of 2016, the Company recognized a $47.2 million loss on extinguishment of debt. As described in Note 12, "Income Taxes," during the fourth quarter of 2015, the Company recorded a change in estimate of its uncertain tax positions related to the Danish Tax Matter of approximately $60.7 million. In addition, in the third quarter of 2015 the Company recognized $9.5 million of other income from certain other non-recurring items, including the partial settlement of a legal dispute. The sum of the quarterly earnings per common share amounts may not equal the annual amount reported because per share amounts are computed independently for each quarter and for the full year based on respective weighted-average common shares outstanding and other dilutive potential common shares. The Company’s quarterly operating results fluctuate as a result of seasonal variations in the Company’s business.
92
TEMPUR SEALY INTERNATIONAL, INC. AND CONSOLIDATED SUBSIDIARIES
NOTES TO THE CONSOLIDATED FINANCIAL STATEMENTS (CONTINUED)
(18) Guarantor/Non-Guarantor Financial Information
The $450.0 million and $600.0 million aggregate principal amount of 2023 Senior Notes and 2026 Senior Notes (collectively the "Senior Notes"), respectively, are general unsecured senior obligations of Tempur Sealy International and are fully and unconditionally guaranteed on a senior unsecured basis, jointly and severally, by the Combined Guarantor Subsidiaries. The $375.0 million aggregate principal amount of 2020 Senior Notes were general unsecured senior obligations at December 31, 2015 but were redeemed in full in 2016. The foreign subsidiaries (the "Combined Non-Guarantor Subsidiaries") represent the foreign operations of the Company and do not guarantee the Senior Notes. A subsidiary guarantor will be released from its obligations under the applicable indenture governing the Senior Notes when: (a) the subsidiary guarantor is sold or sells all or substantially all of its assets; (b) the subsidiary is declared "unrestricted" under the applicable indenture governing the Senior Notes; (c) the subsidiary’s guarantee of indebtedness under the 2016 Credit Agreement (as it may be amended, refinanced or replaced) is released (other than a discharge through repayment); or (d) the requirements for legal or covenant defeasance or discharge of the applicable indenture have been satisfied. The principal elimination entries relate to investments in subsidiaries and intercompany balances and transactions, including transactions with the Company’s wholly-owned subsidiary guarantors and non-guarantor subsidiaries. The Company has accounted for its investments in its subsidiaries under the equity method.
The following financial information presents Consolidated Balance Sheets as of December 31, 2016 and December 31, 2015, and the related Consolidated Statements of Income and Comprehensive Income and Cash Flows for the years ended December 31, 2016, 2015 and 2014 for Tempur Sealy International, Combined Guarantor Subsidiaries and Combined Non-Guarantor Subsidiaries.
93
TEMPUR SEALY INTERNATIONAL, INC. AND CONSOLIDATED SUBSIDIARIES
NOTES TO THE CONSOLIDATED FINANCIAL STATEMENTS (CONTINUED)
TEMPUR SEALY INTERNATIONAL, INC.
Supplemental Consolidated Statements of Income and Comprehensive Income
Year Ended December 31, 2016
(in millions)
Tempur Sealy International, Inc. (Ultimate Parent) | Combined Guarantor Subsidiaries | Combined Non-Guarantor Subsidiaries | Eliminations | Consolidated | |||||||||||||||
Net sales | $ | — | $ | 2,355.9 | $ | 835.9 | $ | (64.5 | ) | $ | 3,127.3 | ||||||||
Cost of sales | — | 1,409.4 | 473.0 | (64.5 | ) | 1,817.9 | |||||||||||||
Gross profit | — | 946.5 | 362.9 | — | 1,309.4 | ||||||||||||||
Selling and marketing expenses | 2.9 | 458.6 | 187.0 | — | 648.5 | ||||||||||||||
General, administrative and other expenses | 14.8 | 186.8 | 76.6 | — | 278.2 | ||||||||||||||
Equity income in earnings of unconsolidated affiliates | — | — | (13.3 | ) | — | (13.3 | ) | ||||||||||||
Royalty income, net of royalty expense | — | (19.5 | ) | — | — | (19.5 | ) | ||||||||||||
Operating (loss) income | (17.7 | ) | 320.6 | 112.6 | — | 415.5 | |||||||||||||
Other expense, net: | |||||||||||||||||||
Third party interest expense, net | 66.0 | 15.4 | 3.8 | — | 85.2 | ||||||||||||||
Intercompany interest (income) expense, net | (4.1 | ) | (0.1 | ) | 4.2 | — | — | ||||||||||||
Interest expense, net | 61.9 | 15.3 | 8.0 | — | 85.2 | ||||||||||||||
Loss on extinguishment of debt | 34.3 | 12.9 | — | — | 47.2 | ||||||||||||||
Other (income) expense, net | — | (1.4 | ) | 1.2 | — | (0.2 | ) | ||||||||||||
Total other expense | 96.2 | 26.8 | 9.2 | — | 132.2 | ||||||||||||||
Income from equity investees | 271.6 | 76.8 | — | (348.4 | ) | — | |||||||||||||
Income before income taxes | 157.7 | 370.6 | 103.4 | (348.4 | ) | 283.3 | |||||||||||||
Income tax benefit (provision) | 38.8 | (99.0 | ) | (26.6 | ) | — | (86.8 | ) | |||||||||||
Net income before non-controlling interest | 196.5 | 271.6 | 76.8 | (348.4 | ) | 196.5 | |||||||||||||
Less: net loss attributable to non-controlling interests | (5.6 | ) | — | (5.6 | ) | 5.6 | (5.6 | ) | |||||||||||
Net income attributable to Tempur Sealy International, Inc. | $ | 202.1 | $ | 271.6 | $ | 82.4 | $ | (354.0 | ) | $ | 202.1 | ||||||||
Comprehensive income | $ | 190.8 | $ | 271.7 | $ | 71.2 | $ | (342.9 | ) | $ | 190.8 | ||||||||
94
TEMPUR SEALY INTERNATIONAL, INC. AND CONSOLIDATED SUBSIDIARIES
NOTES TO THE CONSOLIDATED FINANCIAL STATEMENTS (CONTINUED)
TEMPUR SEALY INTERNATIONAL, INC.
Supplemental Consolidated Statements of Income and Comprehensive Income
Year Ended December 31, 2015
(in millions)
Tempur Sealy International, Inc. (Ultimate Parent) | Combined Guarantor Subsidiaries | Combined Non-Guarantor Subsidiaries | Eliminations | Consolidated | |||||||||||||||
Net sales | $ | — | $ | 2,422.9 | $ | 778.9 | $ | (50.6 | ) | $ | 3,151.2 | ||||||||
Cost of sales | — | 1,532.6 | 420.3 | (50.6 | ) | 1,902.3 | |||||||||||||
Gross profit | — | 890.3 | 358.6 | — | 1,248.9 | ||||||||||||||
Selling and marketing expenses | 4.1 | 460.1 | 183.8 | — | 648.0 | ||||||||||||||
General, administrative and other expenses | 20.8 | 232.6 | 68.6 | — | 322.0 | ||||||||||||||
Equity income in earnings of unconsolidated affiliates | — | — | (11.9 | ) | — | (11.9 | ) | ||||||||||||
Royalty income, net of royalty expense | — | (18.3 | ) | — | — | (18.3 | ) | ||||||||||||
Operating (loss) income | (24.9 | ) | 215.9 | 118.1 | — | 309.1 | |||||||||||||
Other expense, net: | |||||||||||||||||||
Third party interest expense, net | 27.2 | 66.2 | 2.7 | — | 96.1 | ||||||||||||||
Intercompany interest expense (income), net | 32.9 | (35.5 | ) | 2.6 | — | — | |||||||||||||
Interest expense, net | 60.1 | 30.7 | 5.3 | — | 96.1 | ||||||||||||||
Other (income) expense, net | — | (8.1 | ) | 21.0 | — | 12.9 | |||||||||||||
Total other expense | 60.1 | 22.6 | 26.3 | — | 109.0 | ||||||||||||||
Income from equity investees | 132.9 | 64.7 | — | (197.6 | ) | — | |||||||||||||
Income before income taxes | 47.9 | 258.0 | 91.8 | (197.6 | ) | 200.1 | |||||||||||||
Income tax benefit (provision) | 26.8 | (125.1 | ) | (27.1 | ) | — | (125.4 | ) | |||||||||||
Net income before non-controlling interest | 74.7 | 132.9 | 64.7 | (197.6 | ) | 74.7 | |||||||||||||
Less: net income attributable to non-controlling interests | 1.2 | 1.2 | — | (1.2 | ) | 1.2 | |||||||||||||
Net income attributable to Tempur Sealy International, Inc. | $ | 73.5 | $ | 131.7 | $ | 64.7 | $ | (196.4 | ) | $ | 73.5 | ||||||||
Comprehensive income (loss) | $ | 19.1 | $ | 130.9 | $ | (3.3 | ) | $ | (127.6 | ) | $ | 19.1 | |||||||
95
TEMPUR SEALY INTERNATIONAL, INC. AND CONSOLIDATED SUBSIDIARIES
NOTES TO THE CONSOLIDATED FINANCIAL STATEMENTS (CONTINUED)
TEMPUR SEALY INTERNATIONAL, INC.
Supplemental Consolidated Statements of Income and Comprehensive Income
Year Ended December 31, 2014
(in millions)
Tempur Sealy International, Inc. (Ultimate Parent) | Combined Guarantor Subsidiaries | Combined Non-Guarantor Subsidiaries | Eliminations | Consolidated | |||||||||||||||
Net sales | $ | — | $ | 2,229.5 | $ | 802.9 | $ | (42.6 | ) | $ | 2,989.8 | ||||||||
Cost of sales | — | 1,465.3 | 416.7 | (42.6 | ) | 1,839.4 | |||||||||||||
Gross profit | — | 764.2 | 386.2 | — | 1,150.4 | ||||||||||||||
Selling and marketing expenses | 2.4 | 431.2 | 186.3 | — | 619.9 | ||||||||||||||
General, administrative and other expenses | 13.4 | 200.5 | 66.7 | — | 280.6 | ||||||||||||||
Equity income in earnings of unconsolidated affiliates | — | — | (8.3 | ) | — | (8.3 | ) | ||||||||||||
Royalty income, net of royalty expense | — | (18.1 | ) | — | — | (18.1 | ) | ||||||||||||
Operating (loss) income | (15.8 | ) | 150.6 | 141.5 | — | 276.3 | |||||||||||||
Other expense, net: | |||||||||||||||||||
Third party interest expense, net | 27.0 | 62.4 | 2.5 | — | 91.9 | ||||||||||||||
Intercompany interest expense (income), net | 32.7 | (34.6 | ) | 1.9 | — | — | |||||||||||||
Interest expense, net | 59.7 | 27.8 | 4.4 | — | 91.9 | ||||||||||||||
Loss on disposal, net | — | 23.2 | — | — | 23.2 | ||||||||||||||
Other (income) expense, net | — | (17.2 | ) | 3.5 | — | (13.7 | ) | ||||||||||||
Total other expense | 59.7 | 33.8 | 7.9 | — | 101.4 | ||||||||||||||
Income from equity investees | 159.2 | 98.7 | — | (257.9 | ) | — | |||||||||||||
Income before income taxes | 83.7 | 215.5 | 133.6 | (257.9 | ) | 174.9 | |||||||||||||
Income tax benefit (provision) | 26.3 | (56.3 | ) | (34.9 | ) | — | (64.9 | ) | |||||||||||
Net income before non-controlling interest | 110.0 | 159.2 | 98.7 | (257.9 | ) | 110.0 | |||||||||||||
Less: net income attributable to non-controlling interests | 1.1 | 1.1 | — | (1.1 | ) | 1.1 | |||||||||||||
Net income attributable to Tempur Sealy International, Inc. | $ | 108.9 | $ | 158.1 | $ | 98.7 | $ | (256.8 | ) | $ | 108.9 | ||||||||
Comprehensive income | $ | 66.9 | $ | 163.3 | $ | 60.3 | $ | (223.6 | ) | $ | 66.9 | ||||||||
96
TEMPUR SEALY INTERNATIONAL, INC. AND CONSOLIDATED SUBSIDIARIES
NOTES TO THE CONSOLIDATED FINANCIAL STATEMENTS (CONTINUED)
TEMPUR SEALY INTERNATIONAL, INC.
Supplemental Consolidated Balance Sheets
December 31, 2016
(in millions)
Tempur Sealy International, Inc. (Ultimate Parent) | Combined Guarantor Subsidiaries | Combined Non-Guarantor Subsidiaries | Eliminations | Consolidated | |||||||||||||||
ASSETS | |||||||||||||||||||
Current Assets: | |||||||||||||||||||
Cash and cash equivalents | $ | — | $ | 7.9 | $ | 57.8 | $ | — | $ | 65.7 | |||||||||
Accounts receivable, net | — | 197.7 | 147.4 | — | 345.1 | ||||||||||||||
Inventories | — | 117.1 | 79.7 | — | 196.8 | ||||||||||||||
Income tax receivable | 234.2 | — | — | (234.2 | ) | — | |||||||||||||
Prepaid expenses and other current assets | — | 48.9 | 15.0 | — | 63.9 | ||||||||||||||
Total Current Assets | 234.2 | 371.6 | 299.9 | (234.2 | ) | 671.5 | |||||||||||||
Property, plant and equipment, net | — | 346.9 | 75.3 | — | 422.2 | ||||||||||||||
Goodwill | — | 500.2 | 222.3 | — | 722.5 | ||||||||||||||
Other intangible assets, net | — | 589.8 | 88.9 | — | 678.7 | ||||||||||||||
Deferred income taxes | 20.6 | — | 22.5 | (20.6 | ) | 22.5 | |||||||||||||
Other non-current assets | — | 41.7 | 143.5 | — | 185.2 | ||||||||||||||
Net investment in subsidiaries | 2,207.4 | 77.7 | — | (2,285.1 | ) | — | |||||||||||||
Due from affiliates | 168.4 | 1,874.7 | 14.3 | (2,057.4 | ) | — | |||||||||||||
Total Assets | $ | 2,630.6 | $ | 3,802.6 | $ | 866.7 | $ | (4,597.3 | ) | $ | 2,702.6 | ||||||||
LIABILITIES AND STOCKHOLDERS’ EQUITY | |||||||||||||||||||
Current Liabilities: | |||||||||||||||||||
Accounts payable | $ | 0.1 | $ | 157.0 | $ | 62.2 | $ | — | $ | 219.3 | |||||||||
Accrued expenses and other current liabilities | 6.8 | 172.6 | 70.7 | — | 250.1 | ||||||||||||||
Income taxes payable | — | 235.9 | 4.1 | (234.2 | ) | 5.8 | |||||||||||||
Current portion of long-term debt | — | 34.4 | 35.9 | — | 70.3 | ||||||||||||||
Total Current Liabilities | 6.9 | 599.9 | 172.9 | (234.2 | ) | 545.5 | |||||||||||||
Long-term debt, net | 1,040.4 | 776.5 | 0.9 | — | 1,817.8 | ||||||||||||||
Deferred income taxes | — | 174.9 | 20.3 | (20.6 | ) | 174.6 | |||||||||||||
Other non-current liabilities | — | 43.3 | 126.0 | — | 169.3 | ||||||||||||||
Due to affiliates | 1,587.9 | 0.6 | 468.9 | (2,057.4 | ) | — | |||||||||||||
Total Liabilities | 2,635.2 | 1,595.2 | 789.0 | (2,312.2 | ) | 2,707.2 | |||||||||||||
Redeemable non-controlling interest | 7.6 | — | 7.6 | (7.6 | ) | 7.6 | |||||||||||||
Total stockholders’ (deficit) equity, net of non-controlling interests in subsidiaries | (15.2 | ) | 2,207.4 | 67.1 | (2,274.5 | ) | (15.2 | ) | |||||||||||
Non-controlling interest in subsidiaries | 3.0 | — | 3.0 | (3.0 | ) | 3.0 | |||||||||||||
Total Stockholder's (Deficit) Equity | (12.2 | ) | 2,207.4 | 70.1 | (2,277.5 | ) | (12.2 | ) | |||||||||||
Total Liabilities and Stockholders’ (Deficit) Equity | $ | 2,630.6 | $ | 3,802.6 | $ | 866.7 | $ | (4,597.3 | ) | $ | 2,702.6 | ||||||||
97
TEMPUR SEALY INTERNATIONAL, INC. AND CONSOLIDATED SUBSIDIARIES
NOTES TO THE CONSOLIDATED FINANCIAL STATEMENTS (CONTINUED)
TEMPUR SEALY INTERNATIONAL, INC.
Supplemental Consolidated Balance Sheets
December 31, 2015
(in millions)
Tempur Sealy International, Inc. (Ultimate Parent) | Combined Guarantor Subsidiaries | Combined Non-Guarantor Subsidiaries | Eliminations | Consolidated | |||||||||||||||
ASSETS | |||||||||||||||||||
Current Assets: | |||||||||||||||||||
Cash and cash equivalents | $ | — | $ | 119.7 | $ | 34.2 | $ | — | $ | 153.9 | |||||||||
Accounts receivable, net | — | 231.9 | 147.5 | — | 379.4 | ||||||||||||||
Inventories | — | 145.3 | 53.9 | — | 199.2 | ||||||||||||||
Income tax receivable | 193.1 | — | — | (193.1 | ) | — | |||||||||||||
Prepaid expenses and other current assets | — | 45.6 | 31.0 | — | 76.6 | ||||||||||||||
Total Current Assets | 193.1 | 542.5 | 266.6 | (193.1 | ) | 809.1 | |||||||||||||
Property, plant and equipment, net | — | 300.1 | 61.6 | — | 361.7 | ||||||||||||||
Goodwill | — | 501.4 | 208.0 | — | 709.4 | ||||||||||||||
Other intangible assets, net | — | 612.9 | 82.5 | — | 695.4 | ||||||||||||||
Deferred tax asset | 16.0 | — | 12.2 | (16.0 | ) | 12.2 | |||||||||||||
Other non-current assets | — | 23.3 | 44.4 | — | 67.7 | ||||||||||||||
Net investment in subsidiaries | 1,960.5 | — | — | (1,960.5 | ) | — | |||||||||||||
Due from affiliates | 548.1 | 1,655.3 | 4.8 | (2,208.2 | ) | — | |||||||||||||
Total Assets | $ | 2,717.7 | $ | 3,635.5 | $ | 680.1 | $ | (4,377.8 | ) | $ | 2,655.5 | ||||||||
LIABILITIES AND STOCKHOLDERS’ EQUITY | |||||||||||||||||||
Current Liabilities: | |||||||||||||||||||
Accounts payable | $ | — | $ | 212.2 | $ | 54.1 | $ | — | $ | 266.3 | |||||||||
Accrued expenses and other current liabilities | 1.4 | 183.8 | 68.8 | — | 254.0 | ||||||||||||||
Income taxes payable | — | 196.0 | 8.3 | (193.1 | ) | 11.2 | |||||||||||||
Current portion of long-term debt | — | 168.7 | 12.8 | — | 181.5 | ||||||||||||||
Total Current Liabilities | 1.4 | 760.7 | 144.0 | (193.1 | ) | 713.0 | |||||||||||||
Long-term debt, net | 811.9 | 461.4 | — | — | 1,273.3 | ||||||||||||||
Deferred income taxes | — | 189.8 | 21.6 | (16.0 | ) | 195.4 | |||||||||||||
Other non-current liabilities | — | 166.6 | 4.6 | — | 171.2 | ||||||||||||||
Due to affiliates | 1,601.8 | 96.5 | 604.9 | (2,303.2 | ) | — | |||||||||||||
Total Liabilities | 2,415.1 | 1,675.0 | 775.1 | (2,512.3 | ) | 2,352.9 | |||||||||||||
Redeemable non-controlling interest | 12.4 | 12.4 | — | (12.4 | ) | 12.4 | |||||||||||||
Total Stockholders’ (Deficit) Equity | 290.2 | 1,948.1 | (95.0 | ) | (1,853.1 | ) | 290.2 | ||||||||||||
Total Liabilities and Stockholders’ (Deficit) Equity | $ | 2,717.7 | $ | 3,635.5 | $ | 680.1 | $ | (4,377.8 | ) | $ | 2,655.5 | ||||||||
98
TEMPUR SEALY INTERNATIONAL, INC. AND CONSOLIDATED SUBSIDIARIES
NOTES TO THE CONSOLIDATED FINANCIAL STATEMENTS (CONTINUED)
TEMPUR SEALY INTERNATIONAL, INC.
Supplemental Consolidated Statements of Cash Flows
Year Ended December 31, 2016
(in millions)
Tempur Sealy International, Inc. (Ultimate Parent) | Combined Guarantor Subsidiaries | Combined Non-Guarantor Subsidiaries | Eliminations | Consolidated | |||||||||||||||
Net cash (used in) provided by operating activities | $ | (63.1 | ) | $ | 110.7 | $ | 117.9 | $ | — | $ | 165.5 | ||||||||
CASH FLOWS FROM INVESTING ACTIVITIES: | |||||||||||||||||||
Contributions (paid to) received from subsidiaries and affiliates | — | (76.7 | ) | 76.7 | — | — | |||||||||||||
Purchases of property, plant and equipment | — | (43.0 | ) | (19.4 | ) | (62.4 | ) | ||||||||||||
Net cash (used in) provided by investing activities | — | (119.7 | ) | 57.3 | — | (62.4 | ) | ||||||||||||
CASH FLOWS FROM FINANCING ACTIVITIES: | |||||||||||||||||||
Proceeds from borrowings under long-term debt obligations | 600.0 | 1,523.6 | 109.7 | — | 2,233.3 | ||||||||||||||
Repayments of borrowings under long-term debt obligations | (375.0 | ) | (1,406.2 | ) | (86.5 | ) | — | (1,867.7 | ) | ||||||||||
Net activity in investment in and advances from (to) subsidiaries and affiliates | 383.1 | (212.5 | ) | (170.6 | ) | — | — | ||||||||||||
Proceeds from exercise of stock options | 15.7 | — | — | — | 15.7 | ||||||||||||||
Excess tax benefit from stock-based compensation | 7.0 | — | — | — | 7.0 | ||||||||||||||
Treasury stock repurchased | (535.0 | ) | — | — | — | (535.0 | ) | ||||||||||||
Payment of deferred financing costs | (3.1 | ) | (3.8 | ) | — | — | (6.9 | ) | |||||||||||
Fees paid to lenders | (6.0 | ) | (1.8 | ) | — | — | (7.8 | ) | |||||||||||
Call premium on 2020 Senior Notes | (23.6 | ) | — | — | — | (23.6 | ) | ||||||||||||
Other | — | (2.1 | ) | 2.0 | — | (0.1 | ) | ||||||||||||
Net cash provided by (used in) financing activities | 63.1 | (102.8 | ) | (145.4 | ) | — | (185.1 | ) | |||||||||||
NET EFFECT OF EXCHANGE RATE CHANGES ON CASH AND CASH EQUIVALENTS | — | — | (6.2 | ) | — | (6.2 | ) | ||||||||||||
(Decrease) increase in cash and cash equivalents | — | (111.8 | ) | 23.6 | — | (88.2 | ) | ||||||||||||
CASH AND CASH EQUIVALENTS, BEGINNING OF PERIOD | — | 119.7 | 34.2 | — | 153.9 | ||||||||||||||
CASH AND CASH EQUIVALENTS, END OF PERIOD | $ | — | $ | 7.9 | $ | 57.8 | $ | — | $ | 65.7 | |||||||||
99
TEMPUR SEALY INTERNATIONAL, INC. AND CONSOLIDATED SUBSIDIARIES
NOTES TO THE CONSOLIDATED FINANCIAL STATEMENTS (CONTINUED)
TEMPUR SEALY INTERNATIONAL, INC.
Supplemental Consolidated Statements of Cash Flows
Year Ended December 31, 2015
(in millions)
Tempur Sealy International, Inc. (Ultimate Parent) | Combined Guarantor Subsidiaries | Combined Non-Guarantor Subsidiaries | Eliminations | Consolidated | |||||||||||||||
Net cash (used in) provided by operating activities | $ | (87.0 | ) | $ | 274.7 | $ | 46.5 | $ | — | $ | 234.2 | ||||||||
CASH FLOWS FROM INVESTING ACTIVITIES: | |||||||||||||||||||
Proceeds from disposition of business | — | 7.2 | — | — | 7.2 | ||||||||||||||
Purchases of property, plant and equipment | — | (49.9 | ) | (16.0 | ) | — | (65.9 | ) | |||||||||||
Other | — | (0.7 | ) | (0.3 | ) | — | (1.0 | ) | |||||||||||
Net cash used in investing activities | — | (43.4 | ) | (16.3 | ) | — | (59.7 | ) | |||||||||||
CASH FLOWS FROM FINANCING ACTIVITIES: | |||||||||||||||||||
Proceeds from borrowings under long-term debt obligations | 450.0 | 402.9 | 10.6 | — | 863.5 | ||||||||||||||
Repayments of borrowings under long-term debt obligations | — | (988.3 | ) | — | — | (988.3 | ) | ||||||||||||
Net activity in investment in and advances (to) from subsidiaries and affiliates | (401.3 | ) | 453.4 | (52.1 | ) | — | — | ||||||||||||
Proceeds from exercise of stock options | 20.4 | — | — | — | 20.4 | ||||||||||||||
Excess tax benefit from stock-based compensation | 21.8 | — | — | — | 21.8 | ||||||||||||||
Proceeds from purchase of treasury shares by CEO | 5.0 | — | — | — | 5.0 | ||||||||||||||
Treasury stock repurchased | (1.3 | ) | — | — | — | (1.3 | ) | ||||||||||||
Payment of deferred financing costs | (8.0 | ) | — | — | — | (8.0 | ) | ||||||||||||
Other | — | (3.0 | ) | (0.8 | ) | — | (3.8 | ) | |||||||||||
Net cash provided by (used in) financing activities | 86.6 | (135.0 | ) | (42.3 | ) | — | (90.7 | ) | |||||||||||
NET EFFECT OF EXCHANGE RATE CHANGES ON CASH AND CASH EQUIVALENTS | — | — | 7.6 | — | 7.6 | ||||||||||||||
(Decrease) increase in cash and cash equivalents | (0.4 | ) | 96.3 | (4.5 | ) | — | 91.4 | ||||||||||||
CASH AND CASH EQUIVALENTS, BEGININNG OF PERIOD | 0.4 | 23.4 | 38.7 | — | 62.5 | ||||||||||||||
CASH AND CASH EQUIVALENTS, END OF PERIOD | $ | — | $ | 119.7 | $ | 34.2 | $ | — | $ | 153.9 | |||||||||
100
TEMPUR SEALY INTERNATIONAL, INC. AND CONSOLIDATED SUBSIDIARIES
NOTES TO THE CONSOLIDATED FINANCIAL STATEMENTS (CONTINUED)
TEMPUR SEALY INTERNATIONAL, INC.
Supplemental Consolidated Statements of Cash Flows
Year Ended December 31, 2014
(in millions)
Tempur Sealy International, Inc. (Ultimate Parent) | Combined Guarantor Subsidiaries | Combined Non-Guarantor Subsidiaries | Eliminations | Consolidated | |||||||||||||||
Net cash (used in) provided by operating activities | $ | (62.7 | ) | $ | 191.5 | $ | 96.4 | $ | — | $ | 225.2 | ||||||||
CASH FLOWS FROM INVESTING ACTIVITIES: | |||||||||||||||||||
Acquisition of business, net of cash acquired | — | — | (8.5 | ) | — | (8.5 | ) | ||||||||||||
Proceeds from disposition of business | — | 43.5 | — | — | 43.5 | ||||||||||||||
Purchases of property, plant and equipment | — | (31.3 | ) | (16.2 | ) | — | (47.5 | ) | |||||||||||
Other | — | 3.0 | (0.9 | ) | — | 2.1 | |||||||||||||
Net cash provided by (used in) investing activities | — | 15.2 | (25.6 | ) | — | (10.4 | ) | ||||||||||||
CASH FLOWS FROM FINANCING ACTIVITIES: | |||||||||||||||||||
Proceeds from borrowings under long-term debt obligations | — | 271.5 | — | — | 271.5 | ||||||||||||||
Repayments of borrowings under long-term debt obligations | — | (510.9 | ) | — | — | (510.9 | ) | ||||||||||||
Net activity in investment in and advances from (to) subsidiaries and affiliates | 59.3 | 32.1 | (91.4 | ) | — | — | |||||||||||||
Proceeds from exercise of stock options | 4.3 | — | — | — | 4.3 | ||||||||||||||
Excess tax benefit from stock-based compensation | 1.7 | — | — | — | 1.7 | ||||||||||||||
Treasury stock repurchased | (2.2 | ) | — | — | — | (2.2 | ) | ||||||||||||
Payment of deferred financing costs | — | (3.1 | ) | — | — | (3.1 | ) | ||||||||||||
Other | — | (1.7 | ) | 2.3 | — | 0.6 | |||||||||||||
Net cash provided by (used in) financing activities | 63.1 | (212.1 | ) | (89.1 | ) | — | (238.1 | ) | |||||||||||
NET EFFECT OF EXCHANGE RATE CHANGES ON CASH AND CASH EQUIVALENTS | — | — | 4.8 | — | 4.8 | ||||||||||||||
Increase (decrease) in cash and cash equivalents | 0.4 | (5.4 | ) | (13.5 | ) | — | (18.5 | ) | |||||||||||
CASH AND CASH EQUIVALENTS, BEGININNG OF PERIOD | — | 28.8 | 52.2 | — | 81.0 | ||||||||||||||
CASH AND CASH EQUIVALENTS, END OF PERIOD | $ | 0.4 | $ | 23.4 | $ | 38.7 | $ | — | $ | 62.5 | |||||||||
101
ITEM 9. CHANGES IN AND DISAGREEMENTS WITH ACCOUNTANTS ON ACCOUNTING AND FINANCIAL DISCLOSURE
None.
ITEM 9A. CONTROLS AND PROCEDURES
Evaluation of Disclosure Controls and Procedures
An evaluation was performed under the supervision and with the participation of our management, including our Chief Executive Officer (principal executive officer) and Chief Financial Officer (principal financial officer), of the effectiveness of our disclosure controls and procedures, as defined in Rules 13a-15(e) and 15d-15(e) under the Exchange Act, as of the end of the period covered by this Report. Based on that evaluation, our management, including our Chief Executive Officer and Chief Financial Officer, concluded that our disclosure controls and procedures were effective as of December 31, 2016, and designed to ensure that information required to be disclosed by us in reports that we file or submit under the Exchange Act, is recorded, processed, summarized and reported within the time periods specified in the rules and forms of the Securities and Exchange Commission and that such information is accumulated and communicated to our management, including our Chief Executive Officer and Chief Financial Officer, as appropriate to allow timely decisions regarding required disclosure.
Management’s Annual Report on Internal Control Over Financial Reporting
Our management is responsible for establishing and maintaining adequate internal control over financial reporting as defined in Rules 13a-15(f) and 15d-15(f) under the Exchange Act. Our internal control over financial reporting is designed to provide reasonable assurance regarding the reliability of financial reporting and the preparation of financial statements for external purposes in accordance with GAAP.
Because of its inherent limitations, internal control over financial reporting may not prevent or detect misstatements. Therefore, even those systems determined to be effective can provide only reasonable assurance of achieving their control objectives.
Under the supervision and with the participation of our management, including our Chief Executive Officer and Chief Financial Officer, we evaluated the effectiveness of our internal control over financial reporting as of December 31, 2016 based on the framework in Internal Control - Integrated Framework (2013) issued by the Committee of Sponsoring Organizations of the Treadway Commission ("COSO"). Based on our assessment and those criteria, management believes that we maintained effective internal control over financial reporting as of December 31, 2016.
Our independent registered public accounting firm, Ernst & Young LLP, has issued a report on the Company’s internal control over financial reporting as of December 31, 2016. That report appears on page 104 of this Report.
Changes in Internal Control over Financial Reporting
There have not been any changes in our internal control over financial reporting during the quarter ended December 31, 2016 that have materially affected, or are reasonably likely to materially affect, our internal control over financial reporting.
102
Report of Independent Registered Public Accounting Firm
The Board of Directors and Stockholders of Tempur Sealy International, Inc. and Subsidiaries
We have audited Tempur Sealy International, Inc. and Subsidiaries’ internal control over financial reporting as of December 31, 2016, based on criteria established in Internal Control-Integrated Framework issued by the Committee of Sponsoring Organizations of the Treadway Commission (2013 Framework) (the COSO criteria). Tempur Sealy International, Inc. and Subsidiaries’ management is responsible for maintaining effective internal control over financial reporting, and for its assessment of the effectiveness of internal control over financial reporting included in the accompanying ”Management’s Annual Report on Internal Control Over Financial Reporting.” Our responsibility is to express an opinion on the company’s internal control over financial reporting based on our audit.
We conducted our audit in accordance with the standards of the Public Company Accounting Oversight Board (United States). Those standards require that we plan and perform the audit to obtain reasonable assurance about whether effective internal control over financial reporting was maintained in all material respects. Our audit included obtaining an understanding of internal control over financial reporting, assessing the risk that a material weakness exists, testing and evaluating the design and operating effectiveness of internal control based on the assessed risk, and performing such other procedures as we considered necessary in the circumstances. We believe that our audit provides a reasonable basis for our opinion.
A company’s internal control over financial reporting is a process designed to provide reasonable assurance regarding the reliability of financial reporting and the preparation of financial statements for external purposes in accordance with generally accepted accounting principles. A company’s internal control over financial reporting includes those policies and procedures that (1) pertain to the maintenance of records that, in reasonable detail, accurately and fairly reflect the transactions and dispositions of the assets of the company; (2) provide reasonable assurance that transactions are recorded as necessary to permit preparation of financial statements in accordance with generally accepted accounting principles, and that receipts and expenditures of the company are being made only in accordance with authorizations of management and directors of the company; and (3) provide reasonable assurance regarding prevention or timely detection of unauthorized acquisition, use, or disposition of the company’s assets that could have a material effect on the financial statements.
Because of its inherent limitations, internal control over financial reporting may not prevent or detect misstatements. Also, projections of any evaluation of effectiveness to future periods are subject to the risk that controls may become inadequate because of changes in conditions, or that the degree of compliance with the policies or procedures may deteriorate.
In our opinion, Tempur Sealy International, Inc. and Subsidiaries maintained, in all material respects, effective internal control over financial reporting as of December 31, 2016, based on the COSO criteria.
We also have audited, in accordance with the standards of the Public Company Accounting Oversight Board (United States), the consolidated balance sheets of Tempur Sealy International, Inc. and Subsidiaries as of December 31, 2016 and 2015, and the related consolidated statements of income, comprehensive income, stockholders’ equity, and cash flows for each of the three years in the period ended December 31, 2016 and our report dated February 24, 2017 expressed an unqualified opinion thereon.
/s/ Ernst & Young LLP
Louisville, Kentucky
February 24, 2017
103
PART III
ITEM 10. DIRECTORS, EXECUTIVE OFFICERS AND CORPORATE GOVERNANCE
The information required by this Item is incorporated herein by reference from our definitive proxy statement for the 2017 Annual Meeting of Stockholders (the "Proxy Statement") under the sections entitled “Proposal One—Election of Directors,” and “Board of Directors’ Meetings, Committees of the Board and Related Matters—Corporate Governance,” — "Committees of the Board,” —“Policies Governing Director Nominations,” and “Executive Compensation and Related Information—Section 16(a) Beneficial Ownership Reporting Compliance.”
Information relating to executive officers is incorporated herein by reference from our Proxy Statement under the section entitled “Proposal One—Election of Directors—Executive Officers.”
ITEM 11. EXECUTIVE COMPENSATION
The information required by this Item is incorporated by reference from the Proxy Statement under the sections entitled “Executive Compensation and Related Information” and “Board of Directors’ Meetings, Committees of the Board and Related Matters—Compensation Committee Interlocks and Insider Participation.”
ITEM 12. SECURITY OWNERSHIP OF CERTAIN BENEFICIAL OWNERS AND MANAGEMENT AND RELATED STOCKHOLDER MATTERS
Equity Compensation Plan Information
The following table sets forth equity compensation plan information as of December 31, 2016:
Plan category | Number of securities to be issued upon exercise of outstanding options, warrants and rights | Weighted-average exercise price of outstanding options, warrants and rights | Number of securities remaining available for future issuance under equity compensation plans (excluding securities reflected in column (a)) | |||||||
(a) | (b) | (c) | ||||||||
Equity compensation plans approved by security holders: | ||||||||||
2003 Amended and Restated Equity Incentive Plan (1) | 650,094 | $ | 36.48 | — | ||||||
2013 Equity Incentive Plan (2) | 3,657,787 | 61.69 | 1,323,062 | |||||||
Equity compensation plans not approved by security holders | — | — | 0 | |||||||
Total | 4,307,881 | $ | 50.46 | 1,323,062 | ||||||
(1) | In May 2013, our Board of Directors adopted a resolution that prohibited further grants under the 2003 Amended and Restated Equity Incentive Plan. The number of securities to be issued upon exercise of outstanding stock options, warrants and rights issued under the 2003 Amended and Restated Equity Incentive Plan includes 404 shares issuable under restricted stock units and deferred stock units. These restricted and deferred stock units are excluded from the weighted average exercise price calculation above. |
(2) | The number of securities to be issued upon exercise of outstanding stock options, warrants and rights issued under the 2013 Equity Incentive Plan includes 396,622 shares issuable under restricted stock units and deferred stock units. Additionally, this number includes 2,452,889 performance restricted stock units which reflects a maximum payout of the awards granted. These restricted, deferred and performance restricted stock units are excluded from the weighted average exercise price calculation above. |
For information regarding the material features of each of the above plans see Note 10, “Stock-based Compensation,” in our Consolidated Financial Statements included in Part II, ITEM 8 of this Report.
All other information required by this Item is incorporated by reference from the Proxy Statement under the section entitled "Principal Security Ownership and Certain Beneficial Owners."
ITEM 13. CERTAIN RELATIONSHIPS AND RELATED TRANSACTIONS, AND DIRECTOR INDEPENDENCE
The information required by this Item is incorporated by reference from the Proxy Statement under the section entitled “Executive Compensation and Related Information—Certain Relationships and Related Transactions” and “Board of Directors' Meetings, Committees of the Board and Related Matters—Directors’ Independence.”
104
ITEM 14. PRINCIPAL ACCOUNTING FEES AND SERVICES
The information required by this Item is incorporated by reference from the Proxy Statement under the sections entitled “Proposal Two— Ratification of Independent Auditors—Fees for Independent Auditors During the years Ended December 31, 2016 and 2015” and “—Policy on Audit Committee Pre-Approval of Audit and Non-Audit Services of Independent Auditors.”
PART IV
ITEM 15. EXHIBITS AND FINANCIAL STATEMENT SCHEDULE
(a) | 1. | The following is a list of the financial statements of Tempur Sealy International, Inc. included in this Report, which are filed herewith pursuant to ITEM 8: |
Report of Independent Registered Public Accounting Firm | ||
Consolidated Statements of Income for the years ended December 31, 2016, 2015 and 2014 | ||
Consolidated Statements of Comprehensive Income for the years ended December 31, 2016, 2015 and 2014 | ||
Consolidated Balance Sheets as of December 31, 2016 and 2015 | ||
Consolidated Statements of Stockholders' (Deficit) Equity for the years ended December 31, 2016, 2015 and 2014 | ||
Consolidated Statements of Cash Flows for the years ended December 31, 2016, 2015 and 2014 | ||
Notes to the Consolidated Financial Statements | ||
2. | Financial Statement Schedule: | |
Schedule II—Valuation of Qualifying Accounts and Reserves | ||
All other schedules have been omitted because they are inapplicable, not required, or the information is included elsewhere in the Consolidated Financial Statements or notes thereto. | ||
3. | Exhibits: | |
The following is an index of the exhibits included in this Report or incorporated herein by reference.
(b) | EXHIBIT INDEX | |
3.1 | Amended and Restated Certificate of Incorporation of Tempur-Pedic International Inc. (filed as Exhibit 3.1 to Amendment No. 3 to the Registrant’s registration statement on Form S-1 (File No. 333-109798) as filed on December 12, 2003). (1) |
3.2 | Amendment to Certificate of Incorporation of Tempur-Pedic International Inc. (filed as Exhibit 3.1 to the Registrant’s Current Report on Form 8-K as filed on May 24, 2013). (1) |
3.3 | Sixth Amended and Restated By-laws of Tempur Sealy International, Inc. (filed as Exhibit 10.2 to the Registrant’s Current Report on Form 8-K as filed on October 14, 2015). (1) |
3.4 | Certificate of Designation for Series A Junior Participating Preferred Stock of Tempur Sealy International, Inc. (filed as Exhibit 3.1 to the Registrant’s Current Report on Form 8-K filed on February 9, 2017). (1) |
4.1 | Specimen certificate for shares of common stock (filed as Exhibit 4.1 to Amendment No. 3 to the Registrant’s registration statement on Form S-1 (File No. 333-109798) as filed on December 12, 2003). (1) |
4.2 | Indenture dated as of December 19, 2012 (filed as Exhibit 4.1 to the Registrant’s Current Report on Form 8-K as filed on December 19, 2012). (1) |
4.3 | Registration Rights Agreement dated as of December 19, 2012 (filed as Exhibit 4.2 to the Registrant’s Current Report on Form 8-K as filed on December 19, 2012). (1) |
4.4 | Supplemental Indenture, dated as of March 18, 2013, among Tempur-Pedic International Inc., the additional Guarantors party thereto and The Bank of New York Mellon Trust Company, N.A., as Trustee (filed as Exhibit 4.1 to the Registrant’s Current Report on Form 8-K as filed on March 18, 2013). (1) |
4.5 | Indenture, dated as of July 10, 2009, by and among Sealy Mattress Company, the Guarantors named therein and The Bank of New York Mellon Trust Company, N.A., as Trustee, with respect to Guaranteed Debt Securities (filed as Exhibit 4.1 to Sealy Corporation’s Current Report on Form 8-K (File No. 333-117081) as filed July 16, 2009). (1) |
4.6 | Supplemental Indenture, dated as of July 10, 2009, by and among Sealy Mattress Company, Sealy Corporation, the Guarantors named therein and The Bank of New York Mellon Trust Company, N.A., as Trustee and Collateral Agent, with respect to 8% Senior Secured Third Lien Convertible Notes due 2016 (filed as Exhibit 4.2 to Sealy Corporation’s Current Report on Form 8-K (File No. 333-117081) as filed July 16, 2009). (1) |
105
4.7 | Second Supplemental Indenture, dated as of March 18, 2013, by and among Sealy Mattress Company, Sealy Corporation, the Guarantors named therein and The Bank of New York Mellon Trust Company, N.A., as Trustee and Collateral Agent, with respect to 8% Senior Secured Third Lien Convertible Notes due 2016 (incorporated herein by reference to Exhibit 4.4 of the Registrant’s Current Report on Form 8-K as filed on March 18, 2013). (1) |
4.8 | Third Supplemental Indenture, dated as of March 18, 2013, by and among Sealy Mattress Company, Sealy Corporation, the Guarantors named therein and The Bank of New York Mellon Trust Company, N.A., as Trustee and Collateral Agent, with respect to 8% Senior Secured Third Lien Convertible Notes due 2016 (incorporated herein by reference to Exhibit 4.5 to the Registrant’s Current Report on Form 8-K as filed on March 18, 2013). (1) |
4.9 | Indenture, dated as of September 24, 2015, among Tempur Sealy International, Inc., the Guarantors party thereto and The Bank of New York Mellon Trust Company, N.A., as Trustee (filed as Exhibit 4.1 to the Registrant’s Current Report on Form 8-K as filed on September 24, 2015). (1) |
4.10 | Registration Rights Agreement, dated as of September 24, 2015, by and among Tempur Sealy International, Inc., the Guarantors named therein and Merrill Lynch, Pierce, Fenner &Smith Incorporated, as representative of the several Initial Purchasers named therein (filed as Exhibit 4.2 to the Registrant’s Current Report on Form 8-K as filed on September 24, 2015). (1) |
4.11 | Indenture, dated as of May 24, 2016, among Tempur Sealy International, Inc., the Guarantors party thereto and The Bank of New York Mellon Trust Company, N.A., as Trustee (filed as Exhibit 4.1 to the Registrant’s Current Report on Form 8-K filed on May 24, 2016). (1) |
4.12 | Registration Rights Agreement, dated as of May 24, 2016, by and among Tempur Sealy International, Inc., the Guarantors named therein and J.P. Morgan Securities LLC, as representative of the several Initial Purchasers named therein (filed as Exhibit 4.2 to the Registrant’s Current Report on Form 8-K as filed on May 24, 2016). (1) |
10.1 | Credit Agreement dated as of December 12, 2012 (filed as Exhibit 10.1 to the Registrant’s Current Report on Form 8-K as filed on December 12, 2012). (1) |
10.2 | Amendment No. 1, dated as of March 13, 2013, to that certain Credit Agreement, dated as of December 12, 2012 (filed as Exhibit 10.6 to Amendment No. 1 to the Registrant’s registration statement on Form S-4 (File No. 333-189063) as filed on July 12, 2013). (1) |
10.3 | Amendment No. 2, dated as of May 16, 2013, to that certain Credit Agreement, dated as of December 12, 2012 (filed as Exhibit 10.7 to Amendment No. 1 to the Registrant’s registration statement on Form S-4 (File No. 333-189063) as filed on July 12, 2013). (1) |
10.4 | Amendment No. 3, dated as of July 11, 2013, to that certain Credit Agreement, dated as of December 12, 2012, as amended (filed as Exhibit 10.1 to Registrant’s Current Report on Form 8-K as filed on July 12, 2013). (1) |
10.5 | Amendment No. 4, dated as of October 17, 2014, to that certain Credit Agreement, dated as of December 12, 2012, as amended (filed as Exhibit 10.1 to Registrant’s Current Report on Form 8-K as filed on October 17, 2014). (1) |
10.6 | Amendment No. 5, dated September 24, 2015, to that certain Credit Agreement dated as of December 12, 2012, as amended (filed as Exhibit 10.2 to the Registrant’s Current Report on Form 8-K as filed on September 24, 2015). (1) |
10.7 | Purchase Agreement, dated September 21, 2015, among Tempur Sealy International, Inc., the Guarantors named therein, and Merrill Lynch, Pierce, Fenner & Smith Incorporated, as representative of the Initial Purchasers named therein (filed as Exhibit 10.1 to the Registrant’s Current Report on Form 8-K as filed on September 24, 2015). (1) |
10.8 | Credit Agreement, dated as of April 6, 2016, by and among Tempur Sealy International, Inc., as parent borrower, the several banks and other financial institutions party thereto, and JPMorgan Chase Bank, N.A., as administrative agent (filed as Exhibit 10.1 to the Registrant’s Current Report on Form 8-K filed on April 7, 2016).(1) |
10.9 | Purchase Agreement dated May 19, 2016, among Tempur Sealy International, Inc., the Guarantors named therein and JP Morgan Securities LLC, as representative of the Initial Purchasers named therein (filed as Exhibit 10.1 to the Registrant’s Current Report on Form 8-K filed on May 24, 2016).(1) |
10.10 | Bond Purchase Agreement, dated October 26, 2005, by and among Tempur World LLC, Tempur Production USA, Inc. and Bernalillo County (filed as Exhibit 10.5 to the Registrant’s Annual Report on Form 10-K as filed on March 14, 2006). (1) |
10.11 | Trust Indenture, dated September 1, 2005, by and between Bernalillo County and The Bank of New York Trust Company, N.A., as Trustee (filed as Exhibit 10.2 to the Registrant’s Annual Report on Form 10-K as filed on March 14, 2006). (1) |
10.12 | Mortgage, Assignment, Security Agreement and Fixture Filing, dated as of October 27, 2005, by and between Bernalillo County and Tempur Production USA, Inc. (filed as Exhibit 10.7 to the Registrant’s Annual Report on Form 10-K as filed on March 14, 2006). (1) |
10.13 | Lease Agreement, dated September 1, 2005, by and between Bernalillo County and Tempur Production USA, Inc. (filed as Exhibit 10.3 to the Registrant’s Annual Report on Form 10-K as filed on March 14, 2006). (1) |
10.14 | Agreement by and among H Partners, other members of the H Partners Group and the Company, dated as of May 11, 2015 (filed as Exhibit 10.1 to the Registrant’s Current Report on Form 8-K as filed on May 13, 2015. (1) |
10.15 | Non-Employee Director Deferred Compensation Plan (filed as Exhibit 10.1 to the Registrant’s Quarterly Report on Form 10-Q as filed on July 28, 2010). (1)(2) |
10.16 | Tempur Sealy International, Inc. Amended and Restated Non-Employee Director Deferred Compensation Plan, which includes as Exhibit A the Form of Acknowledgement and Award Agreement and as Exhibit B the Election Form under such Plan (filed as Exhibit 10.2 to the Registrant’s Quarterly Report on Form 10-Q as filed on November 8, 2013). (1)(2) |
10.17 | Form of Stock Option Agreement under the Tempur Sealy International, Inc. 2013 Equity Incentive Plan (Director) (filed as Exhibit 10.3 to the Registrant’s Quarterly Report on Form 10-Q as filed on November 8, 2013). (1)(2) |
10.18 | Tempur Sealy International, Inc. 2013 Long-Term Incentive Plan (filed as Exhibit 10.1 to Registrant’s Current Report on Form 8-K as filed on October 23, 2013) (1)(2) |
10.19 | Tempur Sealy International, Inc. Severance and Retention Plan (filed as Exhibit 10.2 to Registrant’s Current Report on Form 8-K as filed on October 23, 2013). (1) (2) |
106
10.20 | Amended and Restated Tempur-Pedic International Inc. 2003 Equity Incentive Plan (filed as Appendix B to the Registrant’s Definitive Proxy Statement on Schedule 14A (File No. 001-31922) as filed on March 25, 2009). (1) (2) |
10.21 | First Amendment to the Amended and Restated 2003 Equity Incentive Plan (filed as Appendix A to the Registrant’s Registration Proxy Statement on Schedule 14A (File No. 001-31922) as filed on March 25, 2009). (1)(2) |
10.22 | Tempur-Pedic International Inc. 2013 Equity Incentive Plan (filed as Appendix A to the Registrant’s Definitive Proxy Statement on Schedule 14A (File No. 001-31922) as filed on April 12, 2013). (1)(2) |
10.23 | Amendment to 2013 Equity Incentive Plan. (1) (2) |
10.24 | Tempur Sealy International, Inc. 2013 Long-Term Equity Incentive Plan (filed as Exhibit 10.1 to the Registrant’s Current Report on Form 8-K filed on October 23, 2013). (1) (2) |
10.25 | Second Amended and Restated Annual Incentive Bonus Plan for Senior Executives (filed as Appendix B to the Registrant’s Definitive Proxy Statement (File No.001-31922) filed on March 16, 2015).(1) (2) |
10.26 | Employment Agreement dated September 12, 2003, between Tempur International Limited and David Montgomery (filed as Exhibit 10.13 to Amendment No. 1 to the Registrant’s registration statement on Form S-4 ((File No. 333-109054-02) as filed on October 31, 2003). (1)(2) |
10.27 | Employment Agreement dated as of July 18, 2006 between Tempur-Pedic International Inc. and Richard Anderson (filed as Exhibit 10.1 to Registrant’s Quarterly Report on Form 10-Q as filed November 7, 2006). (1)(2) |
10.28 | Amended and Restated Employment Agreement dated March 5, 2008 by and among Tempur-Pedic International Inc., Tempur World, LLC and Dale E. Williams (filed as Exhibit 10.1 to Registrant’s Current Report on Form 8-K as filed March 7, 2008). (1)(2) |
10.29 | Amendment to the Amended and Restated Employment and Non-Competition Agreement of Dale Williams dated as of July 30, 2015 (filed as Exhibit 10.1 to Registrant’s Current Report on Form 8-K as filed July 30, 2015). (1)(2) |
10.30 | Employment and Noncompetition Agreement dated as June 30, 2008, between Tempur-Pedic International Inc. and Mark Sarvary (filed as Exhibit 10.1 to Registrant’s Current Report on Form 8-K as filed on June 30, 2008). (1)(2) |
10.31 | First Amendment to the Employment and Non-Competition Agreement, by and between the Company and Mark Sarvary, dated as of May 22, 2015 (filed as Exhibit 10.1 to the Registrant’s Current Report on Form 8-K as filed on June 1, 2015).(1) (2) |
10.32 | Employment and Noncompetition Agreement dated as of February 4, 2013, between Tempur-Pedic International Inc. and W. Timothy Yaggi (filed as Exhibit 10.1 to the Registrant’s Current Report on Form 8-K as filed on February 4, 2013).(1) (2) |
10.33 | First Amendment to Employment and Non-Competition Agreement dated March 10, 2016 between W. Timothy Yaggi and Tempur Sealy International, Inc. (filed as Exhibit 10.1 to the Registrant’s Current Report on Form 8-K filed on March 10, 2016). (1) (2) |
10.34 | Letter agreement, dated as of March 10, 2016, between W. Timothy Yaggi and the Company (filed as Exhibit 10.2 to the Registrant’s Current Report on Form 8-K filed on March 10 2016). (1) (2) |
10.35 | Amended and Restated Employment and Non-Competition Agreement of Barry Hytinen dated as of July 30, 2015 (filed as Exhibit 10.2 to Registrant’s Current Report on Form 8-K as filed July 30, 2015). (1) (2) |
10.36 | Employment and Noncompetition Agreement dated as of November 18, 2014, between Tempur Sealy International, Inc. and Jay Spenchian. (2) |
10.37 | First Amendment to Employment and Non-Competition Agreement dated February 15, 2016 between Jay Spenchian and Tempur Sealy International, Inc. (filed as Exhibit 10.1 to the Registrant’s Current Report on Form 8-K filed on February 17, 2017). (1) (2) |
10.38 | Letter agreement, dated as of February 15, 2017, between Jay Spenchian and the Company (filed as Exhibit 10.2 to the Registrant’s Current Report on Form 8-K filed on February 17, 2017). (1) (2) |
10.39 | Employment and Non-Competition Agreement of Scott Thompson dated as of September 4, 2015 (filed as Exhibit 10.1 to Registrant’s Current Report on Form 8-K as filed September 8, 2015). (1)(2) |
10.40 | Stock Option Agreement dated as of September 4, between the Company and Scott Thompson (filed as Exhibit 10.2 to Registrant’s Current Report on Form 8-K as filed September 8, 2015). (1)(2) |
10.41 | Restricted Stock Unit Award Agreement dated as of September 4, between the Company and Scott Thompson (filed as Exhibit 10.3 to Registrant’s Current Report on Form 8-K as filed September 8, 2015). (1)(2) |
10.42 | Matching Performance Restricted Stock Unit Award Agreement dated as of September 4, between the Company and Scott Thompson (filed as Exhibit 10.4 to Registrant’s Current Report on Form 8-K as filed September 8, 2015). (1)(2) |
10.43 | 2015 Performance Restricted Stock Unit Award Agreement (dated as of September 4, between the Company and Scott Thompson (filed as Exhibit 10.5 to Registrant’s Current Report on Form 8-K as filed September 8, 2015). (1)(2) |
10.44 | Subscription Agreement (dated as of September 4, between the Company and Scott Thompson (filed as Exhibit 10.6 to Registrant’s Current Report on Form 8-K as filed September 8, 2015). (1)(2) |
10.45 | Amendment to Matching Performance Restricted Stock Unit Award Agreement dated as of October 12, 2015, between the Company and Scott Thompson (filed as Exhibit 10.1 to Registrant’s Current Report on Form 8-K as filed October 14, 2015). (1)(2) |
10.46 | Form of 2015 Performance Restricted Stock Unit Award Agreement (filed as Exhibit 10.2 to Registrant’s Current Report on Form 8-K as filed October 29, 2015). (1)(2) |
10.47 | Form of Stock Option Agreement under the 2003 Equity Incentive Plan (filed as Exhibit 10.9 to Registrant’s Quarterly Report on Form 10-Q as filed August 8, 2006). (1)(2) |
10.48 | Form of Stock Option Agreement under the Amended and Restated 2003 Equity Incentive Plan (Executive) (filed as Exhibit 9.1 to Registrant’s Current Report on Form 8-K as filed on May 19, 2008). (1)(2) |
10.49 | Form of Stock Option Agreement under the Amended and Restated 2003 Equity Incentive Plan (Director) (filed as Exhibit 10.40 to Registrant’s Annual Report on Form 10-K as filed on February 12, 2009). (1)(2) |
107
10.50 | Form of Stock Option Agreement under the 2013 Equity Incentive Plan (Executive). (2) |
10.51 | Form of Performance Restricted Stock Unit Award Agreement under the 2013 Equity Incentive Plan (Executive). (2) |
10.52 | Form of Stock Option Agreement under the United Kingdom Approved Share Option Sub Plan to the 2003 Equity Incentive Plan (filed as Exhibit 10.1 to Registrant’s Quarterly Report on Form 10-Q as filed on April 30, 2009). (1)(2) |
10.53 | Form of Performance Restricted Stock Unit Award Agreement under the Amended and Restated 2003 Equity Incentive Plan (filed as Exhibit 10.2 to the Registrant’s Current Report on Form 8-K as filed on February 19, 2010). (1)(2) |
10.54 | Form of Stock Option Agreement under Amended and Restated 2003 Equity Incentive Plan (Executive) (filed as Exhibit 10.4 to the Registrant’s Current Report on Form 8-K as filed on February 19, 2010). (1)(2) |
10.55 | Form of Stock Option Agreement under the Amended and Restated 2003 Equity Incentive Plan (Director) (filed as Exhibit 10.2 to Registrant’s Quarterly Report on Form 10-Q as filed on July 28, 2010). (1)(2) |
10.56 | Form of Stock Option Agreement under the 2013 Equity Incentive Plan (Director) (filed as Exhibit 10.3 to Registrant’s Quarterly Report on Form 10-Q as filed on November 8, 2013). (1)(2) |
10.57 | Form of Stock Option Agreement under the 2013 Equity Incentive Plan (Executive, Special Grant). (2) |
10.58 | Form of Restricted Stock Unit Award Agreement under the 2013 Equity Incentive Plan (Executive, Annual Grant). (2) |
10.59 | Form of Matching PRSU Award Agreement under the 2013 Equity Incentive Plan (filed as Exhibit 99.1 to the Registrant’s Current Report on Form 8-K filed on February 26, 2017). (1) (2) |
10.60 | Amended and Restated Sealy Benefit Equalization Plan dated December 18, 2008 (filed as Exhibit 10.44 to Sealy Corporation's Annual Report on Form 10-K as filed on January 15, 2009). (1) (2) |
10.61 | Form of Letter Agreement Outlining Retention Program for United States Executive Officers (filed as Exhibit 10.3 to the Registrant’s Current Report on Form 8-K as filed on June 1, 2015).(1) (2) |
10.62 | Form of Letter Agreement Outlining Retention Program for non-United States Executive Officer (filed as Exhibit 10.4 to the Registrant’s Current Report on Form 8-K as filed on June 1, 2015).(1) (2) |
21.1 | Subsidiaries of Tempur Sealy International, Inc. |
23.1 | Consent of Ernst & Young LLP. |
31.1 | Certification of Chief Executive Officer, pursuant to Securities Exchange Act Rules 13a-14(a) and 15d-14(a), as adopted pursuant to Section 302 of the Sarbanes Oxley Act of 2002. |
31.2 | Certification of Chief Financial Officer, pursuant to Securities Exchange Act Rules 13a-14(a) and 15d-14(a), as adopted pursuant to Section 302 of the Sarbanes Oxley Act of 2002. |
32.1 | Certification of Chief Executive Officer and Chief Financial Officer, pursuant to 18 U.S.C. Section 1350, as adopted pursuant to Section 906 of the Sarbanes Oxley Act of 2002. (3) |
101 | The following materials from Tempur Sealy International Inc.'s Annual Report on Form 10-K for the year ended December 31, 2016, formatted in XBRL (Extensible Business Reporting Language): (i) the Consolidated Statements of Income, (ii) the Consolidated Balance Sheets, (iii) the Consolidated Statements of Stockholders' Equity, (iv) the Consolidated Statements of Cash Flows, and (v) the Notes to the Consolidated Financial Statements, tagged as blocks of text. |
(1) | Incorporated by reference. |
(2) | Indicates management contract or compensatory plan or arrangement. |
(3) | This exhibit shall not be deemed “filed” for purposes of Section 18 of the Securities Exchange Act of 1934 or otherwise subject to the liabilities of that Section, nor shall it be deemed incorporated by reference in any filings under the Securities Act of 1933 or the Securities Exchange Act of 1934, whether made before or after the date hereof and irrespective of any general incorporation language in any filings. |
108
TEMPUR SEALY INTERNATIONAL, INC. AND SUBSIDIARIES
VALUATION AND QUALIFYING ACCOUNTS
FOR THE YEARS ENDED DECEMBER 31, 2016, 2015 AND 2014
SCHEDULE II
(in millions)
Additions | |||||||||||||||||
Description | Balance at Beginning of Period | Charges to Costs and Expenses | Charged to Other Accounts | Deductions | Balance at End of Period | ||||||||||||
Allowance for doubtful accounts: | |||||||||||||||||
Year Ended December 31, 2014 | $ | 19.3 | 4.9 | — | (4.7 | ) | $ | 19.5 | |||||||||
Year Ended December 31, 2015 | $ | 19.5 | 6.9 | — | (3.1 | ) | $ | 23.3 | |||||||||
Year Ended December 31, 2016 | $ | 23.3 | 4.2 | — | (5.4 | ) | $ | 22.1 | |||||||||
Additions | |||||||||||||||||
Description | Balance at Beginning of Period | Charges to Costs and Expenses | Charged to Other Accounts | Deductions | Balance at End of Period | ||||||||||||
Valuation allowance for deferred tax assets: | |||||||||||||||||
Year Ended December 31, 2014 | $ | 39.4 | 2.2 | — | (19.9 | ) | $ | 21.7 | |||||||||
Year Ended December 31, 2015 | $ | 21.7 | 4.6 | — | (2.1 | ) | $ | 24.2 | |||||||||
Year Ended December 31, 2016 | $ | 24.2 | 20.2 | 0.8 | — | $ | 45.2 | ||||||||||
ITEM 16. FORM 10-K SUMMARY
None.
109
SIGNATURES
Pursuant to the requirements of Section 13 or 15(d) of the Securities Exchange Act of 1934, the registrant has duly caused this Report to be signed on its behalf by the undersigned thereunto duly authorized.
TEMPUR SEALY INTERNATIONAL, INC. (Registrant) | ||||
Date: February 24, 2017 | By: | /S/ Scott L. Thompson | ||
Scott L. Thompson Chairman, President and Chief Executive Officer | ||||
110
Pursuant to the requirements of the Securities Exchange Act of 1934, this Report has been signed below by the following persons on the 24th of February, 2017, on behalf of the registrant and in the capacities indicated.
Signature | Capacity | |
/S/ SCOTT L. THOMPSON | Chairman, President and Chief Executive Officer (Principal Executive Officer) | |
Scott L. Thompson | ||
/S/ BARRY A. HYTINEN | Executive Vice President and Chief Financial Officer (Principal Financial Officer) | |
Barry A. Hytinen | ||
/S/ BHASKAR RAO | Chief Accounting Officer and Senior Vice President Finance (Principal Accounting Officer) | |
Bhaskar Rao | ||
/S/ EVELYN S. DILSAVER | Director | |
Evelyn S. Dilsaver | ||
/S/ JOHN A. HEIL | Director | |
John A. Heil | ||
/S/ JON L. LUTHER | Director | |
Jon L. Luther | ||
/S/ USMAN NABI | Director | |
Usman Nabi | ||
/S/ RICHARD W. NEU | Director | |
Richard W. Neu | ||
/S/ ROBERT B. TRUSSELL, JR. | Director | |
Robert B. Trussell, Jr. | ||
111