Attached files
| file | filename |
|---|---|
| 8-K - 8-K - Dine Brands Global, Inc. | a13-6619_18k.htm |
Exhibit 99.1
|
|
Investor Presentation March 2013 |
|
|
Statements contained in this presentation may constitute forward-looking statements within the meaning of the Private Securities Litigation Reform Act of 1995. You can identify these forward-looking statements by words such as "may," "will," "should," "expect," "anticipate," "believe," "estimate," "intend," "plan" and other similar expressions. These statements involve known and unknown risks, uncertainties and other factors, which may cause actual results to be materially different from those expressed or implied in such statements. These factors include, but are not limited to: the effect of general economic conditions; the Company's indebtedness; risk of future impairment charges; trading volatility and the price of the Company’s common stock; the Company's results in any given period differing from guidance provided to the public; the highly competitive nature of the restaurant business; the Company's business strategy failing to achieve anticipated results; risks associated with the restaurant industry; risks associated with locations of current and future restaurants; rising costs for food commodities and utilities; shortages or interruptions in the supply or delivery of food; ineffective marketing and guest relationship initiatives and use of social media; changing health or dietary preferences; our engagement in business in foreign markets; harm to our brands' reputation; litigation; third-party claims with respect to intellectual property assets; environmental liability; liability relating to employees; failure to comply with applicable laws and regulations; failure to effectively implement restaurant development plans; our dependence upon our franchisees; concentration of Applebee's franchised restaurants in a limited number of franchisees; credit risk from IHOP franchisees operating under our previous business model; termination or non-renewal of franchise agreements; franchisees breaching their franchise agreements; insolvency proceedings involving franchisees; changes in the number and quality of franchisees; inability of franchisees to fund capital expenditures; heavy dependence on information technology; the occurrence of cyber incidents or a deficiency in our cybersecurity; failure to execute on a business continuity plan; inability to attract and retain talented employees; risks associated with retail brand initiatives; failure of our internal controls; and other factors discussed from time to time in the Company's Annual and Quarterly Reports on Forms 10-K and 10-Q and in the Company's other filings with the Securities and Exchange Commission. The forward-looking statements contained in this release are made as of the date hereof and the Company assumes no obligation to update or supplement any forward-looking statements. 2 Forward-Looking Information |
|
|
This presentation may include references to the Company's non-GAAP financial measures "adjusted net income available to common stockholders (adjusted EPS)," "EBITDA," "free cash flow," and "segment EBITDA." "Adjusted EPS" is computed for a given period by deducting from net income (loss) available to common stockholders for such period the effect of any impairment and closure charges, any gain or loss related to debt extinguishment, any intangible asset amortization, any non-cash interest expense, any debt modification costs, any one-time litigation settlement charges, any general and administrative restructuring costs, net of savings, any gain or loss related to the disposition of assets, and any state income tax impact of deferred taxes due to refranchising incurred in such period. This is presented on an aggregate basis and a per share (diluted) basis. The Company defines "EBITDA" for a given period as income before income taxes less interest expense, loss on retirement of debt, depreciation and amortization, impairment and closure charges, non-cash stock-based compensation, gain/loss on disposition of assets and other charge backs as defined by its credit agreement. "Free cash flow" for a given period is defined as cash provided by operating activities, plus principal receipts from notes and equipment contracts receivable ("long-term receivables"), less principal payments on capital leases and financing obligations, less capital expenditures and less a mandatory annual 1% repayment on the outstanding Term Loan principal balance. "Segment EBITDA" for a given period is defined as gross segment profit plus depreciation and amortization as well as interest charges related to the segment. Management utilizes EBITDA for debt covenant purposes and free cash flow to determine the amount of cash remaining for general corporate and strategic purposes after the receipts from long-term receivables, and the funding of operating activities, capital expenditures and preferred dividends. Management believes this information is helpful to investors to determine the Company's adherence to debt covenants and the Company's cash available for these purposes. Adjusted EPS, EBITDA, free cash flow and segment EBITDA are supplemental non-GAAP financial measures and should not be considered in isolation or as a substitute for measures of performance prepared in accordance with United States generally accepted accounting principles. 3 Non-GAAP Financial Measures |
|
|
At 99% franchised, we are unique in the full-service restaurant segment DineEquity is one of the largest full-service restaurant companies in the world We have two strong brands: each #1 in their respective categories for 5 consecutive years through fiscal 2011 based on U.S. system-wide sales* Non-capital intensive, free cash flow generating model Significant return of cash to shareholders just launched Reduced total debt by over $1 billion since Applebee’s was acquired in 2007 Prudent management of G&A Comprehensive restructuring implemented to generate annualized G&A savings of $10 million to $12 million Leveraging Shared Services and Centers of Excellence 4 DineEquity Investment Thesis Highlights * Source: Nation's Restaurant News, "Top 100," June 25, 2012 (Applebee’s rank based on U.S. system-wide sales in the “casual” dining category; IHOP rank based on U.S. system-wide sales in the “family” dining category) |
|
|
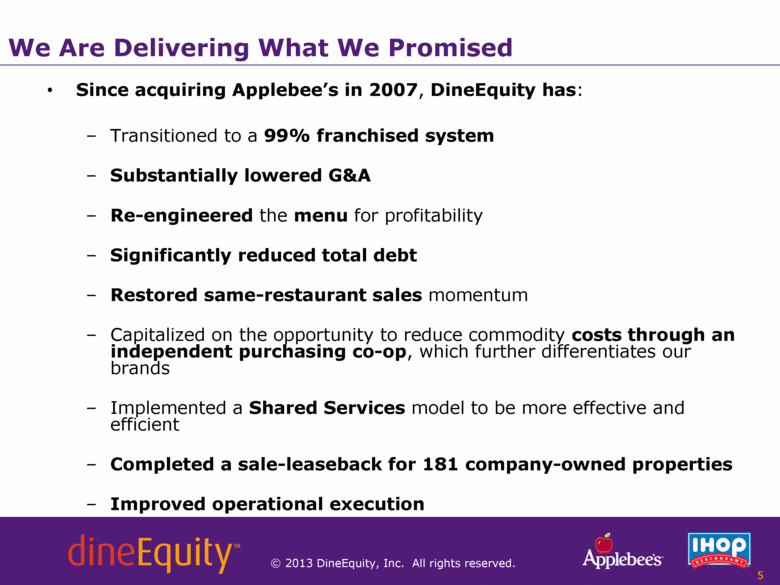
Since acquiring Applebee’s in 2007, DineEquity has: Transitioned to a 99% franchised system Substantially lowered G&A Re-engineered the menu for profitability Significantly reduced total debt Restored same-restaurant sales momentum Capitalized on the opportunity to reduce commodity costs through an independent purchasing co-op, which further differentiates our brands Implemented a Shared Services model to be more effective and efficient Completed a sale-leaseback for 181 company-owned properties Improved operational execution 5 We Are Delivering What We Promised |
|
|
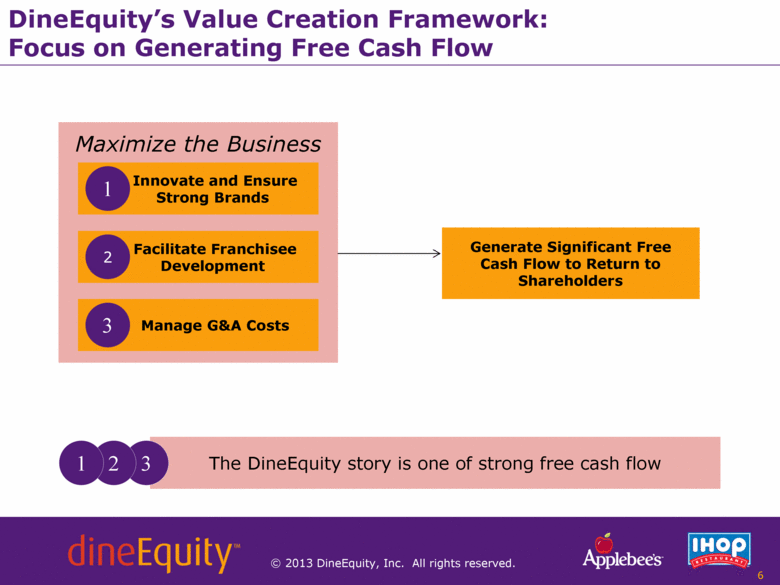
The DineEquity story is one of strong free cash flow 3 2 Maximize the Business Innovate and Ensure Strong Brands Manage G&A Costs 1 Facilitate Franchisee Development 2 3 Generate Significant Free Cash Flow to Return to Shareholders 1 6 DineEquity’s Value Creation Framework: Focus on Generating Free Cash Flow |
|
|
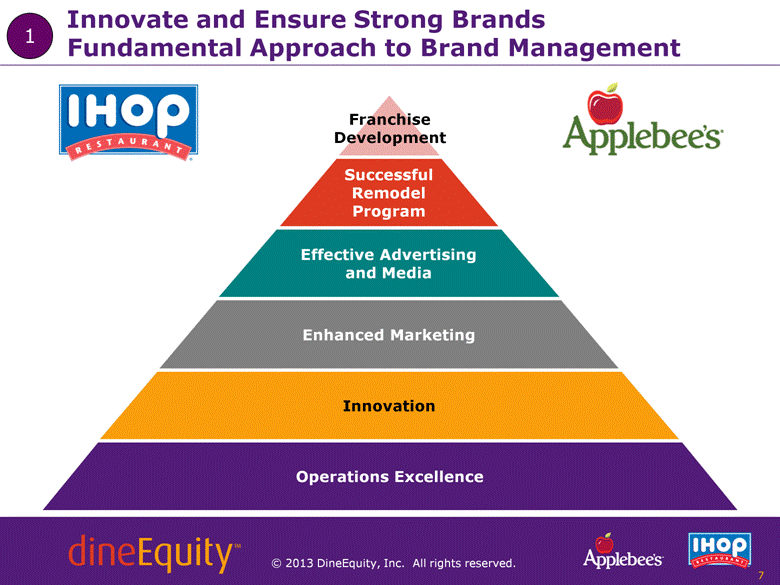
7 Fundamental Approach to Brand Management Innovate and Ensure Strong Brands 1 Innovation Effective Advertising and Media Enhanced Marketing Successful Remodel Program Operations Excellence Franchise Development |
|
|
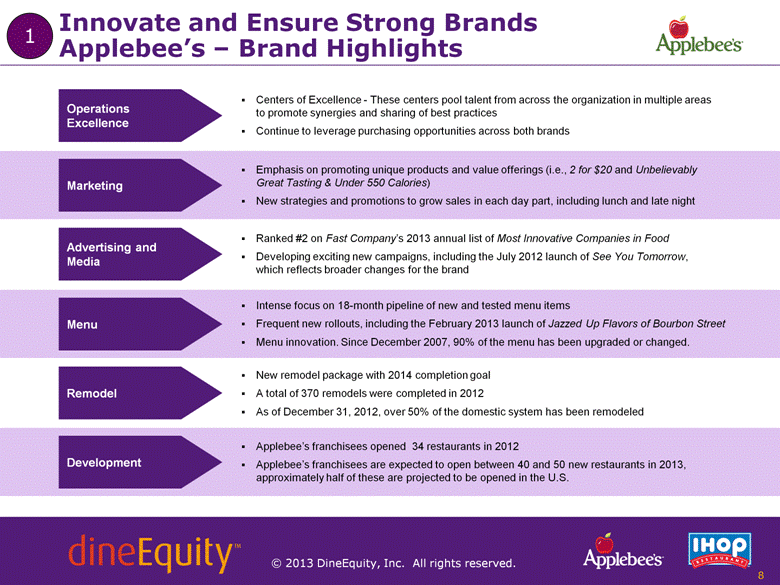
Innovate and Ensure Strong Brands Applebee’s – Brand Highlights Operations Excellence Centers of Excellence - These centers pool talent from across the organization in multiple areas to promote synergies and sharing of best practices Continue to leverage purchasing opportunities across both brands Marketing Emphasis on promoting unique products and value offerings (i.e., 2 for $20 and Unbelievably Great Tasting & Under 550 Calories) New strategies and promotions to grow sales in each day part, including lunch and late night Advertising and Media Ranked #2 on Fast Company’s 2013 annual list of Most Innovative Companies in Food Developing exciting new campaigns, including the July 2012 launch of See You Tomorrow, which reflects broader changes for the brand Menu Intense focus on 18-month pipeline of new and tested menu items Frequent new rollouts, including the February 2013 launch of Jazzed Up Flavors of Bourbon Street Menu innovation. Since December 2007, 90% of the menu has been upgraded or changed. Remodel Development Applebee’s franchisees opened 34 restaurants in 2012 Applebee’s franchisees are expected to open between 40 and 50 new restaurants in 2013, approximately half of these are projected to be opened in the U.S. New remodel package with 2014 completion goal A total of 370 remodels were completed in 2012 As of December 31, 2012, over 50% of the domestic system has been remodeled 1 8 |
|
|
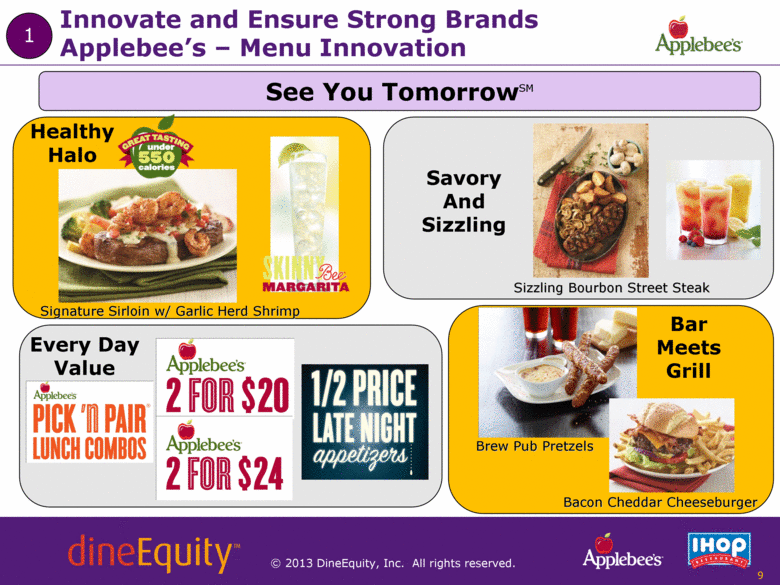
Every Day Value Bar Meets Grill Bacon Cheddar Cheeseburger Sizzling Bourbon Street Steak Brew Pub Pretzels Signature Sirloin w/ Garlic Herd Shrimp Applebee’s – Menu Innovation Innovate and Ensure Strong Brands 1 Savory And Sizzling See You TomorrowSM Healthy Halo 9 |
|
|
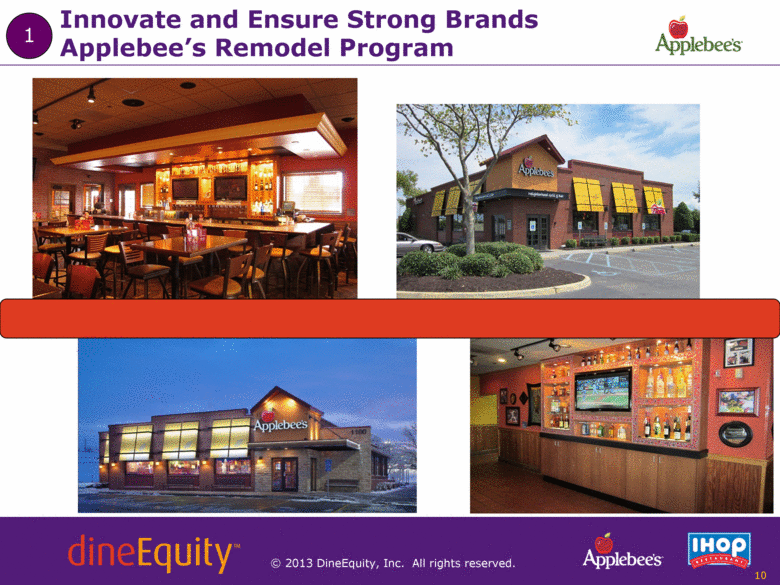
Innovate and Ensure Strong Brands 10 Applebee’s Remodel Program 1 |
|
|
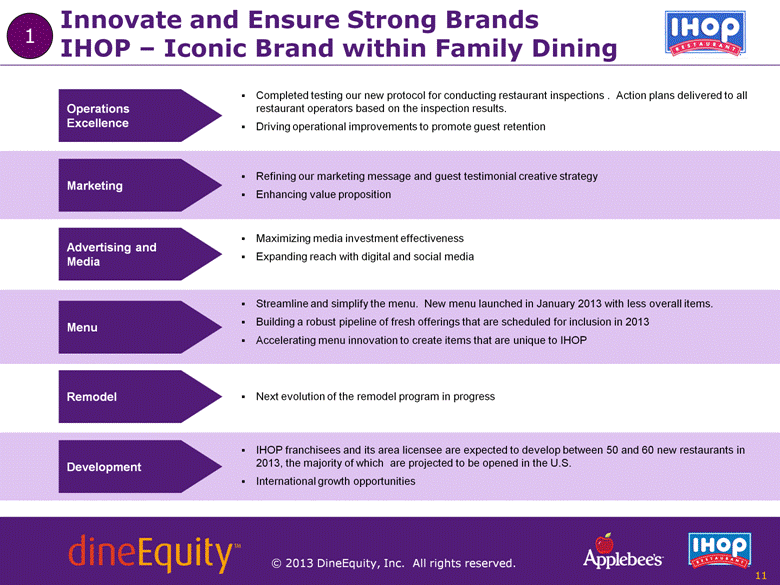
Operations Excellence Completed testing our new protocol for conducting restaurant inspections . Action plans delivered to all restaurant operators based on the inspection results. Driving operational improvements to promote guest retention Marketing Refining our marketing message and guest testimonial creative strategy Enhancing value proposition Advertising and Media Maximizing media investment effectiveness Expanding reach with digital and social media Menu Streamline and simplify the menu. New menu launched in January 2013 with less overall items. Building a robust pipeline of fresh offerings that are scheduled for inclusion in 2013 Accelerating menu innovation to create items that are unique to IHOP Remodel Development IHOP franchisees and its area licensee are expected to develop between 50 and 60 new restaurants in 2013, the majority of which are projected to be opened in the U.S. International growth opportunities Next evolution of the remodel program in progress 1 11 Innovate and Ensure Strong Brands IHOP – Iconic Brand within Family Dining |
|
|
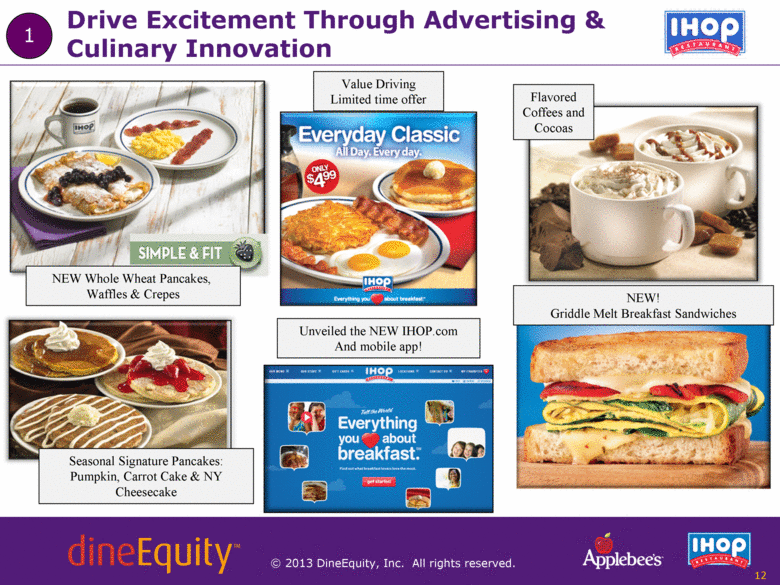
Drive Excitement Through Advertising & Culinary Innovation 12 Value Driving Limited time offer Unveiled the NEW IHOP.com And mobile app! NEW! Griddle Melt Breakfast Sandwiches 1 Seasonal Signature Pancakes: Pumpkin, Carrot Cake & NY Cheesecake Flavored Coffees and Cocoas NEW Whole Wheat Pancakes, Waffles & Crepes |
|
|
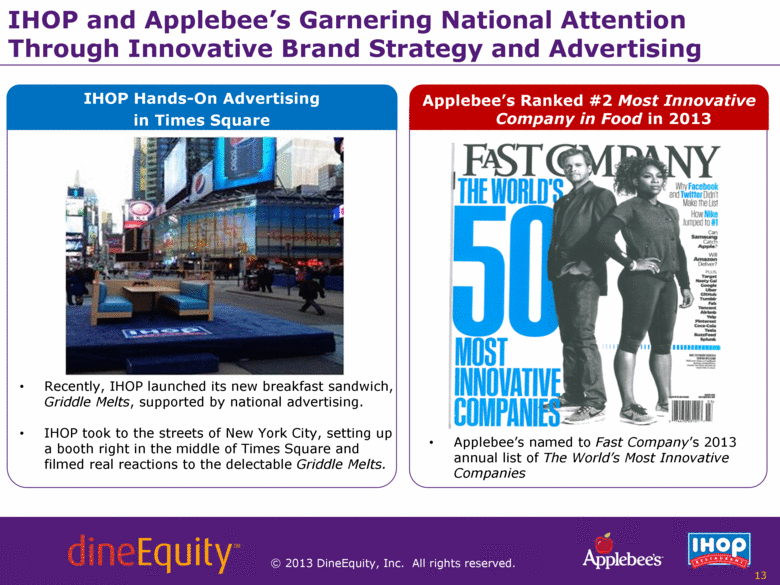
IHOP and Applebee’s Garnering National Attention Through Innovative Brand Strategy and Advertising 13 IHOP Hands-On Advertising in Times Square Applebee’s Ranked #2 Most Innovative Company in Food in 2013 Recently, IHOP launched its new breakfast sandwich, Griddle Melts, supported by national advertising. IHOP took to the streets of New York City, setting up a booth right in the middle of Times Square and filmed real reactions to the delectable Griddle Melts. Applebee’s named to Fast Company’s 2013 annual list of The World’s Most Innovative Companies |
|
|
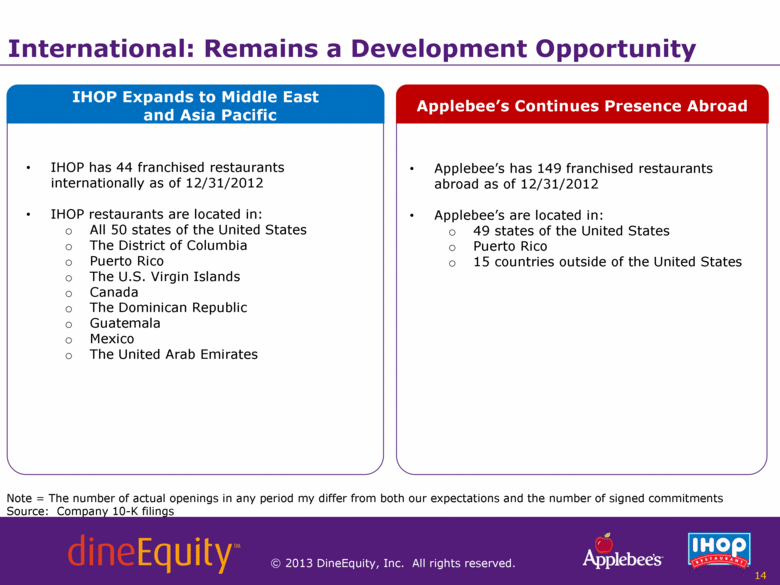
International: Remains a Development Opportunity Note = The number of actual openings in any period my differ from both our expectations and the number of signed commitments Source: Company 10-K filings 14 IHOP Expands to Middle East and Asia Pacific Applebee’s Continues Presence Abroad Applebee’s has 149 franchised restaurants abroad as of 12/31/2012 Applebee’s are located in: 49 states of the United States Puerto Rico 15 countries outside of the United States IHOP has 44 franchised restaurants internationally as of 12/31/2012 IHOP restaurants are located in: All 50 states of the United States The District of Columbia Puerto Rico The U.S. Virgin Islands Canada The Dominican Republic Guatemala Mexico The United Arab Emirates |
|
|
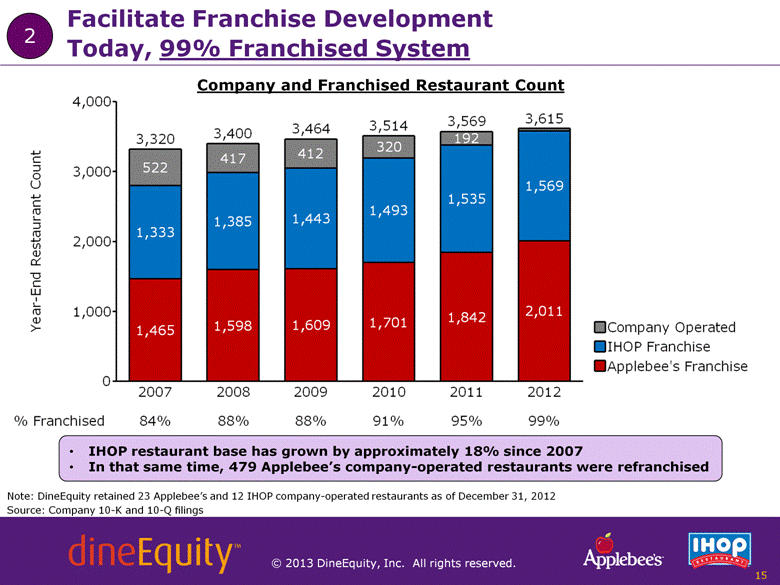
15 Source: Company 10-K and 10-Q filings Company and Franchised Restaurant Count Note: DineEquity retained 23 Applebee’s and 12 IHOP company-operated restaurants as of December 31, 2012 IHOP restaurant base has grown by approximately 18% since 2007 In that same time, 479 Applebee’s company-operated restaurants were refranchised Facilitate Franchise Development Today, 99% Franchised System 2 0 1,000 2,000 3,000 4,000 2007 522 1,333 1,465 3,320 2008 417 1,385 1,598 3,400 2009 412 1,443 1,609 3,464 2010 320 1,493 1,701 3,514 2011 192 1,535 1,842 3,569 2012 1,569 2,011 3,615 Year-End Restaurant Count 84% 88% 88% 91% 95% 99% % Franchised Applebee's Franchise IHOP Franchise Company Operated |
|
|
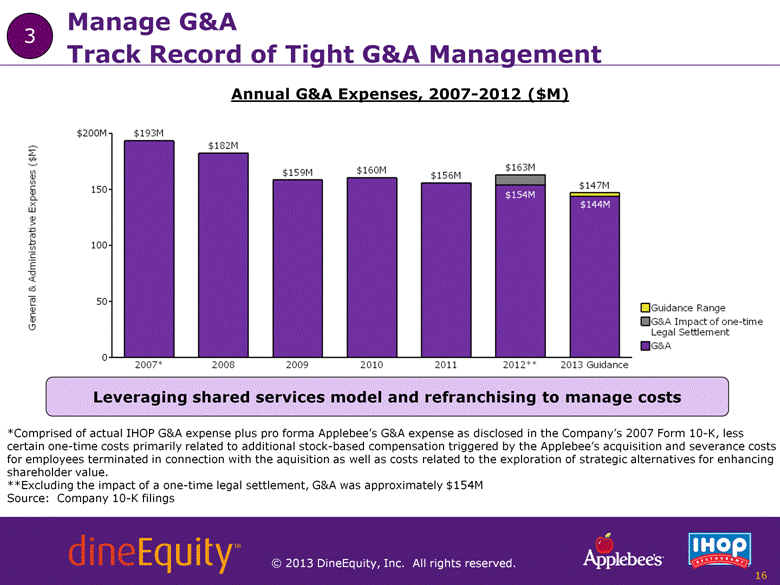
Track Record of Tight G&A Management Annual G&A Expenses, 2007-2012 ($M) *Comprised of actual IHOP G&A expense plus pro forma Applebee’s G&A expense as disclosed in the Company’s 2007 Form 10-K, less certain one-time costs primarily related to additional stock-based compensation triggered by the Applebee’s acquisition and severance costs for employees terminated in connection with the aquisition as well as costs related to the exploration of strategic alternatives for enhancing shareholder value. **Excluding the impact of a one-time legal settlement, G&A was approximately $154M Source: Company 10-K filings Manage G&A 3 Leveraging shared services model and refranchising to manage costs 16 0 50 100 150 $200M 0 50 100 150 $200M 2007* $193M 2008 $182M 2009 $159M 2010 $160M 2011 $156M 2012** $163M 2013 Guidance $147M General & Administrative Expenses ( $ M ) $154M $144M G&A G&A Impact of one-time Legal Settlement Guidance Range |
|
|
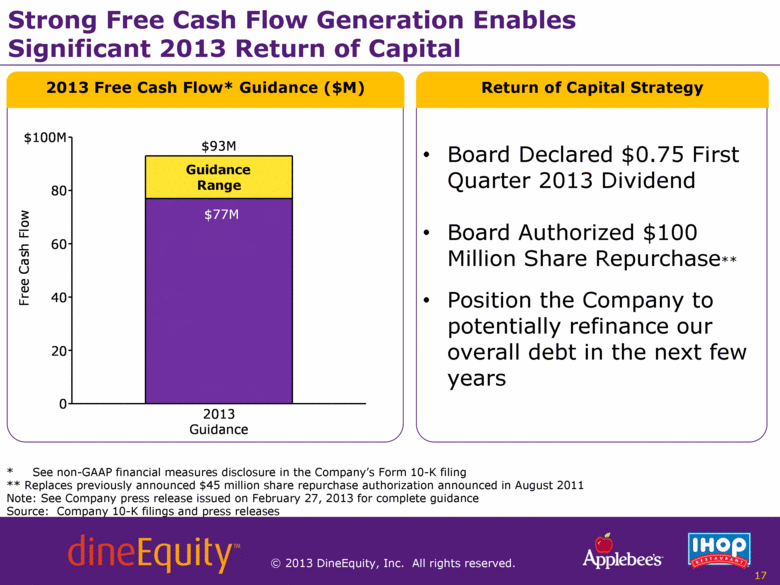
Strong Free Cash Flow Generation Enables Significant 2013 Return of Capital * See non-GAAP financial measures disclosure in the Company’s Form 10-K filing ** Replaces previously announced $45 million share repurchase authorization announced in August 2011 Note: See Company press release issued on February 27, 2013 for complete guidance Source: Company 10-K filings and press releases 17 2013 Free Cash Flow* Guidance ($M) Return of Capital Strategy Board Declared $0.75 First Quarter 2013 Dividend Board Authorized $100 Million Share Repurchase** Position the Company to potentially refinance our overall debt in the next few years 0 20 40 60 80 $100M 2013 Guidance Guidance Range $93M Free Cash Flow $77M |
|
|
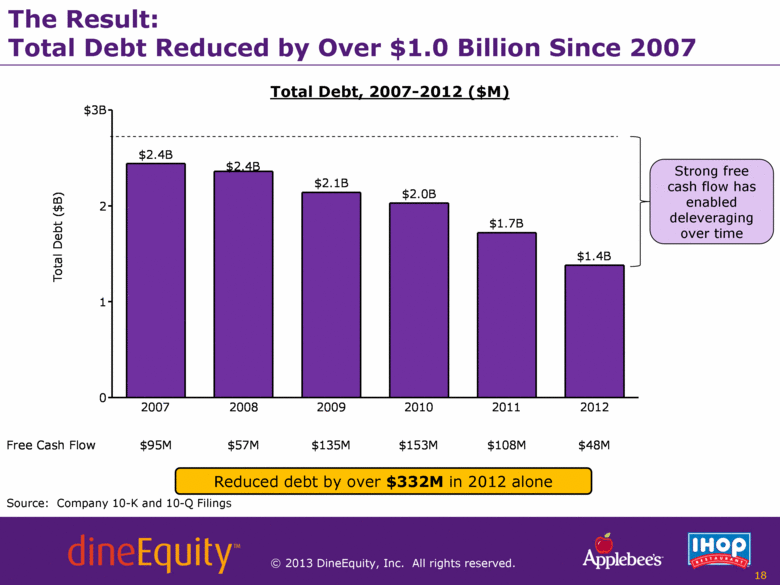
The Result: Total Debt Reduced by Over $1.0 Billion Since 2007 Total Debt, 2007-2012 ($M) Source: Company 10-K and 10-Q Filings 18 Reduced debt by over $332M in 2012 alone Strong free cash flow has enabled deleveraging over time 0 1 2 $3B 0 1 2 $3B 2007 $2.4B 2008 2009 $2.1B 2010 $2.0B 2011 $1.7B 2012 $1.4B Total Debt ($B) $2.4B $95M $57M $135M $153M $108M $48M Free Cash Flow |
|
|
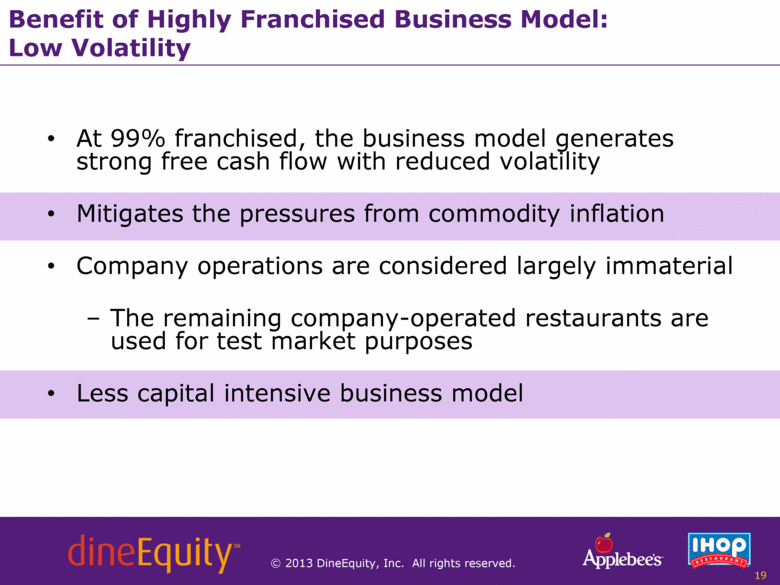
Benefit of Highly Franchised Business Model: Low Volatility At 99% franchised, the business model generates strong free cash flow with reduced volatility Mitigates the pressures from commodity inflation Company operations are considered largely immaterial The remaining company-operated restaurants are used for test market purposes Less capital intensive business model 19 |
|
|
2013 Financial Guidance Highlights* Operating Variables Cash Flow Same Restaurant Sales Applebee’s -1.5% to 1.5% IHOP -1.5% to 1.5% Development Applebee’s 40 to 50 IHOP 50 to 60 G&A $144M to $147M Segment Profit Franchise $312M to $325M Company Operated Approx. $1M Rental and Financing $34M to $35M Cash from Operations $88M to $102M Long-term Receivables Approx. $14M Principal payments on capital leases and financing obligations Approx. $10M Mandatory annual 1% repayment on Term Loan Approximately $5M Capital Expenditures $8M to $10M Free Cash Flow $77M to $93M Return of Cash to Shareholders 20 * See Company press release issued on February 27, 2013 for complete guidance |

